Cities with the Lowest Poverty Level Among Single Males in Indiana
RELATED REPORTS & OPTIONS
Lowest Poverty | Single Male
Indiana
Compare Cities
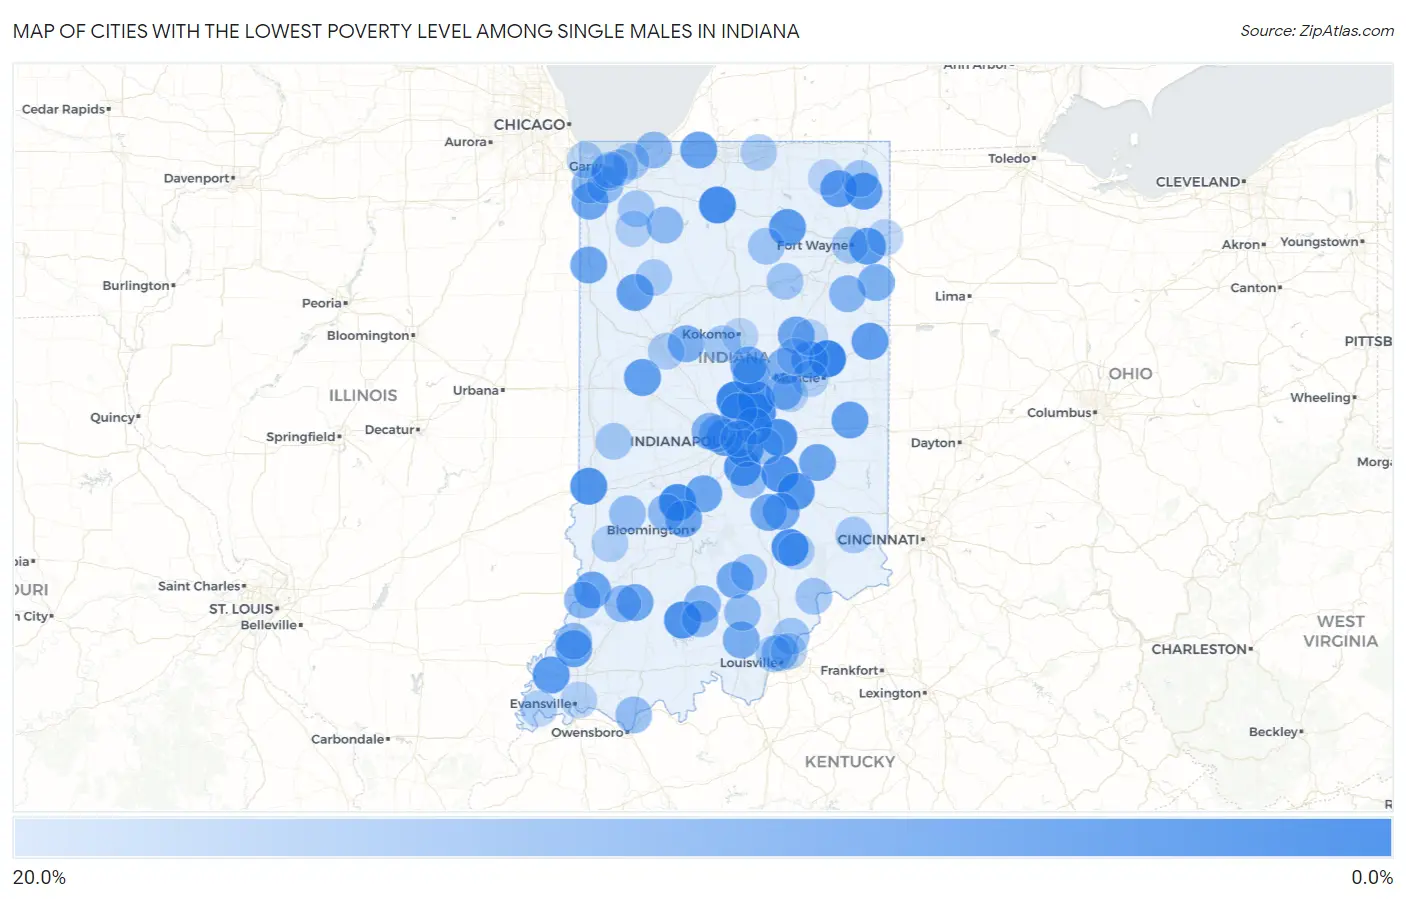
Map of Cities with the Lowest Poverty Level Among Single Males in Indiana
20.0%
0.0%
Cities with the Lowest Poverty Level Among Single Males in Indiana
| City | Single Male Poverty | vs State | vs National | |
| 1. | Eaton | 1.1% | 13.2%(-12.0)#1 | 12.4%(-11.3)#51 |
| 2. | Westfield | 1.3% | 13.2%(-11.9)#2 | 12.4%(-11.2)#65 |
| 3. | Gosport | 2.6% | 13.2%(-10.6)#3 | 12.4%(-9.87)#279 |
| 4. | Plymouth | 2.8% | 13.2%(-10.4)#4 | 12.4%(-9.66)#306 |
| 5. | Fishers | 3.0% | 13.2%(-10.2)#5 | 12.4%(-9.44)#351 |
| 6. | Country Squire Lakes | 3.1% | 13.2%(-10.0)#6 | 12.4%(-9.31)#377 |
| 7. | Noblesville | 3.3% | 13.2%(-9.87)#7 | 12.4%(-9.15)#411 |
| 8. | Shelbyville | 3.5% | 13.2%(-9.67)#8 | 12.4%(-8.95)#455 |
| 9. | Greenfield | 3.5% | 13.2%(-9.64)#9 | 12.4%(-8.92)#461 |
| 10. | French Lick | 3.6% | 13.2%(-9.52)#10 | 12.4%(-8.80)#500 |
| 11. | West Terre Haute | 3.9% | 13.2%(-9.21)#11 | 12.4%(-8.49)#564 |
| 12. | St Paul | 4.1% | 13.2%(-9.08)#12 | 12.4%(-8.35)#602 |
| 13. | Greenwood | 4.3% | 13.2%(-8.82)#13 | 12.4%(-8.10)#659 |
| 14. | Beech Grove | 4.4% | 13.2%(-8.75)#14 | 12.4%(-8.03)#678 |
| 15. | Lawrence | 4.8% | 13.2%(-8.32)#15 | 12.4%(-7.60)#790 |
| 16. | New Haven | 4.9% | 13.2%(-8.22)#16 | 12.4%(-7.49)#816 |
| 17. | Pierceton | 5.0% | 13.2%(-8.21)#17 | 12.4%(-7.48)#818 |
| 18. | Waterloo | 5.0% | 13.2%(-8.16)#18 | 12.4%(-7.44)#836 |
| 19. | Poseyville | 5.1% | 13.2%(-8.09)#19 | 12.4%(-7.37)#857 |
| 20. | Kendallville | 5.5% | 13.2%(-7.70)#20 | 12.4%(-6.97)#955 |
| 21. | Portland | 5.7% | 13.2%(-7.49)#21 | 12.4%(-6.77)#1,003 |
| 22. | New Richmond | 5.9% | 13.2%(-7.27)#22 | 12.4%(-6.55)#1,067 |
| 23. | Princeton | 5.9% | 13.2%(-7.26)#23 | 12.4%(-6.54)#1,072 |
| 24. | Speedway | 6.2% | 13.2%(-6.94)#24 | 12.4%(-6.21)#1,145 |
| 25. | Gaston | 6.2% | 13.2%(-6.91)#25 | 12.4%(-6.19)#1,161 |
| 26. | Wolcott | 6.3% | 13.2%(-6.84)#26 | 12.4%(-6.12)#1,176 |
| 27. | Hagerstown | 6.4% | 13.2%(-6.77)#27 | 12.4%(-6.05)#1,196 |
| 28. | New Carlisle | 6.6% | 13.2%(-6.60)#28 | 12.4%(-5.88)#1,242 |
| 29. | Atlanta | 6.7% | 13.2%(-6.49)#29 | 12.4%(-5.77)#1,277 |
| 30. | Bruceville | 6.7% | 13.2%(-6.49)#30 | 12.4%(-5.77)#1,283 |
| 31. | Martinsville | 6.9% | 13.2%(-6.24)#31 | 12.4%(-5.52)#1,357 |
| 32. | Ellettsville | 6.9% | 13.2%(-6.23)#32 | 12.4%(-5.51)#1,360 |
| 33. | Tipton | 7.0% | 13.2%(-6.17)#33 | 12.4%(-5.45)#1,380 |
| 34. | Cedar Lake | 7.1% | 13.2%(-6.01)#34 | 12.4%(-5.29)#1,409 |
| 35. | Jonesboro | 7.1% | 13.2%(-6.01)#35 | 12.4%(-5.29)#1,419 |
| 36. | Rushville | 7.2% | 13.2%(-5.91)#36 | 12.4%(-5.19)#1,456 |
| 37. | Morocco | 7.3% | 13.2%(-5.84)#37 | 12.4%(-5.12)#1,474 |
| 38. | Hope | 7.4% | 13.2%(-5.75)#38 | 12.4%(-5.03)#1,491 |
| 39. | Montgomery | 7.5% | 13.2%(-5.66)#39 | 12.4%(-4.94)#1,525 |
| 40. | Medora | 7.7% | 13.2%(-5.46)#40 | 12.4%(-4.74)#1,589 |
| 41. | Clifford | 7.7% | 13.2%(-5.46)#41 | 12.4%(-4.74)#1,599 |
| 42. | Edgewood | 8.3% | 13.2%(-4.82)#42 | 12.4%(-4.10)#1,784 |
| 43. | Palmyra | 8.3% | 13.2%(-4.82)#43 | 12.4%(-4.10)#1,788 |
| 44. | Rossville | 8.7% | 13.2%(-4.46)#44 | 12.4%(-3.74)#1,902 |
| 45. | Decatur | 8.9% | 13.2%(-4.27)#45 | 12.4%(-3.55)#1,952 |
| 46. | Clermont | 9.1% | 13.2%(-4.07)#46 | 12.4%(-3.34)#2,008 |
| 47. | Orestes | 9.1% | 13.2%(-4.07)#47 | 12.4%(-3.34)#2,028 |
| 48. | Brownsburg | 9.4% | 13.2%(-3.76)#48 | 12.4%(-3.04)#2,111 |
| 49. | Vincennes | 9.9% | 13.2%(-3.29)#49 | 12.4%(-2.57)#2,237 |
| 50. | Bluffton | 10.0% | 13.2%(-3.16)#50 | 12.4%(-2.44)#2,265 |
| 51. | Orleans | 10.0% | 13.2%(-3.16)#51 | 12.4%(-2.44)#2,281 |
| 52. | Clarksville | 10.3% | 13.2%(-2.81)#52 | 12.4%(-2.09)#2,412 |
| 53. | Schererville | 10.6% | 13.2%(-2.58)#53 | 12.4%(-1.86)#2,476 |
| 54. | North Judson | 10.6% | 13.2%(-2.52)#54 | 12.4%(-1.80)#2,489 |
| 55. | Michigan City | 10.7% | 13.2%(-2.46)#55 | 12.4%(-1.74)#2,497 |
| 56. | Patoka | 10.7% | 13.2%(-2.44)#56 | 12.4%(-1.72)#2,507 |
| 57. | Carmel | 10.9% | 13.2%(-2.31)#57 | 12.4%(-1.58)#2,545 |
| 58. | Washington | 10.9% | 13.2%(-2.28)#58 | 12.4%(-1.55)#2,551 |
| 59. | Paoli | 11.0% | 13.2%(-2.20)#59 | 12.4%(-1.48)#2,580 |
| 60. | Spencer | 11.0% | 13.2%(-2.20)#60 | 12.4%(-1.48)#2,582 |
| 61. | Merrillville | 11.0% | 13.2%(-2.17)#61 | 12.4%(-1.45)#2,588 |
| 62. | Salem | 11.2% | 13.2%(-1.91)#62 | 12.4%(-1.19)#2,696 |
| 63. | New Chicago | 11.4% | 13.2%(-1.76)#63 | 12.4%(-1.04)#2,743 |
| 64. | Franklin | 11.4% | 13.2%(-1.75)#64 | 12.4%(-1.03)#2,747 |
| 65. | Rockport | 11.4% | 13.2%(-1.73)#65 | 12.4%(-1.01)#2,752 |
| 66. | Clay City | 11.8% | 13.2%(-1.39)#66 | 12.4%(-0.671)#2,858 |
| 67. | Charlestown | 12.3% | 13.2%(-0.862)#67 | 12.4%(-0.140)#2,993 |
| 68. | Porter | 12.5% | 13.2%(-0.657)#68 | 12.4%(+0.065)#3,040 |
| 69. | Brownstown | 12.5% | 13.2%(-0.657)#69 | 12.4%(+0.065)#3,049 |
| 70. | Ashley | 12.5% | 13.2%(-0.657)#70 | 12.4%(+0.065)#3,070 |
| 71. | Silver Lake | 12.5% | 13.2%(-0.657)#71 | 12.4%(+0.065)#3,074 |
| 72. | Lagro | 12.5% | 13.2%(-0.657)#72 | 12.4%(+0.065)#3,093 |
| 73. | Hanover | 12.6% | 13.2%(-0.592)#73 | 12.4%(+0.130)#3,111 |
| 74. | Portage | 13.0% | 13.2%(-0.194)#74 | 12.4%(+0.528)#3,196 |
| 75. | Indianapolis | 13.0% | 13.2%(-0.157)#75 | 12.4%(+0.565)#3,204 |
| 76. | Rockville | 13.0% | 13.2%(-0.114)#76 | 12.4%(+0.608)#3,215 |
| 77. | Kouts | 13.0% | 13.2%(-0.114)#77 | 12.4%(+0.608)#3,217 |
| 78. | Russiaville | 13.0% | 13.2%(-0.114)#78 | 12.4%(+0.608)#3,221 |
| 79. | Fort Wayne | 13.1% | 13.2%(-0.101)#79 | 12.4%(+0.621)#3,232 |
| 80. | New Palestine | 13.2% | 13.2%(+0.001)#80 | 12.4%(+0.723)#3,246 |
| 81. | North Vernon | 13.2% | 13.2%(+0.063)#81 | 12.4%(+0.785)#3,261 |
| 82. | Milan | 13.3% | 13.2%(+0.176)#82 | 12.4%(+0.898)#3,289 |
| 83. | Monon | 13.3% | 13.2%(+0.176)#83 | 12.4%(+0.898)#3,292 |
| 84. | New Albany | 13.6% | 13.2%(+0.479)#84 | 12.4%(+1.20)#3,367 |
| 85. | Summitville | 13.8% | 13.2%(+0.636)#85 | 12.4%(+1.36)#3,407 |
| 86. | Dayton | 13.8% | 13.2%(+0.636)#86 | 12.4%(+1.36)#3,408 |
| 87. | Lake Station | 13.8% | 13.2%(+0.647)#87 | 12.4%(+1.37)#3,412 |
| 88. | Elkhart | 14.0% | 13.2%(+0.886)#88 | 12.4%(+1.61)#3,481 |
| 89. | Hammond | 14.1% | 13.2%(+0.970)#89 | 12.4%(+1.69)#3,496 |
| 90. | Yorktown | 14.3% | 13.2%(+1.13)#90 | 12.4%(+1.85)#3,520 |
| 91. | Wheatfield | 14.3% | 13.2%(+1.13)#91 | 12.4%(+1.85)#3,548 |
| 92. | Dugger | 14.3% | 13.2%(+1.13)#92 | 12.4%(+1.85)#3,551 |
| 93. | Mount Vernon | 14.5% | 13.2%(+1.32)#93 | 12.4%(+2.04)#3,613 |
| 94. | Jeffersonville | 14.5% | 13.2%(+1.38)#94 | 12.4%(+2.11)#3,627 |
| 95. | Anderson | 14.6% | 13.2%(+1.45)#95 | 12.4%(+2.18)#3,642 |
| 96. | Woodburn | 14.7% | 13.2%(+1.55)#96 | 12.4%(+2.27)#3,663 |
| 97. | Evansville | 14.8% | 13.2%(+1.69)#97 | 12.4%(+2.41)#3,693 |
| 98. | Kokomo | 15.1% | 13.2%(+1.98)#98 | 12.4%(+2.71)#3,752 |
| 99. | Wolcottville | 15.2% | 13.2%(+1.99)#99 | 12.4%(+2.72)#3,759 |
| 100. | Upland | 15.2% | 13.2%(+2.06)#100 | 12.4%(+2.78)#3,774 |
Common Questions
What are the Top 10 Cities with the Lowest Poverty Level Among Single Males in Indiana?
Top 10 Cities with the Lowest Poverty Level Among Single Males in Indiana are:
#1
1.1%
#2
1.3%
#3
2.6%
#4
2.8%
#5
3.0%
#6
3.1%
#7
3.3%
#8
3.5%
#9
3.5%
#10
3.6%
What city has the Lowest Poverty Level Among Single Males in Indiana?
Eaton has the Lowest Poverty Level Among Single Males in Indiana with 1.1%.
What is the Poverty Level Among Single Males in the State of Indiana?
Poverty Level Among Single Males in Indiana is 13.2%.
What is the Poverty Level Among Single Males in the United States?
Poverty Level Among Single Males in the United States is 12.4%.