Cities with the Largest Icelander Community in the United States
RELATED REPORTS & OPTIONS
Icelander
United States
Compare Cities
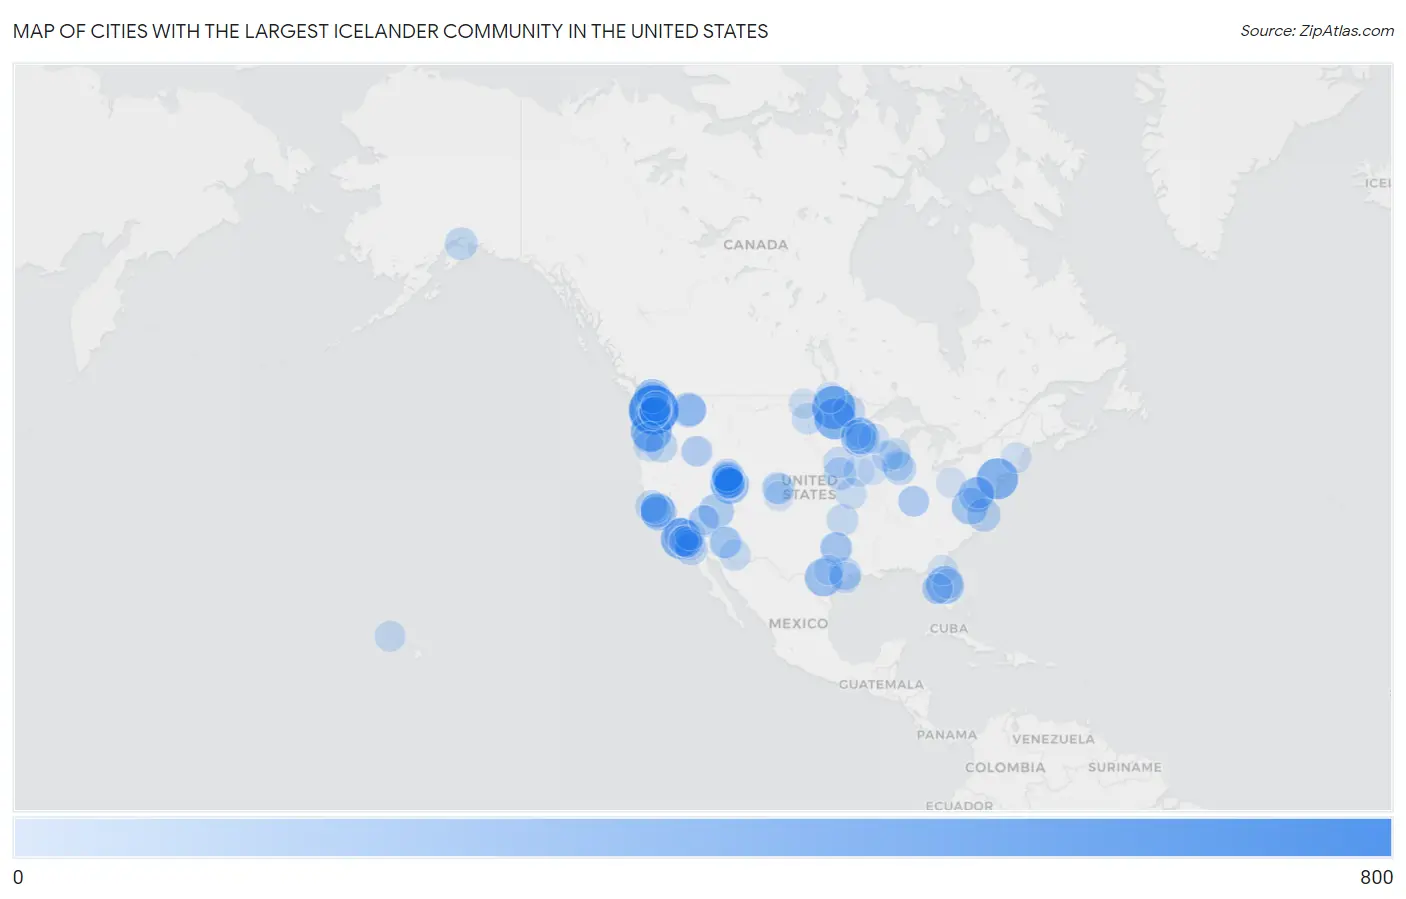
Map of Cities with the Largest Icelander Community in the United States
0
800
Cities with the Largest Icelander Community in the United States
| City | Icelander | vs State | vs National | |
| 1. | Seattle | 778 | 5,727(13.58%)#1 | 51,665(1.51%)#1 |
| 2. | Grand Forks | 539 | 2,958(18.22%)#1 | 51,665(1.04%)#2 |
| 3. | New York | 473 | 1,517(31.18%)#1 | 51,665(0.92%)#3 |
| 4. | Fargo | 469 | 2,958(15.86%)#2 | 51,665(0.91%)#4 |
| 5. | Los Angeles | 456 | 6,565(6.95%)#1 | 51,665(0.88%)#5 |
| 6. | Portland | 455 | 1,814(25.08%)#1 | 51,665(0.88%)#6 |
| 7. | Minneapolis | 365 | 3,123(11.69%)#1 | 51,665(0.71%)#7 |
| 8. | Orlando | 357 | 2,342(15.24%)#1 | 51,665(0.69%)#8 |
| 9. | Spanish Fork | 356 | 4,227(8.42%)#1 | 51,665(0.69%)#9 |
| 10. | San Antonio | 353 | 2,540(13.90%)#1 | 51,665(0.68%)#10 |
| 11. | Bellingham | 322 | 5,727(5.62%)#2 | 51,665(0.62%)#11 |
| 12. | Goochland | 300 | 1,337(22.44%)#1 | 51,665(0.58%)#12 |
| 13. | Gilroy | 283 | 6,565(4.31%)#2 | 51,665(0.55%)#13 |
| 14. | Washington | 269 | 269(100.00%)#1 | 51,665(0.52%)#14 |
| 15. | St George | 257 | 4,227(6.08%)#2 | 51,665(0.50%)#15 |
| 16. | Eagle Mountain | 254 | 4,227(6.01%)#3 | 51,665(0.49%)#16 |
| 17. | Spokane | 248 | 5,727(4.33%)#3 | 51,665(0.48%)#17 |
| 18. | Santa Clarita | 237 | 6,565(3.61%)#3 | 51,665(0.46%)#18 |
| 19. | San Jose | 235 | 6,565(3.58%)#4 | 51,665(0.45%)#19 |
| 20. | Cottage Lake | 213 | 5,727(3.72%)#4 | 51,665(0.41%)#20 |
| 21. | Saratoga Springs | 204 | 4,227(4.83%)#4 | 51,665(0.39%)#21 |
| 22. | Virginia Beach | 199 | 1,337(14.88%)#2 | 51,665(0.39%)#22 |
| 23. | Millcreek | 183 | 4,227(4.33%)#5 | 51,665(0.35%)#23 |
| 24. | Omaha | 177 | 389(45.50%)#1 | 51,665(0.34%)#24 |
| 25. | San Diego | 175 | 6,565(2.67%)#5 | 51,665(0.34%)#25 |
| 26. | Anchorage | 171 | 287(59.58%)#1 | 51,665(0.33%)#26 |
| 27. | Chicago | 170 | 820(20.73%)#1 | 51,665(0.33%)#27 |
| 28. | Houston | 169 | 2,540(6.65%)#2 | 51,665(0.33%)#28 |
| 29. | Layton | 169 | 4,227(4.00%)#6 | 51,665(0.33%)#29 |
| 30. | Dallas | 168 | 2,540(6.61%)#3 | 51,665(0.33%)#30 |
| 31. | Irvine | 167 | 6,565(2.54%)#6 | 51,665(0.32%)#31 |
| 32. | Pleasant Grove | 167 | 4,227(3.95%)#7 | 51,665(0.32%)#32 |
| 33. | Bend | 166 | 1,814(9.15%)#2 | 51,665(0.32%)#33 |
| 34. | Tacoma | 162 | 5,727(2.83%)#5 | 51,665(0.31%)#34 |
| 35. | San Francisco | 160 | 6,565(2.44%)#7 | 51,665(0.31%)#35 |
| 36. | Bemidji | 159 | 3,123(5.09%)#2 | 51,665(0.31%)#36 |
| 37. | Spokane Valley | 154 | 5,727(2.69%)#6 | 51,665(0.30%)#37 |
| 38. | Renton | 149 | 5,727(2.60%)#7 | 51,665(0.29%)#38 |
| 39. | Phoenix | 145 | 1,040(13.94%)#1 | 51,665(0.28%)#39 |
| 40. | Baltimore | 144 | 851(16.92%)#1 | 51,665(0.28%)#40 |
| 41. | Tulsa | 144 | 394(36.55%)#1 | 51,665(0.28%)#41 |
| 42. | Santa Cruz | 144 | 6,565(2.19%)#8 | 51,665(0.28%)#42 |
| 43. | Huntington Beach | 143 | 6,565(2.18%)#9 | 51,665(0.28%)#43 |
| 44. | Henderson | 142 | 599(23.71%)#1 | 51,665(0.27%)#44 |
| 45. | Kirkland | 138 | 5,727(2.41%)#8 | 51,665(0.27%)#45 |
| 46. | Denver | 134 | 1,734(7.73%)#1 | 51,665(0.26%)#46 |
| 47. | Ferndale | 134 | 5,727(2.34%)#9 | 51,665(0.26%)#47 |
| 48. | Tucson | 132 | 1,040(12.69%)#2 | 51,665(0.26%)#48 |
| 49. | Kent | 129 | 5,727(2.25%)#10 | 51,665(0.25%)#49 |
| 50. | Glendale | 128 | 1,040(12.31%)#3 | 51,665(0.25%)#50 |
| 51. | Bismarck | 128 | 2,958(4.33%)#3 | 51,665(0.25%)#51 |
| 52. | Salt Lake City | 127 | 4,227(3.00%)#8 | 51,665(0.25%)#52 |
| 53. | Sioux City | 127 | 604(21.03%)#1 | 51,665(0.25%)#53 |
| 54. | Iowa Colony | 127 | 2,540(5.00%)#4 | 51,665(0.25%)#54 |
| 55. | Barrington | 126 | 820(15.37%)#2 | 51,665(0.24%)#55 |
| 56. | Cavalier | 126 | 2,958(4.26%)#4 | 51,665(0.24%)#56 |
| 57. | Aurora | 125 | 1,734(7.21%)#2 | 51,665(0.24%)#57 |
| 58. | Salem | 125 | 1,814(6.89%)#3 | 51,665(0.24%)#58 |
| 59. | Hartford | 124 | 1,325(9.36%)#1 | 51,665(0.24%)#59 |
| 60. | Bloomington | 123 | 3,123(3.94%)#3 | 51,665(0.24%)#60 |
| 61. | Provo | 122 | 4,227(2.89%)#9 | 51,665(0.24%)#61 |
| 62. | Kansas City | 120 | 384(31.25%)#1 | 51,665(0.23%)#62 |
| 63. | Middleton | 118 | 1,325(8.91%)#2 | 51,665(0.23%)#63 |
| 64. | Ephrata Borough | 118 | 795(14.84%)#1 | 51,665(0.23%)#64 |
| 65. | Isanti | 118 | 3,123(3.78%)#4 | 51,665(0.23%)#65 |
| 66. | Eagan | 117 | 3,123(3.75%)#5 | 51,665(0.23%)#66 |
| 67. | Canon City | 117 | 1,734(6.75%)#3 | 51,665(0.23%)#67 |
| 68. | West Jordan | 116 | 4,227(2.74%)#10 | 51,665(0.22%)#68 |
| 69. | Lawai | 116 | 307(37.79%)#1 | 51,665(0.22%)#69 |
| 70. | Boise City | 114 | 557(20.47%)#1 | 51,665(0.22%)#70 |
| 71. | Sienna | 112 | 2,540(4.41%)#5 | 51,665(0.22%)#71 |
| 72. | Des Moines | 110 | 604(18.21%)#2 | 51,665(0.21%)#72 |
| 73. | Eugene | 109 | 1,814(6.01%)#4 | 51,665(0.21%)#73 |
| 74. | Springville | 109 | 4,227(2.58%)#11 | 51,665(0.21%)#74 |
| 75. | Plano | 107 | 2,540(4.21%)#6 | 51,665(0.21%)#75 |
| 76. | Oceanside | 107 | 6,565(1.63%)#10 | 51,665(0.21%)#76 |
| 77. | Mission Viejo | 105 | 6,565(1.60%)#11 | 51,665(0.20%)#77 |
| 78. | Farmington | 104 | 4,227(2.46%)#12 | 51,665(0.20%)#78 |
| 79. | Spring Valley Lake | 104 | 6,565(1.58%)#12 | 51,665(0.20%)#79 |
| 80. | Jeffersonville | 103 | 371(27.76%)#1 | 51,665(0.20%)#80 |
| 81. | American Fork | 102 | 4,227(2.41%)#13 | 51,665(0.20%)#81 |
| 82. | Louisville | 99 | 250(39.60%)#1 | 51,665(0.19%)#82 |
| 83. | Tampa | 98 | 2,342(4.18%)#2 | 51,665(0.19%)#83 |
| 84. | Manchester | 97 | 260(37.31%)#1 | 51,665(0.19%)#84 |
| 85. | Austin | 96 | 2,540(3.78%)#7 | 51,665(0.19%)#85 |
| 86. | Eau Claire | 96 | 1,325(7.25%)#3 | 51,665(0.19%)#86 |
| 87. | Highlands Borough | 96 | 523(18.36%)#1 | 51,665(0.19%)#87 |
| 88. | Carrollwood | 95 | 2,342(4.06%)#3 | 51,665(0.18%)#88 |
| 89. | Long Beach | 93 | 6,565(1.42%)#13 | 51,665(0.18%)#89 |
| 90. | Minot | 93 | 2,958(3.14%)#5 | 51,665(0.18%)#90 |
| 91. | Jacksonville | 91 | 2,342(3.89%)#4 | 51,665(0.18%)#91 |
| 92. | Meridian | 91 | 557(16.34%)#2 | 51,665(0.18%)#92 |
| 93. | Iowa City | 91 | 604(15.07%)#3 | 51,665(0.18%)#93 |
| 94. | Summerlin South | 91 | 599(15.19%)#2 | 51,665(0.18%)#94 |
| 95. | Bithlo | 91 | 2,342(3.89%)#5 | 51,665(0.18%)#95 |
| 96. | Everett | 90 | 5,727(1.57%)#11 | 51,665(0.17%)#96 |
| 97. | Palo Alto | 89 | 6,565(1.36%)#14 | 51,665(0.17%)#97 |
| 98. | Follansbee | 89 | 89(100.00%)#1 | 51,665(0.17%)#98 |
| 99. | Colorado Springs | 88 | 1,734(5.07%)#4 | 51,665(0.17%)#99 |
| 100. | Buffalo | 86 | 3,123(2.75%)#6 | 51,665(0.17%)#100 |
Common Questions
What are the Top 10 Cities with the Largest Icelander Community in the United States?
Top 10 Cities with the Largest Icelander Community in the United States are:
#1
778
#2
539
#3
473
#4
469
#5
456
#6
455
#7
365
#8
357
#9
356
#10
353
What city has the Largest Icelander Community in the United States?
Seattle has the Largest Icelander Community in the United States with 778.
What is the Total Icelander Population in the United States?
Total Icelander Population in the United States is 51,665.