Cities with the Largest Asian Community in Michigan
RELATED REPORTS & OPTIONS
Asian
Michigan
Compare Cities
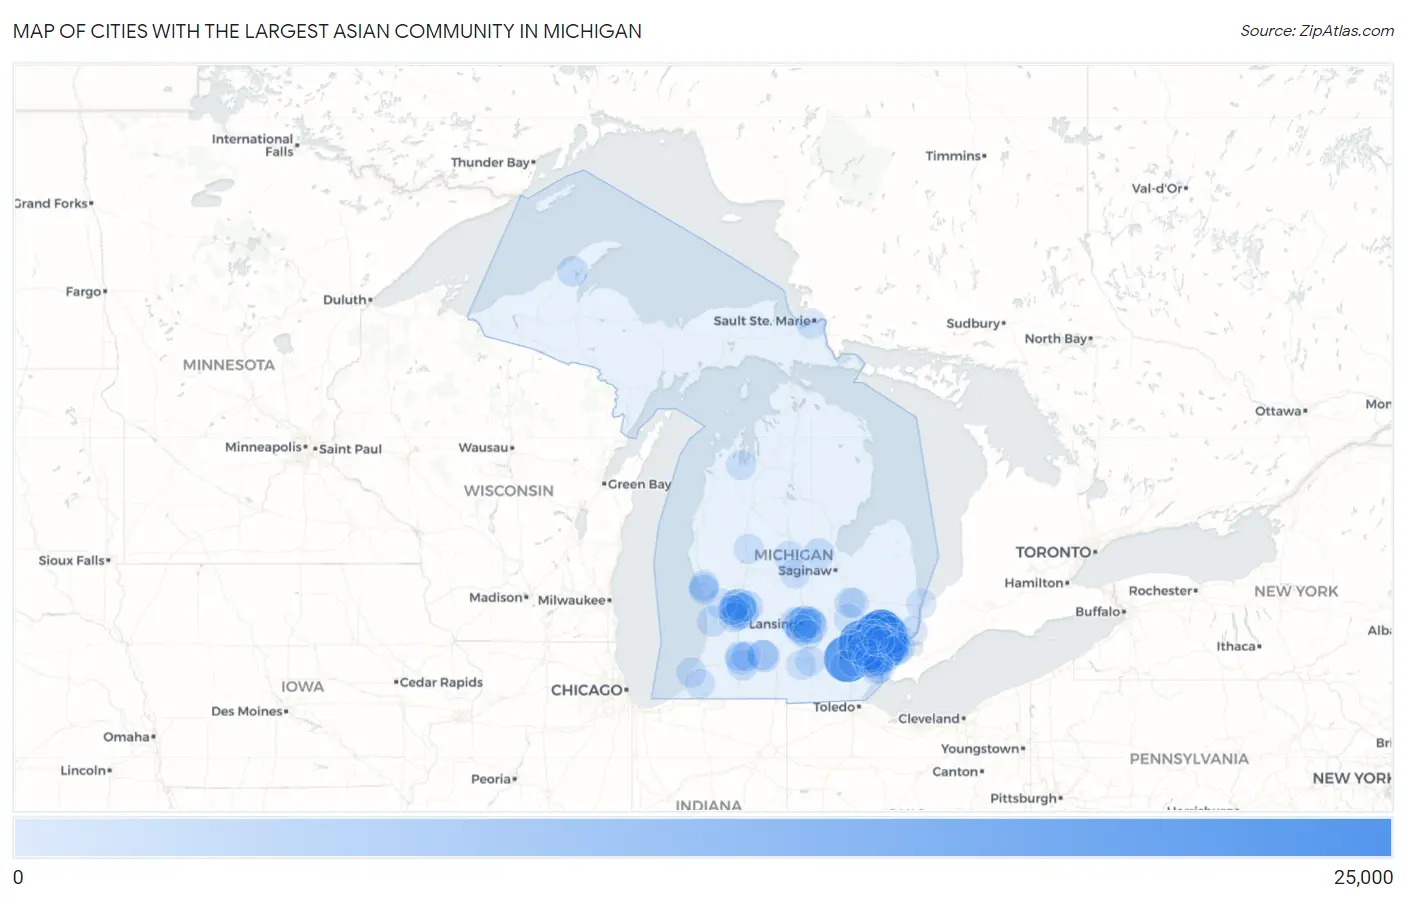
Map of Cities with the Largest Asian Community in Michigan
0
25,000
Cities with the Largest Asian Community in Michigan
| City | Asian | vs State | vs National | |
| 1. | Troy | 22,644 | 327,551(6.91%)#1 | 19,112,979(0.12%)#115 |
| 2. | Ann Arbor | 19,715 | 327,551(6.02%)#2 | 19,112,979(0.10%)#132 |
| 3. | Novi | 16,728 | 327,551(5.11%)#3 | 19,112,979(0.09%)#165 |
| 4. | Warren | 14,805 | 327,551(4.52%)#4 | 19,112,979(0.08%)#188 |
| 5. | Farmington Hills | 12,109 | 327,551(3.70%)#5 | 19,112,979(0.06%)#234 |
| 6. | Sterling Heights | 11,850 | 327,551(3.62%)#6 | 19,112,979(0.06%)#238 |
| 7. | Rochester Hills | 10,425 | 327,551(3.18%)#7 | 19,112,979(0.05%)#268 |
| 8. | Detroit | 10,252 | 327,551(3.13%)#8 | 19,112,979(0.05%)#273 |
| 9. | Hamtramck | 7,253 | 327,551(2.21%)#9 | 19,112,979(0.04%)#408 |
| 10. | Lansing | 5,616 | 327,551(1.71%)#10 | 19,112,979(0.03%)#524 |
| 11. | Grand Rapids | 5,591 | 327,551(1.71%)#11 | 19,112,979(0.03%)#528 |
| 12. | Kentwood | 5,091 | 327,551(1.55%)#12 | 19,112,979(0.03%)#581 |
| 13. | Okemos | 5,050 | 327,551(1.54%)#13 | 19,112,979(0.03%)#582 |
| 14. | East Lansing | 4,196 | 327,551(1.28%)#14 | 19,112,979(0.02%)#671 |
| 15. | Auburn Hills | 3,891 | 327,551(1.19%)#15 | 19,112,979(0.02%)#711 |
| 16. | Livonia | 3,467 | 327,551(1.06%)#16 | 19,112,979(0.02%)#794 |
| 17. | Westland | 3,089 | 327,551(0.94%)#17 | 19,112,979(0.02%)#866 |
| 18. | Dearborn | 2,725 | 327,551(0.83%)#18 | 19,112,979(0.01%)#955 |
| 19. | Pontiac | 2,485 | 327,551(0.76%)#19 | 19,112,979(0.01%)#1,031 |
| 20. | Battle Creek | 2,466 | 327,551(0.75%)#20 | 19,112,979(0.01%)#1,036 |
| 21. | Farmington | 2,136 | 327,551(0.65%)#21 | 19,112,979(0.01%)#1,157 |
| 22. | Wyoming | 2,047 | 327,551(0.62%)#22 | 19,112,979(0.01%)#1,204 |
| 23. | Royal Oak | 2,046 | 327,551(0.62%)#23 | 19,112,979(0.01%)#1,206 |
| 24. | Kalamazoo | 1,851 | 327,551(0.57%)#24 | 19,112,979(0.01%)#1,289 |
| 25. | Madison Heights | 1,822 | 327,551(0.56%)#25 | 19,112,979(0.01%)#1,306 |
| 26. | Waverly | 1,705 | 327,551(0.52%)#26 | 19,112,979(0.01%)#1,361 |
| 27. | Haslett | 1,577 | 327,551(0.48%)#27 | 19,112,979(0.01%)#1,438 |
| 28. | Southfield | 1,365 | 327,551(0.42%)#28 | 19,112,979(0.01%)#1,577 |
| 29. | Portage | 1,309 | 327,551(0.40%)#29 | 19,112,979(0.01%)#1,618 |
| 30. | Forest Hills | 1,217 | 327,551(0.37%)#30 | 19,112,979(0.01%)#1,694 |
| 31. | Midland | 1,201 | 327,551(0.37%)#31 | 19,112,979(0.01%)#1,710 |
| 32. | Holt | 1,191 | 327,551(0.36%)#32 | 19,112,979(0.01%)#1,720 |
| 33. | Wixom | 1,165 | 327,551(0.36%)#33 | 19,112,979(0.01%)#1,750 |
| 34. | Cutlerville | 1,092 | 327,551(0.33%)#34 | 19,112,979(0.01%)#1,828 |
| 35. | Holland | 1,052 | 327,551(0.32%)#35 | 19,112,979(0.01%)#1,871 |
| 36. | Ypsilanti | 1,048 | 327,551(0.32%)#36 | 19,112,979(0.01%)#1,874 |
| 37. | Birmingham | 1,030 | 327,551(0.31%)#37 | 19,112,979(0.01%)#1,895 |
| 38. | Rochester | 979 | 327,551(0.30%)#38 | 19,112,979(0.01%)#1,953 |
| 39. | Dearborn Heights | 859 | 327,551(0.26%)#39 | 19,112,979(0.00%)#2,112 |
| 40. | Southgate | 844 | 327,551(0.26%)#40 | 19,112,979(0.00%)#2,137 |
| 41. | Walker | 808 | 327,551(0.25%)#41 | 19,112,979(0.00%)#2,190 |
| 42. | Houghton | 757 | 327,551(0.23%)#42 | 19,112,979(0.00%)#2,267 |
| 43. | Oak Park | 740 | 327,551(0.23%)#43 | 19,112,979(0.00%)#2,293 |
| 44. | Taylor | 704 | 327,551(0.21%)#44 | 19,112,979(0.00%)#2,365 |
| 45. | Roseville | 674 | 327,551(0.21%)#45 | 19,112,979(0.00%)#2,426 |
| 46. | Mount Pleasant | 601 | 327,551(0.18%)#46 | 19,112,979(0.00%)#2,574 |
| 47. | St Clair Shores | 519 | 327,551(0.16%)#47 | 19,112,979(0.00%)#2,791 |
| 48. | Springfield | 493 | 327,551(0.15%)#48 | 19,112,979(0.00%)#2,873 |
| 49. | Center Line | 480 | 327,551(0.15%)#49 | 19,112,979(0.00%)#2,923 |
| 50. | Ferndale | 475 | 327,551(0.15%)#50 | 19,112,979(0.00%)#2,938 |
| 51. | Allendale | 441 | 327,551(0.13%)#51 | 19,112,979(0.00%)#3,075 |
| 52. | Allen Park | 440 | 327,551(0.13%)#52 | 19,112,979(0.00%)#3,079 |
| 53. | Flint | 428 | 327,551(0.13%)#53 | 19,112,979(0.00%)#3,118 |
| 54. | Walled Lake | 422 | 327,551(0.13%)#54 | 19,112,979(0.00%)#3,140 |
| 55. | Beverly Hills | 403 | 327,551(0.12%)#55 | 19,112,979(0.00%)#3,224 |
| 56. | Westwood | 361 | 327,551(0.11%)#56 | 19,112,979(0.00%)#3,434 |
| 57. | Northville | 349 | 327,551(0.11%)#57 | 19,112,979(0.00%)#3,494 |
| 58. | St Joseph | 342 | 327,551(0.10%)#58 | 19,112,979(0.00%)#3,530 |
| 59. | Utica | 326 | 327,551(0.10%)#59 | 19,112,979(0.00%)#3,613 |
| 60. | Woodhaven | 323 | 327,551(0.10%)#60 | 19,112,979(0.00%)#3,622 |
| 61. | Saline | 322 | 327,551(0.10%)#61 | 19,112,979(0.00%)#3,627 |
| 62. | Hazel Park | 321 | 327,551(0.10%)#62 | 19,112,979(0.00%)#3,629 |
| 63. | Burton | 316 | 327,551(0.10%)#63 | 19,112,979(0.00%)#3,661 |
| 64. | Inkster | 313 | 327,551(0.10%)#64 | 19,112,979(0.00%)#3,672 |
| 65. | Muskegon | 275 | 327,551(0.08%)#65 | 19,112,979(0.00%)#3,884 |
| 66. | Fenton | 272 | 327,551(0.08%)#66 | 19,112,979(0.00%)#3,903 |
| 67. | Eastpointe | 270 | 327,551(0.08%)#67 | 19,112,979(0.00%)#3,913 |
| 68. | Fraser | 261 | 327,551(0.08%)#68 | 19,112,979(0.00%)#3,978 |
| 69. | Port Huron | 253 | 327,551(0.08%)#69 | 19,112,979(0.00%)#4,040 |
| 70. | Orchard Lake Village | 250 | 327,551(0.08%)#70 | 19,112,979(0.00%)#4,073 |
| 71. | Wayne | 248 | 327,551(0.08%)#71 | 19,112,979(0.00%)#4,080 |
| 72. | Byron Center | 247 | 327,551(0.08%)#72 | 19,112,979(0.00%)#4,091 |
| 73. | Clawson | 241 | 327,551(0.07%)#73 | 19,112,979(0.00%)#4,138 |
| 74. | Lincoln Park | 236 | 327,551(0.07%)#74 | 19,112,979(0.00%)#4,176 |
| 75. | Garden City | 234 | 327,551(0.07%)#75 | 19,112,979(0.00%)#4,195 |
| 76. | Mason | 230 | 327,551(0.07%)#76 | 19,112,979(0.00%)#4,235 |
| 77. | Grosse Pointe Woods | 224 | 327,551(0.07%)#77 | 19,112,979(0.00%)#4,277 |
| 78. | Norton Shores | 222 | 327,551(0.07%)#78 | 19,112,979(0.00%)#4,284 |
| 79. | Traverse City | 211 | 327,551(0.06%)#79 | 19,112,979(0.00%)#4,382 |
| 80. | Romulus | 203 | 327,551(0.06%)#80 | 19,112,979(0.00%)#4,453 |
| 81. | Grosse Pointe Farms | 198 | 327,551(0.06%)#81 | 19,112,979(0.00%)#4,514 |
| 82. | Berrien Springs | 198 | 327,551(0.06%)#82 | 19,112,979(0.00%)#4,522 |
| 83. | Spring Arbor | 196 | 327,551(0.06%)#83 | 19,112,979(0.00%)#4,548 |
| 84. | Roosevelt Park | 191 | 327,551(0.06%)#84 | 19,112,979(0.00%)#4,588 |
| 85. | Village Of Grosse Pointe Shores | 187 | 327,551(0.06%)#85 | 19,112,979(0.00%)#4,633 |
| 86. | Comstock Northwest | 186 | 327,551(0.06%)#86 | 19,112,979(0.00%)#4,647 |
| 87. | East Grand Rapids | 185 | 327,551(0.06%)#87 | 19,112,979(0.00%)#4,657 |
| 88. | Plymouth | 182 | 327,551(0.06%)#88 | 19,112,979(0.00%)#4,688 |
| 89. | Grandville | 176 | 327,551(0.05%)#89 | 19,112,979(0.00%)#4,742 |
| 90. | Franklin | 176 | 327,551(0.05%)#90 | 19,112,979(0.00%)#4,751 |
| 91. | Alma | 175 | 327,551(0.05%)#91 | 19,112,979(0.00%)#4,757 |
| 92. | Grosse Pointe Park | 173 | 327,551(0.05%)#92 | 19,112,979(0.00%)#4,793 |
| 93. | Sault Ste Marie | 171 | 327,551(0.05%)#93 | 19,112,979(0.00%)#4,822 |
| 94. | Jackson | 166 | 327,551(0.05%)#94 | 19,112,979(0.00%)#4,875 |
| 95. | Big Rapids | 165 | 327,551(0.05%)#95 | 19,112,979(0.00%)#4,894 |
| 96. | Bloomfield Hills | 160 | 327,551(0.05%)#96 | 19,112,979(0.00%)#4,951 |
| 97. | Trenton | 157 | 327,551(0.05%)#97 | 19,112,979(0.00%)#4,982 |
| 98. | South Lyon | 148 | 327,551(0.05%)#98 | 19,112,979(0.00%)#5,097 |
| 99. | Berkley | 147 | 327,551(0.04%)#99 | 19,112,979(0.00%)#5,103 |
| 100. | Pearl Beach | 139 | 327,551(0.04%)#100 | 19,112,979(0.00%)#5,225 |
Common Questions
What are the Top 10 Cities with the Largest Asian Community in Michigan?
Top 10 Cities with the Largest Asian Community in Michigan are:
#1
22,644
#2
19,715
#3
16,728
#4
14,805
#5
12,109
#6
11,850
#7
10,425
#8
10,252
#9
7,253
#10
5,616
What city has the Largest Asian Community in Michigan?
Troy has the Largest Asian Community in Michigan with 22,644.
What is the Total Asian Population in the State of Michigan?
Total Asian Population in Michigan is 327,551.
What is the Total Asian Population in the United States?
Total Asian Population in the United States is 19,112,979.