Cities with the Largest Asian Community in Georgia
RELATED REPORTS & OPTIONS
Asian
Georgia
Compare Cities
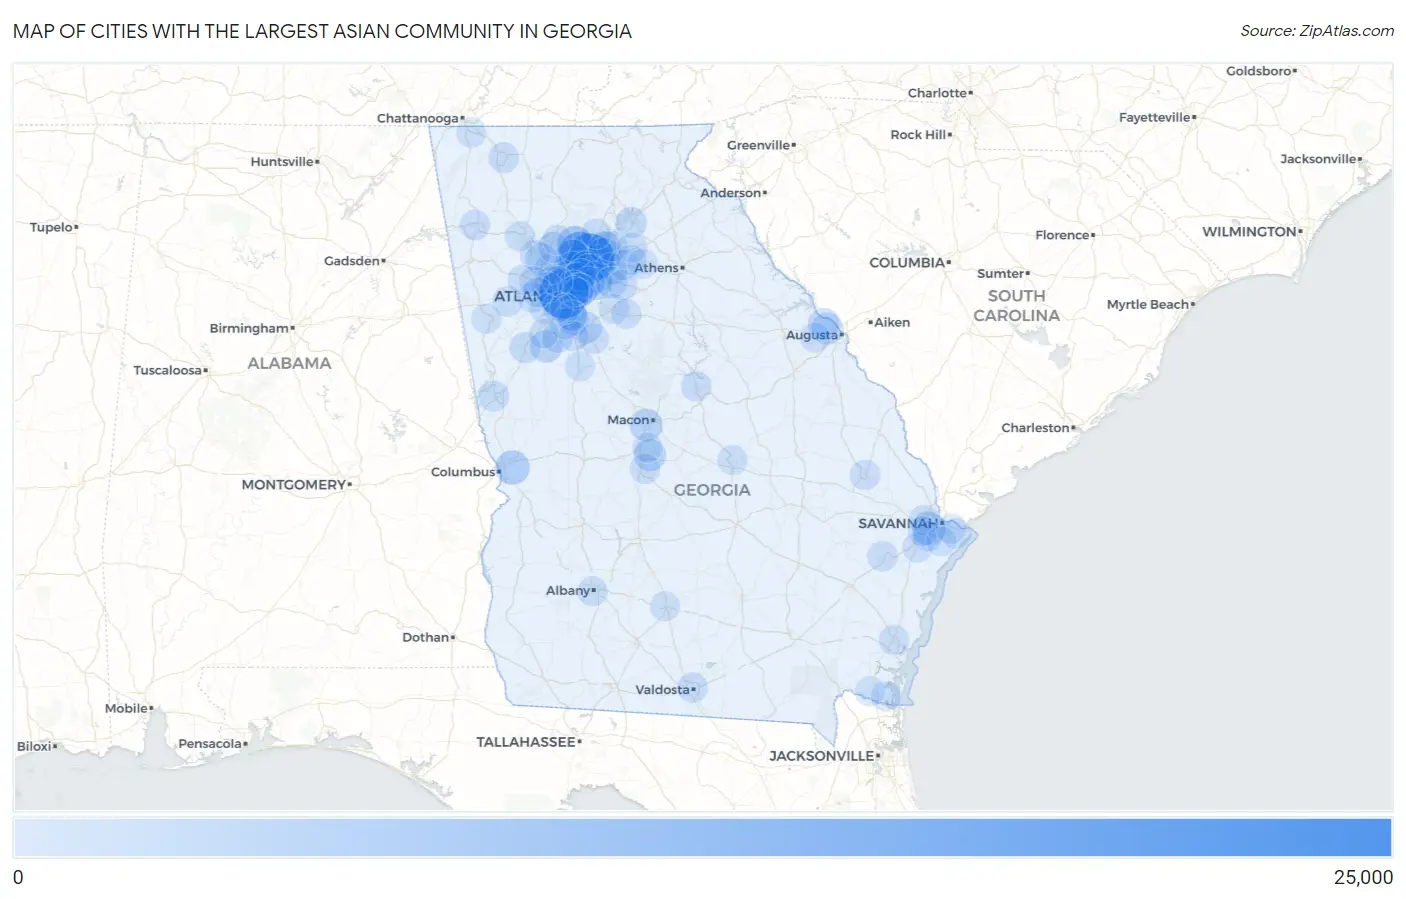
Map of Cities with the Largest Asian Community in Georgia
0
25,000
Cities with the Largest Asian Community in Georgia
| City | Asian | vs State | vs National | |
| 1. | Atlanta | 24,490 | 465,487(5.26%)#1 | 19,112,979(0.13%)#101 |
| 2. | Johns Creek | 22,294 | 465,487(4.79%)#2 | 19,112,979(0.12%)#117 |
| 3. | Alpharetta | 14,562 | 465,487(3.13%)#3 | 19,112,979(0.08%)#192 |
| 4. | Dunwoody | 8,773 | 465,487(1.88%)#4 | 19,112,979(0.05%)#324 |
| 5. | Sandy Springs | 8,362 | 465,487(1.80%)#5 | 19,112,979(0.04%)#343 |
| 6. | Duluth | 7,321 | 465,487(1.57%)#6 | 19,112,979(0.04%)#402 |
| 7. | Milton | 6,811 | 465,487(1.46%)#7 | 19,112,979(0.04%)#438 |
| 8. | Columbus | 5,279 | 465,487(1.13%)#8 | 19,112,979(0.03%)#558 |
| 9. | Athens-Clarke County Unified Government (Balance) | 5,252 | 465,487(1.13%)#9 | 19,112,979(0.03%)#563 |
| 10. | Suwanee | 5,191 | 465,487(1.12%)#10 | 19,112,979(0.03%)#569 |
| 11. | Smyrna | 4,509 | 465,487(0.97%)#11 | 19,112,979(0.02%)#636 |
| 12. | Roswell | 4,172 | 465,487(0.90%)#12 | 19,112,979(0.02%)#673 |
| 13. | Savannah | 4,106 | 465,487(0.88%)#13 | 19,112,979(0.02%)#682 |
| 14. | Brookhaven | 3,873 | 465,487(0.83%)#14 | 19,112,979(0.02%)#715 |
| 15. | Augusta-Richmond County Consolidated Government (Balance) | 3,654 | 465,487(0.78%)#15 | 19,112,979(0.02%)#751 |
| 16. | Peachtree Corners | 3,504 | 465,487(0.75%)#16 | 19,112,979(0.02%)#784 |
| 17. | Macon Bibb County | 3,428 | 465,487(0.74%)#17 | 19,112,979(0.02%)#804 |
| 18. | Peachtree City | 3,141 | 465,487(0.67%)#18 | 19,112,979(0.02%)#858 |
| 19. | Chamblee | 2,916 | 465,487(0.63%)#19 | 19,112,979(0.02%)#906 |
| 20. | Sugar Hill | 2,862 | 465,487(0.61%)#20 | 19,112,979(0.01%)#923 |
| 21. | Warner Robins | 2,725 | 465,487(0.59%)#21 | 19,112,979(0.01%)#956 |
| 22. | Clarkston | 2,577 | 465,487(0.55%)#22 | 19,112,979(0.01%)#999 |
| 23. | Lilburn | 2,551 | 465,487(0.55%)#23 | 19,112,979(0.01%)#1,007 |
| 24. | Mountain Park | 2,484 | 465,487(0.53%)#24 | 19,112,979(0.01%)#1,033 |
| 25. | Norcross | 2,443 | 465,487(0.52%)#25 | 19,112,979(0.01%)#1,043 |
| 26. | Lawrenceville | 2,421 | 465,487(0.52%)#26 | 19,112,979(0.01%)#1,053 |
| 27. | Scottdale | 2,402 | 465,487(0.52%)#27 | 19,112,979(0.01%)#1,061 |
| 28. | Tucker | 2,255 | 465,487(0.48%)#28 | 19,112,979(0.01%)#1,110 |
| 29. | Martinez | 2,251 | 465,487(0.48%)#29 | 19,112,979(0.01%)#1,114 |
| 30. | Doraville | 2,231 | 465,487(0.48%)#30 | 19,112,979(0.01%)#1,120 |
| 31. | Stockbridge | 2,156 | 465,487(0.46%)#31 | 19,112,979(0.01%)#1,148 |
| 32. | North Druid Hills | 2,142 | 465,487(0.46%)#32 | 19,112,979(0.01%)#1,155 |
| 33. | Evans | 2,119 | 465,487(0.46%)#33 | 19,112,979(0.01%)#1,171 |
| 34. | Kennesaw | 2,072 | 465,487(0.45%)#34 | 19,112,979(0.01%)#1,194 |
| 35. | Snellville | 1,891 | 465,487(0.41%)#35 | 19,112,979(0.01%)#1,274 |
| 36. | Morrow | 1,870 | 465,487(0.40%)#36 | 19,112,979(0.01%)#1,278 |
| 37. | North Decatur | 1,790 | 465,487(0.38%)#37 | 19,112,979(0.01%)#1,320 |
| 38. | Newnan | 1,517 | 465,487(0.33%)#38 | 19,112,979(0.01%)#1,469 |
| 39. | Gainesville | 1,480 | 465,487(0.32%)#39 | 19,112,979(0.01%)#1,487 |
| 40. | Marietta | 1,259 | 465,487(0.27%)#40 | 19,112,979(0.01%)#1,657 |
| 41. | Woodstock | 1,231 | 465,487(0.26%)#41 | 19,112,979(0.01%)#1,678 |
| 42. | Lagrange | 1,108 | 465,487(0.24%)#42 | 19,112,979(0.01%)#1,809 |
| 43. | Forest Park | 1,105 | 465,487(0.24%)#43 | 19,112,979(0.01%)#1,815 |
| 44. | Decatur | 1,040 | 465,487(0.22%)#44 | 19,112,979(0.01%)#1,884 |
| 45. | Fayetteville | 1,009 | 465,487(0.22%)#45 | 19,112,979(0.01%)#1,919 |
| 46. | Riverdale | 984 | 465,487(0.21%)#46 | 19,112,979(0.01%)#1,945 |
| 47. | Dalton | 943 | 465,487(0.20%)#47 | 19,112,979(0.00%)#1,990 |
| 48. | Lake City | 871 | 465,487(0.19%)#48 | 19,112,979(0.00%)#2,094 |
| 49. | Hinesville | 833 | 465,487(0.18%)#49 | 19,112,979(0.00%)#2,157 |
| 50. | Rome | 827 | 465,487(0.18%)#50 | 19,112,979(0.00%)#2,167 |
| 51. | Mableton | 824 | 465,487(0.18%)#51 | 19,112,979(0.00%)#2,170 |
| 52. | South Fulton | 787 | 465,487(0.17%)#52 | 19,112,979(0.00%)#2,218 |
| 53. | Valdosta | 787 | 465,487(0.17%)#53 | 19,112,979(0.00%)#2,219 |
| 54. | Acworth | 720 | 465,487(0.15%)#54 | 19,112,979(0.00%)#2,333 |
| 55. | Druid Hills | 720 | 465,487(0.15%)#55 | 19,112,979(0.00%)#2,335 |
| 56. | Villa Rica | 719 | 465,487(0.15%)#56 | 19,112,979(0.00%)#2,336 |
| 57. | Buford | 704 | 465,487(0.15%)#57 | 19,112,979(0.00%)#2,366 |
| 58. | Cumming | 597 | 465,487(0.13%)#58 | 19,112,979(0.00%)#2,586 |
| 59. | Douglasville | 594 | 465,487(0.13%)#59 | 19,112,979(0.00%)#2,596 |
| 60. | Milledgeville | 581 | 465,487(0.12%)#60 | 19,112,979(0.00%)#2,634 |
| 61. | East Point | 572 | 465,487(0.12%)#61 | 19,112,979(0.00%)#2,651 |
| 62. | Statesboro | 563 | 465,487(0.12%)#62 | 19,112,979(0.00%)#2,676 |
| 63. | Mcdonough | 539 | 465,487(0.12%)#63 | 19,112,979(0.00%)#2,734 |
| 64. | Perry | 533 | 465,487(0.11%)#64 | 19,112,979(0.00%)#2,753 |
| 65. | Dacula | 515 | 465,487(0.11%)#65 | 19,112,979(0.00%)#2,808 |
| 66. | Albany | 488 | 465,487(0.10%)#66 | 19,112,979(0.00%)#2,889 |
| 67. | Pooler | 476 | 465,487(0.10%)#67 | 19,112,979(0.00%)#2,934 |
| 68. | Loganville | 472 | 465,487(0.10%)#68 | 19,112,979(0.00%)#2,951 |
| 69. | Holly Springs | 451 | 465,487(0.10%)#69 | 19,112,979(0.00%)#3,031 |
| 70. | Richmond Hill | 437 | 465,487(0.09%)#70 | 19,112,979(0.00%)#3,091 |
| 71. | Hiram | 436 | 465,487(0.09%)#71 | 19,112,979(0.00%)#3,095 |
| 72. | Fort Oglethorpe | 422 | 465,487(0.09%)#72 | 19,112,979(0.00%)#3,139 |
| 73. | Wilmington Island | 418 | 465,487(0.09%)#73 | 19,112,979(0.00%)#3,157 |
| 74. | Auburn | 408 | 465,487(0.09%)#74 | 19,112,979(0.00%)#3,198 |
| 75. | Dublin | 407 | 465,487(0.09%)#75 | 19,112,979(0.00%)#3,202 |
| 76. | Georgetown | 393 | 465,487(0.08%)#76 | 19,112,979(0.00%)#3,273 |
| 77. | Vinings | 392 | 465,487(0.08%)#77 | 19,112,979(0.00%)#3,278 |
| 78. | Winder | 385 | 465,487(0.08%)#78 | 19,112,979(0.00%)#3,313 |
| 79. | Tifton | 383 | 465,487(0.08%)#79 | 19,112,979(0.00%)#3,321 |
| 80. | Bonanza | 358 | 465,487(0.08%)#80 | 19,112,979(0.00%)#3,447 |
| 81. | St Marys | 354 | 465,487(0.08%)#81 | 19,112,979(0.00%)#3,461 |
| 82. | Montgomery | 349 | 465,487(0.07%)#82 | 19,112,979(0.00%)#3,495 |
| 83. | Henderson | 343 | 465,487(0.07%)#83 | 19,112,979(0.00%)#3,526 |
| 84. | Kingsland | 337 | 465,487(0.07%)#84 | 19,112,979(0.00%)#3,558 |
| 85. | Cusseta Chattahoochee County Unified Government | 335 | 465,487(0.07%)#85 | 19,112,979(0.00%)#3,569 |
| 86. | Centerville | 335 | 465,487(0.07%)#86 | 19,112,979(0.00%)#3,570 |
| 87. | Griffin | 329 | 465,487(0.07%)#87 | 19,112,979(0.00%)#3,596 |
| 88. | Bemiss | 314 | 465,487(0.07%)#88 | 19,112,979(0.00%)#3,671 |
| 89. | Lithia Springs | 288 | 465,487(0.06%)#89 | 19,112,979(0.00%)#3,806 |
| 90. | Whitemarsh Island | 284 | 465,487(0.06%)#90 | 19,112,979(0.00%)#3,835 |
| 91. | Conyers | 283 | 465,487(0.06%)#91 | 19,112,979(0.00%)#3,839 |
| 92. | Dock Junction | 282 | 465,487(0.06%)#92 | 19,112,979(0.00%)#3,847 |
| 93. | Powder Springs | 278 | 465,487(0.06%)#93 | 19,112,979(0.00%)#3,865 |
| 94. | Carrollton | 271 | 465,487(0.06%)#94 | 19,112,979(0.00%)#3,908 |
| 95. | Braselton | 269 | 465,487(0.06%)#95 | 19,112,979(0.00%)#3,926 |
| 96. | Oxford | 266 | 465,487(0.06%)#96 | 19,112,979(0.00%)#3,956 |
| 97. | Hapeville | 265 | 465,487(0.06%)#97 | 19,112,979(0.00%)#3,961 |
| 98. | Grovetown | 262 | 465,487(0.06%)#98 | 19,112,979(0.00%)#3,973 |
| 99. | Tyrone | 247 | 465,487(0.05%)#99 | 19,112,979(0.00%)#4,090 |
| 100. | Cartersville | 231 | 465,487(0.05%)#100 | 19,112,979(0.00%)#4,218 |
Common Questions
What are the Top 10 Cities with the Largest Asian Community in Georgia?
Top 10 Cities with the Largest Asian Community in Georgia are:
#1
24,490
#2
22,294
#3
14,562
#4
8,773
#5
8,362
#6
7,321
#7
6,811
#8
5,279
#9
5,191
#10
4,509
What city has the Largest Asian Community in Georgia?
Atlanta has the Largest Asian Community in Georgia with 24,490.
What is the Total Asian Population in the State of Georgia?
Total Asian Population in Georgia is 465,487.
What is the Total Asian Population in the United States?
Total Asian Population in the United States is 19,112,979.