Cities with the Largest Asian Community in Pennsylvania
RELATED REPORTS & OPTIONS
Asian
Pennsylvania
Compare Cities
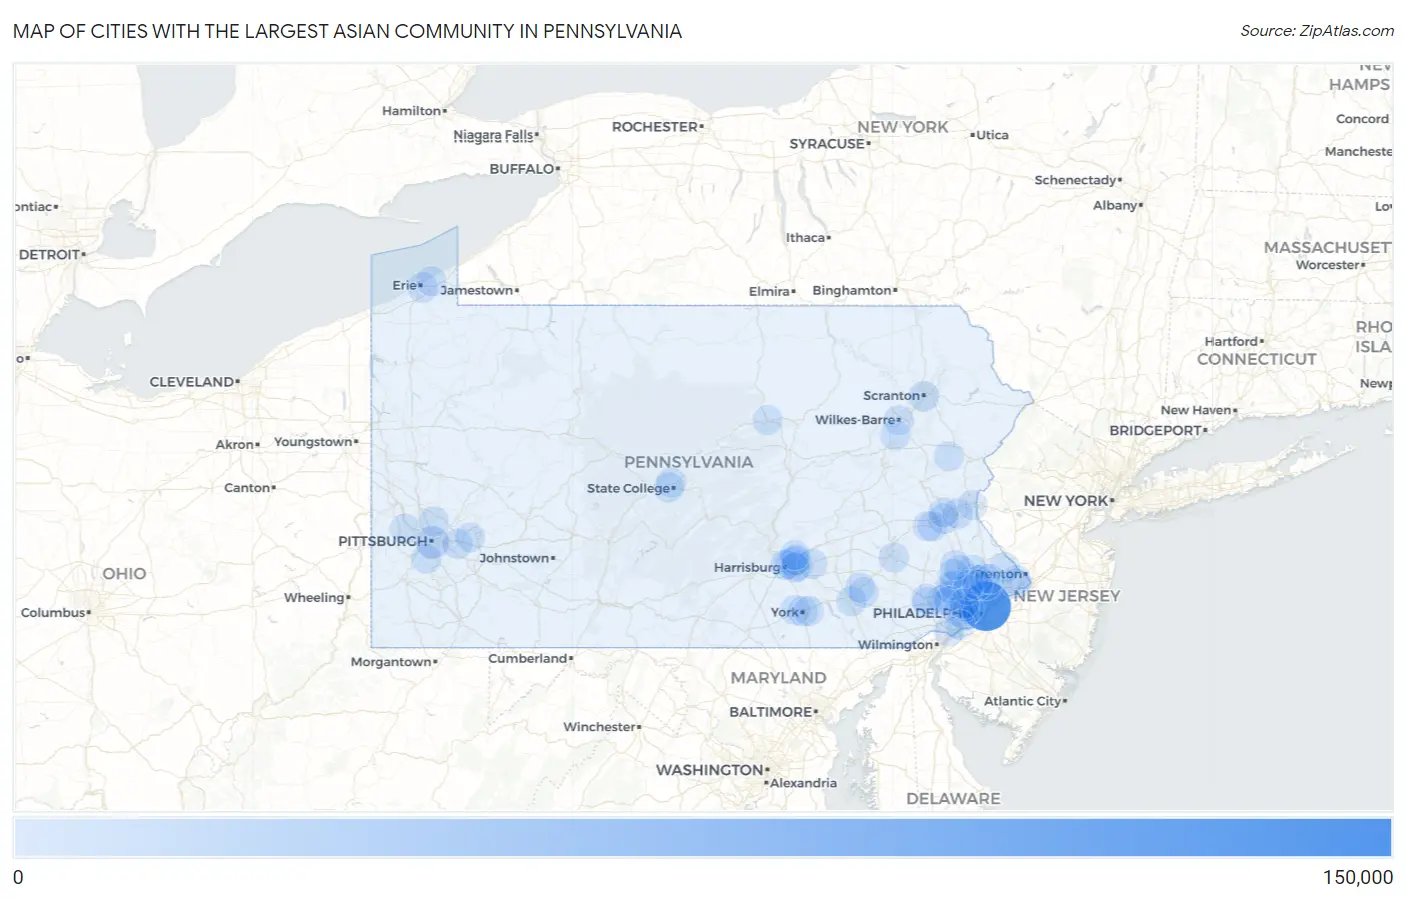
Map of Cities with the Largest Asian Community in Pennsylvania
0
150,000
Cities with the Largest Asian Community in Pennsylvania
| City | Asian | vs State | vs National | |
| 1. | Philadelphia | 121,051 | 473,192(25.58%)#1 | 19,112,979(0.63%)#12 |
| 2. | Pittsburgh | 17,037 | 473,192(3.60%)#2 | 19,112,979(0.09%)#160 |
| 3. | King Of Prussia | 5,731 | 473,192(1.21%)#3 | 19,112,979(0.03%)#512 |
| 4. | State College Borough | 4,125 | 473,192(0.87%)#4 | 19,112,979(0.02%)#678 |
| 5. | Scranton | 3,622 | 473,192(0.77%)#5 | 19,112,979(0.02%)#758 |
| 6. | Allentown | 3,528 | 473,192(0.75%)#6 | 19,112,979(0.02%)#778 |
| 7. | Lansdale Borough | 2,960 | 473,192(0.63%)#7 | 19,112,979(0.02%)#897 |
| 8. | Bethlehem | 2,481 | 473,192(0.52%)#8 | 19,112,979(0.01%)#1,034 |
| 9. | Montgomeryville | 2,369 | 473,192(0.50%)#9 | 19,112,979(0.01%)#1,073 |
| 10. | Erie | 2,329 | 473,192(0.49%)#10 | 19,112,979(0.01%)#1,086 |
| 11. | Franklin Park Borough | 2,205 | 473,192(0.47%)#11 | 19,112,979(0.01%)#1,134 |
| 12. | Whitehall Borough | 2,004 | 473,192(0.42%)#12 | 19,112,979(0.01%)#1,219 |
| 13. | Monroeville | 1,920 | 473,192(0.41%)#13 | 19,112,979(0.01%)#1,260 |
| 14. | Progress | 1,791 | 473,192(0.38%)#14 | 19,112,979(0.01%)#1,317 |
| 15. | Exton | 1,750 | 473,192(0.37%)#15 | 19,112,979(0.01%)#1,339 |
| 16. | Baldwin Borough | 1,745 | 473,192(0.37%)#16 | 19,112,979(0.01%)#1,341 |
| 17. | Chesterbrook | 1,727 | 473,192(0.36%)#17 | 19,112,979(0.01%)#1,349 |
| 18. | Audubon | 1,677 | 473,192(0.35%)#18 | 19,112,979(0.01%)#1,374 |
| 19. | Rutherford | 1,596 | 473,192(0.34%)#19 | 19,112,979(0.01%)#1,426 |
| 20. | Colonial Park | 1,587 | 473,192(0.34%)#20 | 19,112,979(0.01%)#1,430 |
| 21. | Lancaster | 1,547 | 473,192(0.33%)#21 | 19,112,979(0.01%)#1,455 |
| 22. | Drexel Hill | 1,507 | 473,192(0.32%)#22 | 19,112,979(0.01%)#1,478 |
| 23. | Horsham | 1,466 | 473,192(0.31%)#23 | 19,112,979(0.01%)#1,498 |
| 24. | Harrisburg | 1,377 | 473,192(0.29%)#24 | 19,112,979(0.01%)#1,565 |
| 25. | Breinigsville | 1,310 | 473,192(0.28%)#25 | 19,112,979(0.01%)#1,617 |
| 26. | Frazer | 1,270 | 473,192(0.27%)#26 | 19,112,979(0.01%)#1,645 |
| 27. | Reading | 1,199 | 473,192(0.25%)#27 | 19,112,979(0.01%)#1,711 |
| 28. | Paoli | 1,122 | 473,192(0.24%)#28 | 19,112,979(0.01%)#1,796 |
| 29. | Broomall | 1,036 | 473,192(0.22%)#29 | 19,112,979(0.01%)#1,889 |
| 30. | Levittown | 1,020 | 473,192(0.22%)#30 | 19,112,979(0.01%)#1,906 |
| 31. | Park Forest Village | 1,004 | 473,192(0.21%)#31 | 19,112,979(0.01%)#1,923 |
| 32. | Paxtonia | 970 | 473,192(0.20%)#32 | 19,112,979(0.01%)#1,963 |
| 33. | Spring House | 970 | 473,192(0.20%)#33 | 19,112,979(0.01%)#1,964 |
| 34. | Hershey | 959 | 473,192(0.20%)#34 | 19,112,979(0.01%)#1,970 |
| 35. | Kulpsville | 958 | 473,192(0.20%)#35 | 19,112,979(0.01%)#1,972 |
| 36. | Wilkes Barre | 943 | 473,192(0.20%)#36 | 19,112,979(0.00%)#1,989 |
| 37. | Norristown Borough | 931 | 473,192(0.20%)#37 | 19,112,979(0.00%)#2,013 |
| 38. | Hatfield Borough | 915 | 473,192(0.19%)#38 | 19,112,979(0.00%)#2,037 |
| 39. | Millbourne Borough | 832 | 473,192(0.18%)#39 | 19,112,979(0.00%)#2,160 |
| 40. | Carnot Moon | 817 | 473,192(0.17%)#40 | 19,112,979(0.00%)#2,178 |
| 41. | Murrysville | 809 | 473,192(0.17%)#41 | 19,112,979(0.00%)#2,186 |
| 42. | Phoenixville Borough | 798 | 473,192(0.17%)#42 | 19,112,979(0.00%)#2,204 |
| 43. | Lawnton | 782 | 473,192(0.17%)#43 | 19,112,979(0.00%)#2,226 |
| 44. | Villanova | 774 | 473,192(0.16%)#44 | 19,112,979(0.00%)#2,238 |
| 45. | Ardmore | 757 | 473,192(0.16%)#45 | 19,112,979(0.00%)#2,266 |
| 46. | Penn Wynne | 725 | 473,192(0.15%)#46 | 19,112,979(0.00%)#2,314 |
| 47. | Allison Park | 724 | 473,192(0.15%)#47 | 19,112,979(0.00%)#2,318 |
| 48. | Shiloh | 693 | 473,192(0.15%)#48 | 19,112,979(0.00%)#2,390 |
| 49. | Newtown Grant | 674 | 473,192(0.14%)#49 | 19,112,979(0.00%)#2,430 |
| 50. | Dunmore Borough | 663 | 473,192(0.14%)#50 | 19,112,979(0.00%)#2,449 |
| 51. | York | 653 | 473,192(0.14%)#51 | 19,112,979(0.00%)#2,469 |
| 52. | Willow Grove | 643 | 473,192(0.14%)#52 | 19,112,979(0.00%)#2,489 |
| 53. | Ancient Oaks | 633 | 473,192(0.13%)#53 | 19,112,979(0.00%)#2,510 |
| 54. | Maple Glen | 616 | 473,192(0.13%)#54 | 19,112,979(0.00%)#2,537 |
| 55. | Bala Cynwyd | 609 | 473,192(0.13%)#55 | 19,112,979(0.00%)#2,554 |
| 56. | Downingtown Borough | 592 | 473,192(0.13%)#56 | 19,112,979(0.00%)#2,605 |
| 57. | Trooper | 582 | 473,192(0.12%)#57 | 19,112,979(0.00%)#2,632 |
| 58. | Plymouth Meeting | 581 | 473,192(0.12%)#58 | 19,112,979(0.00%)#2,635 |
| 59. | Mountain Top | 566 | 473,192(0.12%)#59 | 19,112,979(0.00%)#2,668 |
| 60. | Fullerton | 552 | 473,192(0.12%)#60 | 19,112,979(0.00%)#2,701 |
| 61. | Bethel Park | 551 | 473,192(0.12%)#61 | 19,112,979(0.00%)#2,706 |
| 62. | Boothwyn | 530 | 473,192(0.11%)#62 | 19,112,979(0.00%)#2,765 |
| 63. | Blue Bell | 527 | 473,192(0.11%)#63 | 19,112,979(0.00%)#2,770 |
| 64. | Carlisle Borough | 524 | 473,192(0.11%)#64 | 19,112,979(0.00%)#2,778 |
| 65. | Lionville | 515 | 473,192(0.11%)#65 | 19,112,979(0.00%)#2,809 |
| 66. | Skippack | 507 | 473,192(0.11%)#66 | 19,112,979(0.00%)#2,832 |
| 67. | Castle Shannon Borough | 499 | 473,192(0.11%)#67 | 19,112,979(0.00%)#2,857 |
| 68. | Swarthmore Borough | 499 | 473,192(0.11%)#68 | 19,112,979(0.00%)#2,858 |
| 69. | Eagleville Cdp Montgomery County | 488 | 473,192(0.10%)#69 | 19,112,979(0.00%)#2,892 |
| 70. | Millersville Borough | 469 | 473,192(0.10%)#70 | 19,112,979(0.00%)#2,964 |
| 71. | Jefferson Hills Borough | 465 | 473,192(0.10%)#71 | 19,112,979(0.00%)#2,976 |
| 72. | Camp Hill Borough | 463 | 473,192(0.10%)#72 | 19,112,979(0.00%)#2,987 |
| 73. | Sierra View | 444 | 473,192(0.09%)#73 | 19,112,979(0.00%)#3,067 |
| 74. | Berwyn | 438 | 473,192(0.09%)#74 | 19,112,979(0.00%)#3,089 |
| 75. | Bryn Mawr | 435 | 473,192(0.09%)#75 | 19,112,979(0.00%)#3,100 |
| 76. | Pleasant Hills Borough | 430 | 473,192(0.09%)#76 | 19,112,979(0.00%)#3,115 |
| 77. | Malvern Borough | 427 | 473,192(0.09%)#77 | 19,112,979(0.00%)#3,123 |
| 78. | West Reading Borough | 420 | 473,192(0.09%)#78 | 19,112,979(0.00%)#3,150 |
| 79. | Leola | 418 | 473,192(0.09%)#79 | 19,112,979(0.00%)#3,158 |
| 80. | Fort Washington | 417 | 473,192(0.09%)#80 | 19,112,979(0.00%)#3,161 |
| 81. | Rosemont | 414 | 473,192(0.09%)#81 | 19,112,979(0.00%)#3,177 |
| 82. | Morgan Hill | 412 | 473,192(0.09%)#82 | 19,112,979(0.00%)#3,187 |
| 83. | Woodlyn | 407 | 473,192(0.09%)#83 | 19,112,979(0.00%)#3,204 |
| 84. | Linglestown | 402 | 473,192(0.08%)#84 | 19,112,979(0.00%)#3,232 |
| 85. | Aspinwall Borough | 402 | 473,192(0.08%)#85 | 19,112,979(0.00%)#3,233 |
| 86. | Fairless Hills | 398 | 473,192(0.08%)#86 | 19,112,979(0.00%)#3,247 |
| 87. | Easton | 394 | 473,192(0.08%)#87 | 19,112,979(0.00%)#3,267 |
| 88. | Williamsport | 394 | 473,192(0.08%)#88 | 19,112,979(0.00%)#3,268 |
| 89. | Warminster Heights | 390 | 473,192(0.08%)#89 | 19,112,979(0.00%)#3,286 |
| 90. | Harleysville | 379 | 473,192(0.08%)#90 | 19,112,979(0.00%)#3,347 |
| 91. | St. Davids | 377 | 473,192(0.08%)#91 | 19,112,979(0.00%)#3,358 |
| 92. | East York | 373 | 473,192(0.08%)#92 | 19,112,979(0.00%)#3,379 |
| 93. | Northwest Harborcreek | 371 | 473,192(0.08%)#93 | 19,112,979(0.00%)#3,388 |
| 94. | Fox Chapel Borough | 366 | 473,192(0.08%)#94 | 19,112,979(0.00%)#3,406 |
| 95. | Wayne | 365 | 473,192(0.08%)#95 | 19,112,979(0.00%)#3,411 |
| 96. | Toftrees | 365 | 473,192(0.08%)#96 | 19,112,979(0.00%)#3,415 |
| 97. | Brownstown | 363 | 473,192(0.08%)#97 | 19,112,979(0.00%)#3,427 |
| 98. | West Chester Borough | 354 | 473,192(0.07%)#98 | 19,112,979(0.00%)#3,460 |
| 99. | Merion Station | 350 | 473,192(0.07%)#99 | 19,112,979(0.00%)#3,489 |
| 100. | Sinking Spring Borough | 347 | 473,192(0.07%)#100 | 19,112,979(0.00%)#3,505 |
Common Questions
What are the Top 10 Cities with the Largest Asian Community in Pennsylvania?
Top 10 Cities with the Largest Asian Community in Pennsylvania are:
#1
121,051
#2
17,037
#3
5,731
#4
3,622
#5
3,528
#6
2,481
#7
2,369
#8
2,329
#9
1,920
#10
1,791
What city has the Largest Asian Community in Pennsylvania?
Philadelphia has the Largest Asian Community in Pennsylvania with 121,051.
What is the Total Asian Population in the State of Pennsylvania?
Total Asian Population in Pennsylvania is 473,192.
What is the Total Asian Population in the United States?
Total Asian Population in the United States is 19,112,979.