Graham, WA Map & Demographics
Graham Map
Graham Overview
$38,959
PER CAPITA INCOME
$111,527
AVG FAMILY INCOME
$110,024
AVG HOUSEHOLD INCOME
36.9%
WAGE / INCOME GAP [ % ]
63.1¢/ $1
WAGE / INCOME GAP [ $ ]
0.37
INEQUALITY / GINI INDEX
34,778
TOTAL POPULATION
18,377
MALE POPULATION
16,401
FEMALE POPULATION
112.05
MALES / 100 FEMALES
89.25
FEMALES / 100 MALES
35.2
MEDIAN AGE
3.5
AVG FAMILY SIZE
3.3
AVG HOUSEHOLD SIZE
17,336
LABOR FORCE [ PEOPLE ]
67.2%
PERCENT IN LABOR FORCE
5.8%
UNEMPLOYMENT RATE
Graham Zip Codes
Graham Area Codes
Income in Graham
Income Overview in Graham
Per Capita Income in Graham is $38,959, while median incomes of families and households are $111,527 and $110,024 respectively.
| Characteristic | Number | Measure |
| Per Capita Income | 34,778 | $38,959 |
| Median Family Income | 8,774 | $111,527 |
| Mean Family Income | 8,774 | $129,826 |
| Median Household Income | 10,631 | $110,024 |
| Mean Household Income | 10,631 | $125,228 |
| Income Deficit | 8,774 | $0 |
| Wage / Income Gap (%) | 34,778 | 36.85% |
| Wage / Income Gap ($) | 34,778 | 63.15¢ per $1 |
| Gini / Inequality Index | 34,778 | 0.37 |
Earnings by Sex in Graham
Average Earnings in Graham are $50,400, $62,000 for men and $39,151 for women, a difference of 36.8%.
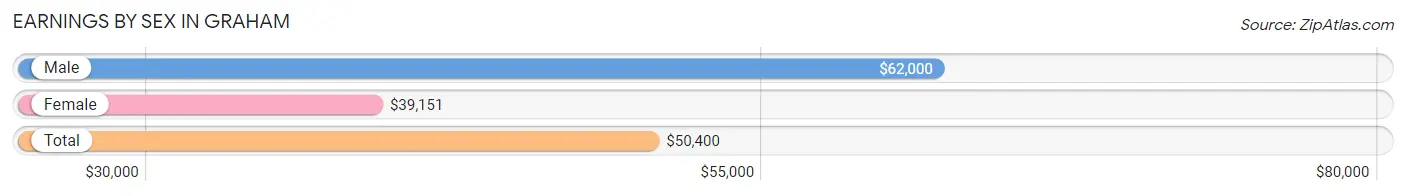
| Sex | Number | Average Earnings |
| Male | 10,084 (56.3%) | $62,000 |
| Female | 7,841 (43.7%) | $39,151 |
| Total | 17,925 (100.0%) | $50,400 |
Earnings by Sex by Income Bracket in Graham
The most common earnings brackets in Graham are $100,000+ for men (2,114 | 21.0%) and $75,000 to $99,999 for women (920 | 11.7%).
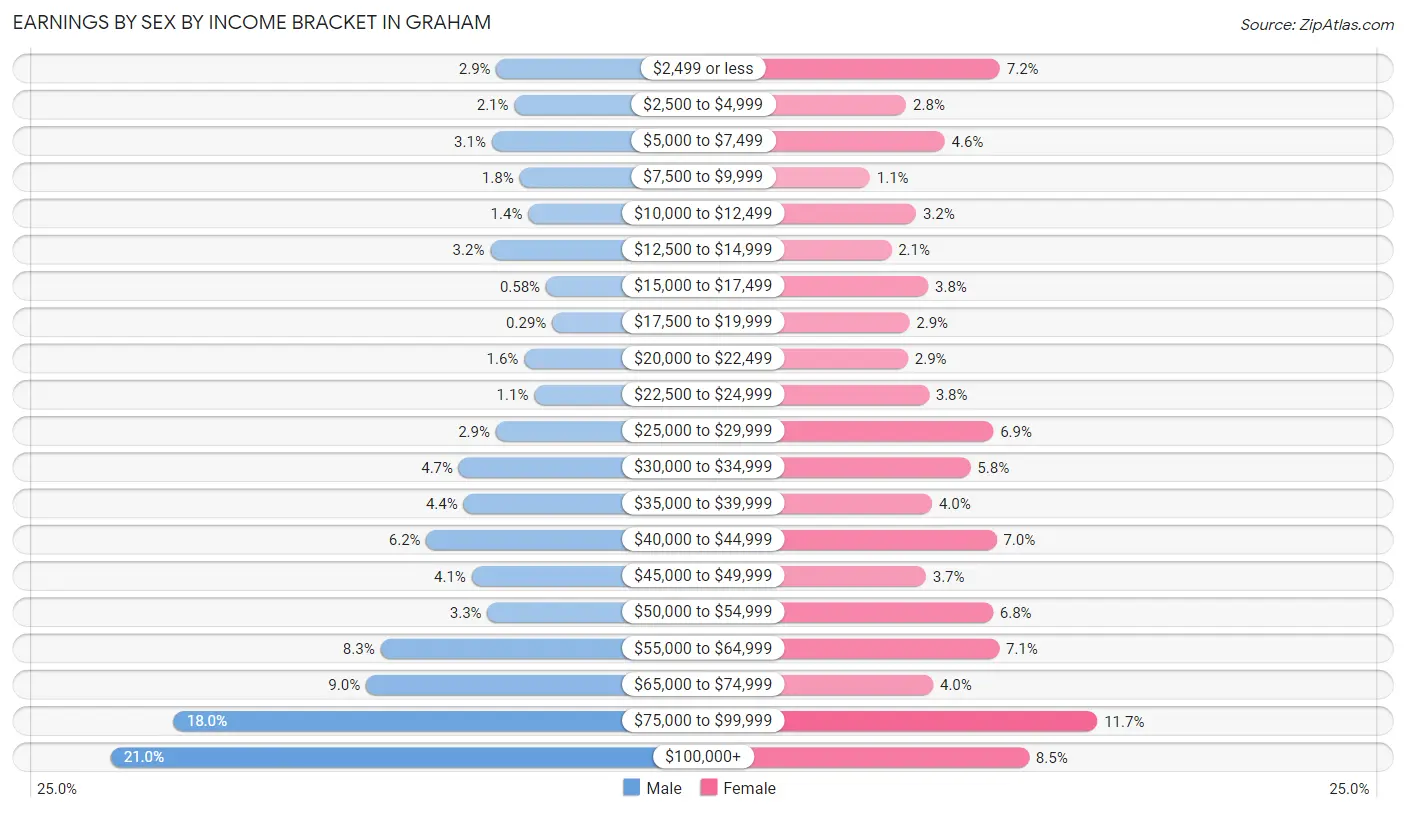
| Income | Male | Female |
| $2,499 or less | 292 (2.9%) | 562 (7.2%) |
| $2,500 to $4,999 | 208 (2.1%) | 218 (2.8%) |
| $5,000 to $7,499 | 315 (3.1%) | 359 (4.6%) |
| $7,500 to $9,999 | 184 (1.8%) | 85 (1.1%) |
| $10,000 to $12,499 | 142 (1.4%) | 254 (3.2%) |
| $12,500 to $14,999 | 322 (3.2%) | 163 (2.1%) |
| $15,000 to $17,499 | 58 (0.6%) | 299 (3.8%) |
| $17,500 to $19,999 | 29 (0.3%) | 230 (2.9%) |
| $20,000 to $22,499 | 161 (1.6%) | 224 (2.9%) |
| $22,500 to $24,999 | 114 (1.1%) | 301 (3.8%) |
| $25,000 to $29,999 | 295 (2.9%) | 538 (6.9%) |
| $30,000 to $34,999 | 470 (4.7%) | 454 (5.8%) |
| $35,000 to $39,999 | 448 (4.4%) | 313 (4.0%) |
| $40,000 to $44,999 | 623 (6.2%) | 550 (7.0%) |
| $45,000 to $49,999 | 409 (4.1%) | 290 (3.7%) |
| $50,000 to $54,999 | 335 (3.3%) | 536 (6.8%) |
| $55,000 to $64,999 | 840 (8.3%) | 559 (7.1%) |
| $65,000 to $74,999 | 909 (9.0%) | 317 (4.0%) |
| $75,000 to $99,999 | 1,816 (18.0%) | 920 (11.7%) |
| $100,000+ | 2,114 (21.0%) | 669 (8.5%) |
| Total | 10,084 (100.0%) | 7,841 (100.0%) |
Earnings by Sex by Educational Attainment in Graham
Average earnings in Graham are $72,970 for men and $43,740 for women, a difference of 40.1%. Men with an educational attainment of bachelor's degree enjoy the highest average annual earnings of $107,768, while those with less than high school education earn the least with $44,743. Women with an educational attainment of graduate degree earn the most with the average annual earnings of $76,691, while those with less than high school education have the smallest earnings of $30,682.
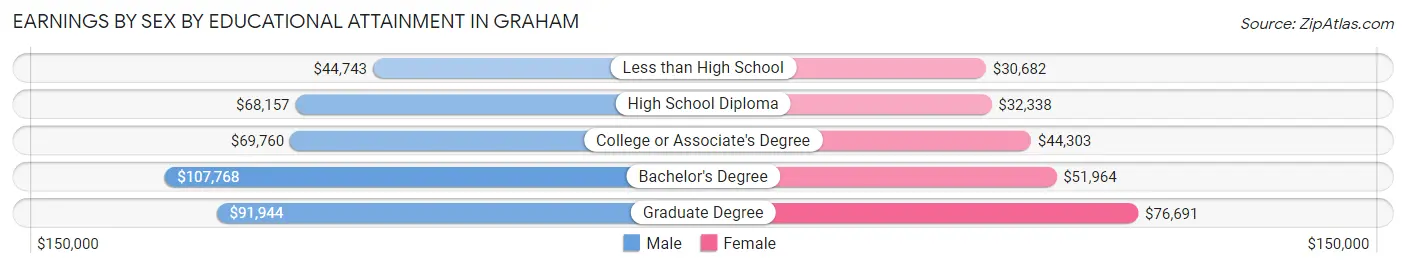
| Educational Attainment | Male Income | Female Income |
| Less than High School | $44,743 | $30,682 |
| High School Diploma | $68,157 | $32,338 |
| College or Associate's Degree | $69,760 | $44,303 |
| Bachelor's Degree | $107,768 | $51,964 |
| Graduate Degree | $91,944 | $76,691 |
| Total | $72,970 | $43,740 |
Family Income in Graham
Family Income Brackets in Graham
According to the Graham family income data, there are 2,413 families falling into the $100,000 to $149,999 income range, which is the most common income bracket and makes up 27.5% of all families.
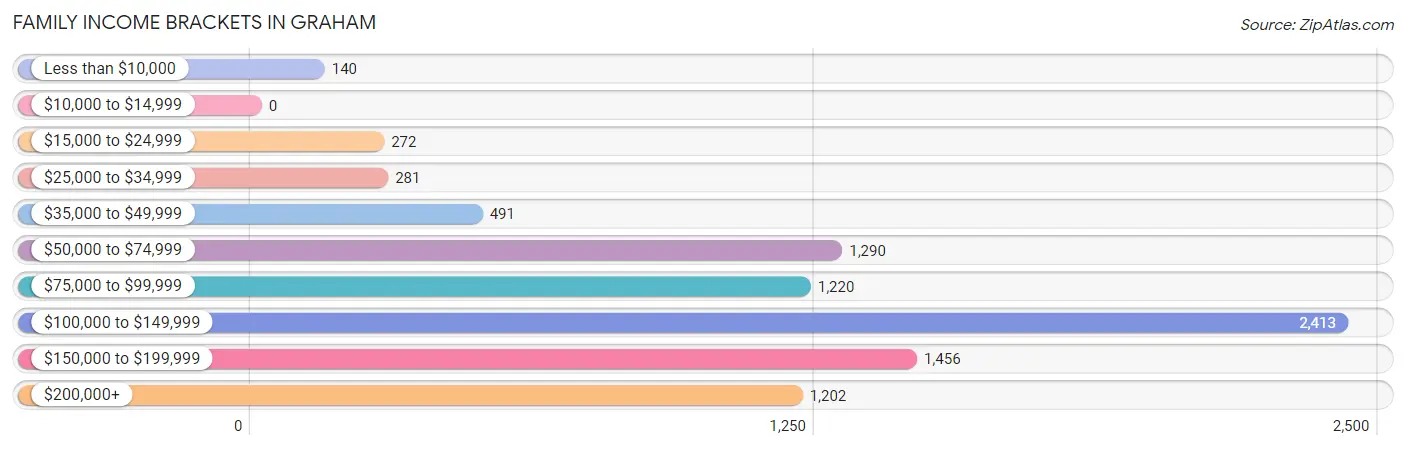
| Income Bracket | # Families | % Families |
| Less than $10,000 | 140 | 1.6% |
| $10,000 to $14,999 | 0 | 0.0% |
| $15,000 to $24,999 | 272 | 3.1% |
| $25,000 to $34,999 | 281 | 3.2% |
| $35,000 to $49,999 | 491 | 5.6% |
| $50,000 to $74,999 | 1,290 | 14.7% |
| $75,000 to $99,999 | 1,220 | 13.9% |
| $100,000 to $149,999 | 2,413 | 27.5% |
| $150,000 to $199,999 | 1,456 | 16.6% |
| $200,000+ | 1,202 | 13.7% |
Family Income by Famaliy Size in Graham
7+ person families (214 | 2.4%) account for the highest median family income in Graham with $178,750 per family, while 2-person families (3,066 | 34.9%) have the highest median income of $43,693 per family member.
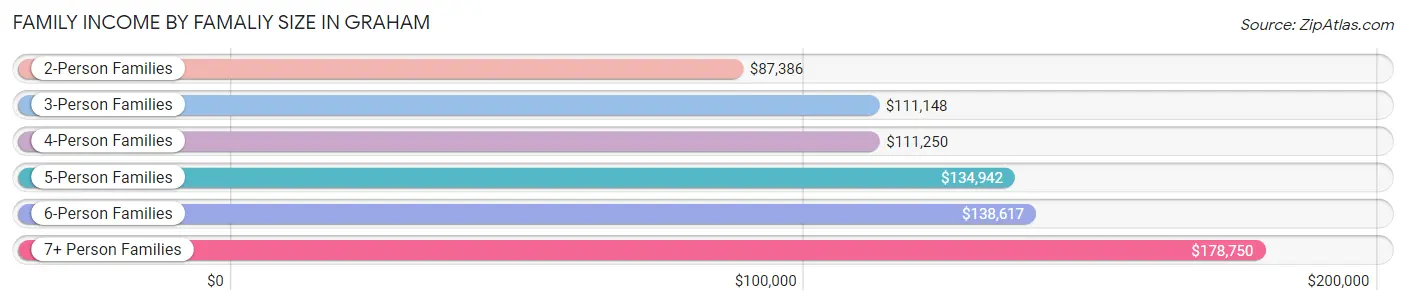
| Income Bracket | # Families | Median Income |
| 2-Person Families | 3,066 (34.9%) | $87,386 |
| 3-Person Families | 2,022 (23.1%) | $111,148 |
| 4-Person Families | 1,815 (20.7%) | $111,250 |
| 5-Person Families | 1,186 (13.5%) | $134,942 |
| 6-Person Families | 471 (5.4%) | $138,617 |
| 7+ Person Families | 214 (2.4%) | $178,750 |
| Total | 8,774 (100.0%) | $111,527 |
Family Income by Number of Earners in Graham
The median family income in Graham is $111,527, with families comprising 3+ earners (1,478) having the highest median family income of $161,500, while families with no earners (1,099) have the lowest median family income of $52,064, accounting for 16.9% and 12.5% of families, respectively.
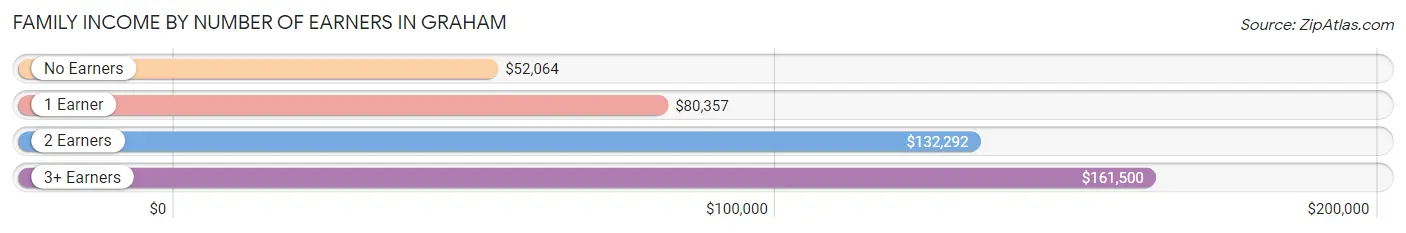
| Number of Earners | # Families | Median Income |
| No Earners | 1,099 (12.5%) | $52,064 |
| 1 Earner | 2,428 (27.7%) | $80,357 |
| 2 Earners | 3,769 (43.0%) | $132,292 |
| 3+ Earners | 1,478 (16.9%) | $161,500 |
| Total | 8,774 (100.0%) | $111,527 |
Household Income in Graham
Household Income Brackets in Graham
With 2,647 households falling in the category, the $100,000 to $149,999 income range is the most frequent in Graham, accounting for 24.9% of all households. In contrast, only 43 households (0.4%) fall into the $10,000 to $14,999 income bracket, making it the least populous group.
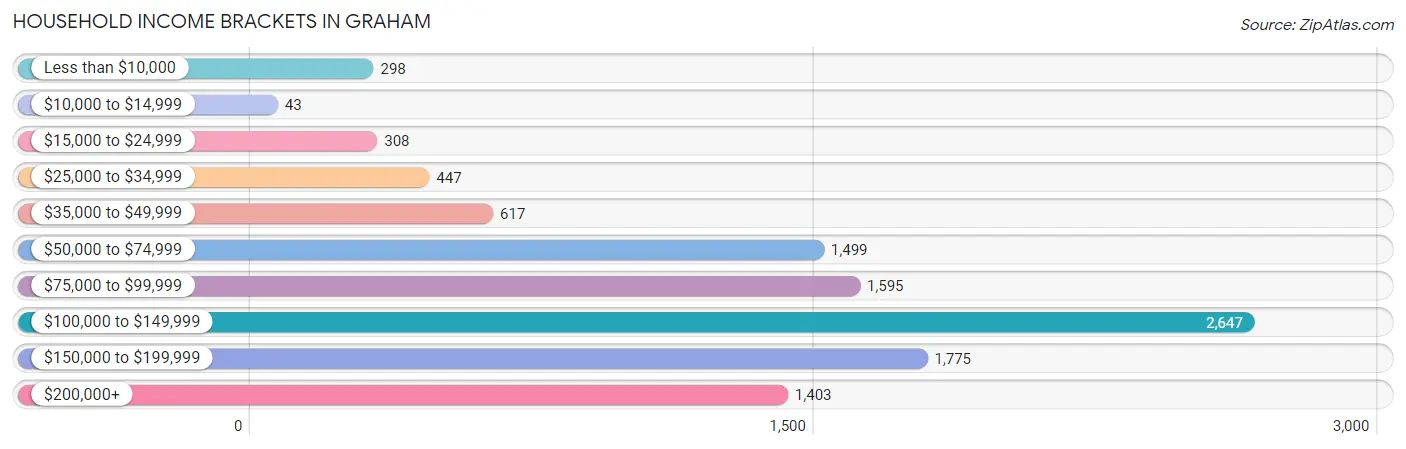
| Income Bracket | # Households | % Households |
| Less than $10,000 | 298 | 2.8% |
| $10,000 to $14,999 | 43 | 0.4% |
| $15,000 to $24,999 | 308 | 2.9% |
| $25,000 to $34,999 | 447 | 4.2% |
| $35,000 to $49,999 | 617 | 5.8% |
| $50,000 to $74,999 | 1,499 | 14.1% |
| $75,000 to $99,999 | 1,595 | 15.0% |
| $100,000 to $149,999 | 2,647 | 24.9% |
| $150,000 to $199,999 | 1,775 | 16.7% |
| $200,000+ | 1,403 | 13.2% |
Household Income by Householder Age in Graham
The median household income in Graham is $110,024, with the highest median household income of $122,852 found in the 45 to 64 years age bracket for the primary householder. A total of 4,474 households (42.1%) fall into this category. Meanwhile, the 15 to 24 years age bracket for the primary householder has the lowest median household income of $0, with 89 households (0.8%) in this group.
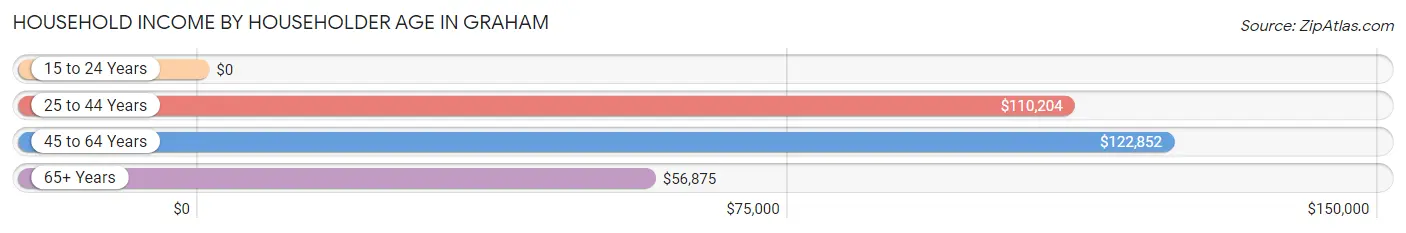
| Income Bracket | # Households | Median Income |
| 15 to 24 Years | 89 (0.8%) | $0 |
| 25 to 44 Years | 4,005 (37.7%) | $110,204 |
| 45 to 64 Years | 4,474 (42.1%) | $122,852 |
| 65+ Years | 2,063 (19.4%) | $56,875 |
| Total | 10,631 (100.0%) | $110,024 |
Poverty in Graham
Income Below Poverty by Sex and Age in Graham
With 4.2% poverty level for males and 7.7% for females among the residents of Graham, 5 year old males and 75 year old and over females are the most vulnerable to poverty, with 23 males (16.4%) and 217 females (25.1%) in their respective age groups living below the poverty level.
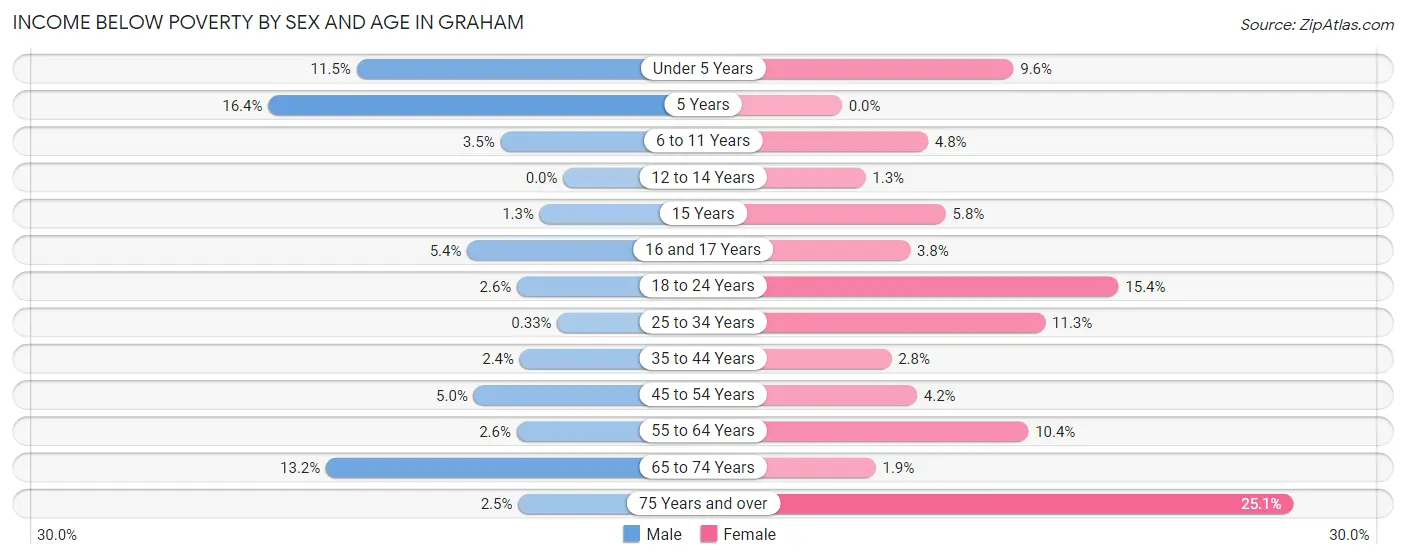
| Age Bracket | Male | Female |
| Under 5 Years | 156 (11.5%) | 87 (9.6%) |
| 5 Years | 23 (16.4%) | 0 (0.0%) |
| 6 to 11 Years | 53 (3.5%) | 90 (4.8%) |
| 12 to 14 Years | 0 (0.0%) | 12 (1.3%) |
| 15 Years | 5 (1.3%) | 13 (5.8%) |
| 16 and 17 Years | 43 (5.3%) | 14 (3.8%) |
| 18 to 24 Years | 46 (2.6%) | 184 (15.4%) |
| 25 to 34 Years | 7 (0.3%) | 225 (11.3%) |
| 35 to 44 Years | 59 (2.4%) | 69 (2.8%) |
| 45 to 54 Years | 124 (5.0%) | 85 (4.2%) |
| 55 to 64 Years | 53 (2.6%) | 224 (10.4%) |
| 65 to 74 Years | 171 (13.2%) | 19 (1.9%) |
| 75 Years and over | 16 (2.5%) | 217 (25.1%) |
| Total | 756 (4.2%) | 1,239 (7.7%) |
Income Above Poverty by Sex and Age in Graham
According to the poverty statistics in Graham, males aged 12 to 14 years and females aged 5 years are the age groups that are most secure financially, with 100.0% of males and 100.0% of females in these age groups living above the poverty line.
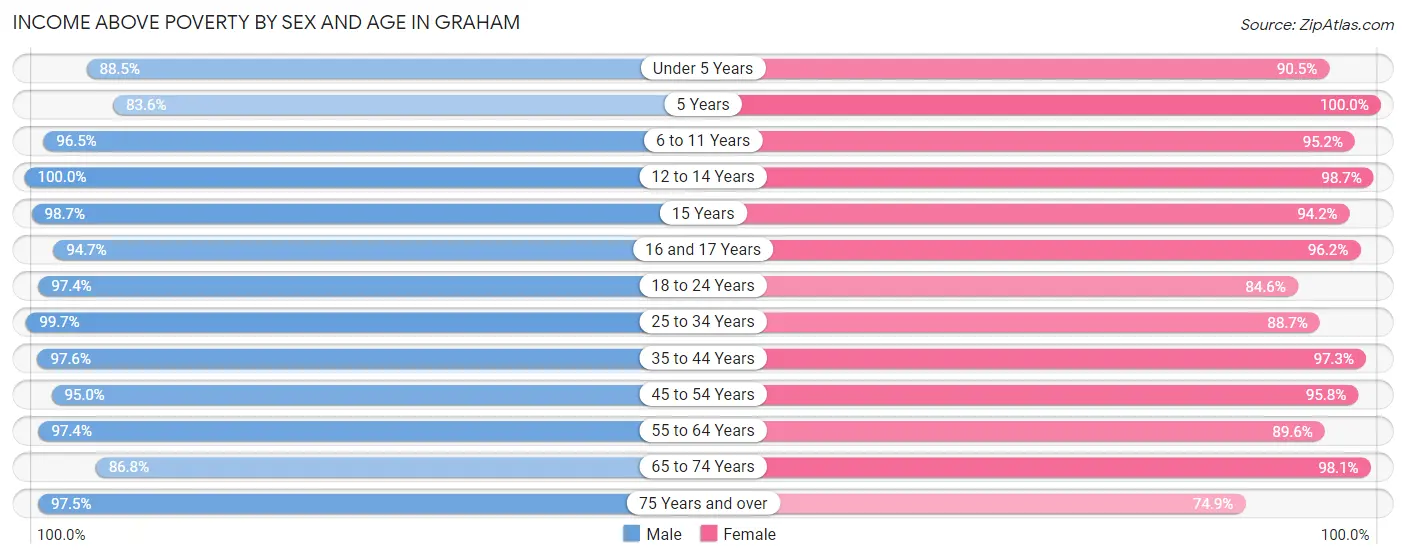
| Age Bracket | Male | Female |
| Under 5 Years | 1,199 (88.5%) | 824 (90.4%) |
| 5 Years | 117 (83.6%) | 116 (100.0%) |
| 6 to 11 Years | 1,463 (96.5%) | 1,790 (95.2%) |
| 12 to 14 Years | 1,091 (100.0%) | 903 (98.7%) |
| 15 Years | 378 (98.7%) | 212 (94.2%) |
| 16 and 17 Years | 760 (94.7%) | 354 (96.2%) |
| 18 to 24 Years | 1,747 (97.4%) | 1,011 (84.6%) |
| 25 to 34 Years | 2,128 (99.7%) | 1,762 (88.7%) |
| 35 to 44 Years | 2,376 (97.6%) | 2,441 (97.3%) |
| 45 to 54 Years | 2,361 (95.0%) | 1,950 (95.8%) |
| 55 to 64 Years | 1,996 (97.4%) | 1,935 (89.6%) |
| 65 to 74 Years | 1,123 (86.8%) | 989 (98.1%) |
| 75 Years and over | 622 (97.5%) | 646 (74.9%) |
| Total | 17,361 (95.8%) | 14,933 (92.3%) |
Income Below Poverty Among Married-Couple Families in Graham
The poverty statistics for married-couple families in Graham show that 3.2% or 217 of the total 6,759 families live below the poverty line. Families with no children have the highest poverty rate of 5.4%, comprising of 189 families. On the other hand, families with 5 or more children have the lowest poverty rate of 0.0%, which includes 0 families.
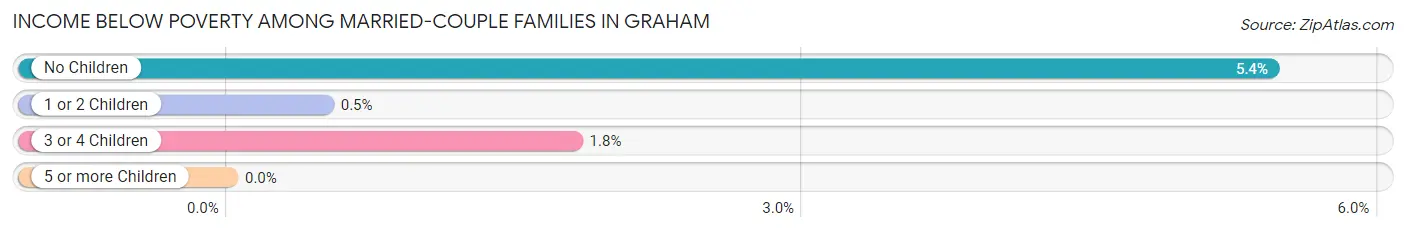
| Children | Above Poverty | Below Poverty |
| No Children | 3,286 (94.6%) | 189 (5.4%) |
| 1 or 2 Children | 2,204 (99.5%) | 11 (0.5%) |
| 3 or 4 Children | 929 (98.2%) | 17 (1.8%) |
| 5 or more Children | 123 (100.0%) | 0 (0.0%) |
| Total | 6,542 (96.8%) | 217 (3.2%) |
Income Below Poverty Among Single-Parent Households in Graham
According to the poverty data in Graham, 2.4% or 23 single-father households and 14.5% or 152 single-mother households are living below the poverty line. Among single-father households, those with 3 or 4 children have the highest poverty rate, with 23 households (12.9%) experiencing poverty. Likewise, among single-mother households, those with 5 or more children have the highest poverty rate, with 12 households (100.0%) falling below the poverty line.
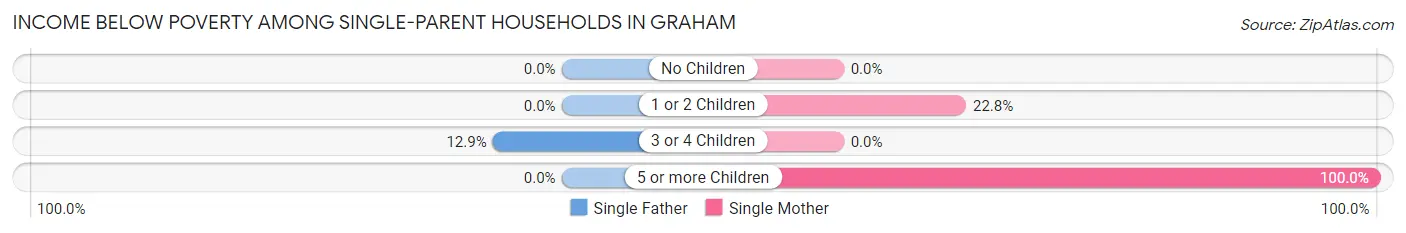
| Children | Single Father | Single Mother |
| No Children | 0 (0.0%) | 0 (0.0%) |
| 1 or 2 Children | 0 (0.0%) | 140 (22.8%) |
| 3 or 4 Children | 23 (12.9%) | 0 (0.0%) |
| 5 or more Children | 0 (0.0%) | 12 (100.0%) |
| Total | 23 (2.4%) | 152 (14.5%) |
Income Below Poverty Among Married-Couple vs Single-Parent Households in Graham
The poverty data for Graham shows that 217 of the married-couple family households (3.2%) and 175 of the single-parent households (8.7%) are living below the poverty level. Within the married-couple family households, those with no children have the highest poverty rate, with 189 households (5.4%) falling below the poverty line. Among the single-parent households, those with 5 or more children have the highest poverty rate, with 12 household (38.7%) living below poverty.
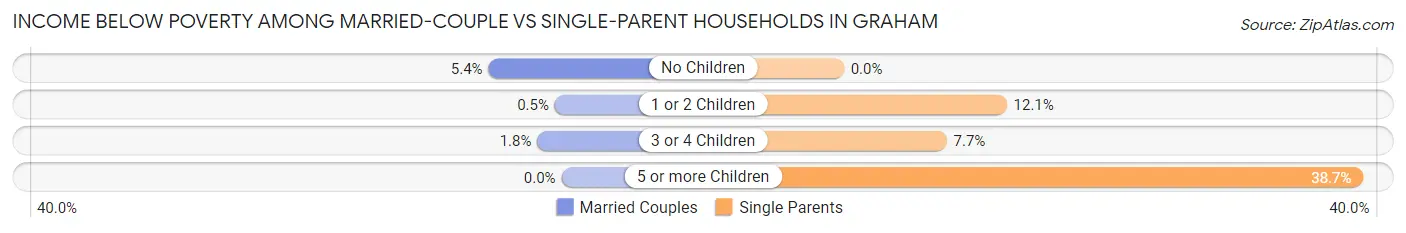
| Children | Married-Couple Families | Single-Parent Households |
| No Children | 189 (5.4%) | 0 (0.0%) |
| 1 or 2 Children | 11 (0.5%) | 140 (12.1%) |
| 3 or 4 Children | 17 (1.8%) | 23 (7.7%) |
| 5 or more Children | 0 (0.0%) | 12 (38.7%) |
| Total | 217 (3.2%) | 175 (8.7%) |
Race in Graham
The most populous races in Graham are White / Caucasian (24,770 | 71.2%), Two or more Races (4,896 | 14.1%), and Hispanic or Latino (4,286 | 12.3%).
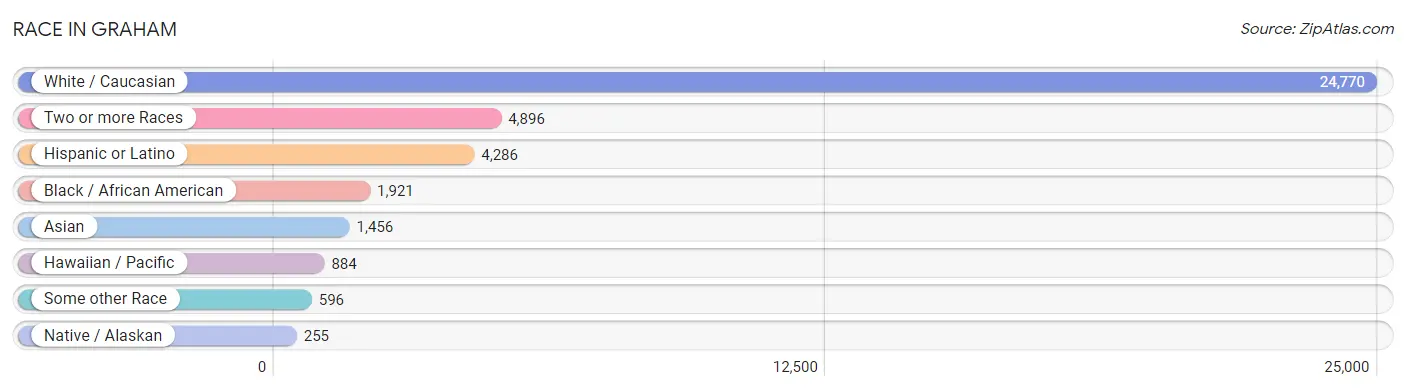
| Race | # Population | % Population |
| Asian | 1,456 | 4.2% |
| Black / African American | 1,921 | 5.5% |
| Hawaiian / Pacific | 884 | 2.5% |
| Hispanic or Latino | 4,286 | 12.3% |
| Native / Alaskan | 255 | 0.7% |
| White / Caucasian | 24,770 | 71.2% |
| Two or more Races | 4,896 | 14.1% |
| Some other Race | 596 | 1.7% |
| Total | 34,778 | 100.0% |
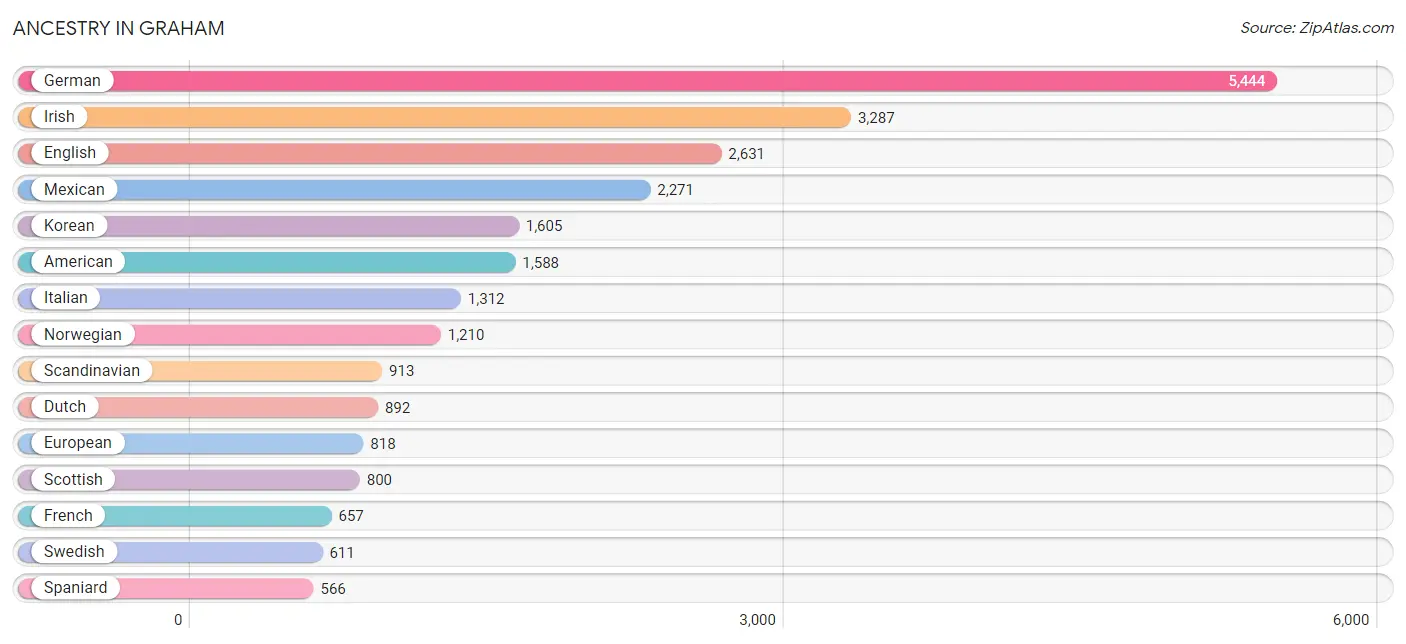
Ancestry in Graham
The most populous ancestries reported in Graham are German (5,444 | 15.7%), Irish (3,287 | 9.5%), English (2,631 | 7.6%), Mexican (2,271 | 6.5%), and Korean (1,605 | 4.6%), together accounting for 43.8% of all Graham residents.
| Ancestry | # Population | % Population |
| African | 80 | 0.2% |
| Alaska Native | 2 | 0.0% |
| Aleut | 8 | 0.0% |
| American | 1,588 | 4.6% |
| Arab | 24 | 0.1% |
| Australian | 27 | 0.1% |
| Austrian | 72 | 0.2% |
| Basque | 10 | 0.0% |
| Belgian | 17 | 0.1% |
| Bhutanese | 99 | 0.3% |
| Blackfeet | 154 | 0.4% |
| British | 257 | 0.7% |
| Burmese | 237 | 0.7% |
| Canadian | 46 | 0.1% |
| Celtic | 41 | 0.1% |
| Central American | 185 | 0.5% |
| Central American Indian | 18 | 0.1% |
| Cherokee | 159 | 0.5% |
| Chickasaw | 25 | 0.1% |
| Chinese | 24 | 0.1% |
| Chippewa | 155 | 0.4% |
| Choctaw | 185 | 0.5% |
| Colville | 4 | 0.0% |
| Croatian | 46 | 0.1% |
| Cuban | 20 | 0.1% |
| Czech | 43 | 0.1% |
| Czechoslovakian | 29 | 0.1% |
| Danish | 186 | 0.5% |
| Delaware | 6 | 0.0% |
| Dominican | 204 | 0.6% |
| Dutch | 892 | 2.6% |
| Eastern European | 148 | 0.4% |
| English | 2,631 | 7.6% |
| Ethiopian | 9 | 0.0% |
| European | 818 | 2.4% |
| Filipino | 11 | 0.0% |
| Finnish | 16 | 0.1% |
| French | 657 | 1.9% |
| French Canadian | 190 | 0.5% |
| German | 5,444 | 15.7% |
| Greek | 7 | 0.0% |
| Guamanian / Chamorro | 167 | 0.5% |
| Hmong | 9 | 0.0% |
| Hungarian | 17 | 0.1% |
| Icelander | 51 | 0.2% |
| Indian (Asian) | 280 | 0.8% |
| Inupiat | 10 | 0.0% |
| Iranian | 69 | 0.2% |
| Irish | 3,287 | 9.5% |
| Italian | 1,312 | 3.8% |
| Japanese | 86 | 0.3% |
| Kenyan | 112 | 0.3% |
| Korean | 1,605 | 4.6% |
| Lebanese | 24 | 0.1% |
| Lithuanian | 9 | 0.0% |
| Malaysian | 35 | 0.1% |
| Mexican | 2,271 | 6.5% |
| Mexican American Indian | 47 | 0.1% |
| Native Hawaiian | 410 | 1.2% |
| Navajo | 47 | 0.1% |
| Northern European | 61 | 0.2% |
| Norwegian | 1,210 | 3.5% |
| Pakistani | 50 | 0.1% |
| Panamanian | 167 | 0.5% |
| Peruvian | 184 | 0.5% |
| Polish | 257 | 0.7% |
| Portuguese | 81 | 0.2% |
| Puerto Rican | 426 | 1.2% |
| Puget Sound Salish | 54 | 0.2% |
| Romanian | 31 | 0.1% |
| Russian | 442 | 1.3% |
| Salvadoran | 18 | 0.1% |
| Samoan | 459 | 1.3% |
| Scandinavian | 913 | 2.6% |
| Scotch-Irish | 484 | 1.4% |
| Scottish | 800 | 2.3% |
| Sioux | 65 | 0.2% |
| Slovene | 8 | 0.0% |
| South American | 206 | 0.6% |
| Spaniard | 566 | 1.6% |
| Spanish | 227 | 0.6% |
| Sri Lankan | 246 | 0.7% |
| Subsaharan African | 201 | 0.6% |
| Swedish | 611 | 1.8% |
| Swiss | 102 | 0.3% |
| Thai | 36 | 0.1% |
| Tlingit-Haida | 30 | 0.1% |
| Ukrainian | 213 | 0.6% |
| Ute | 37 | 0.1% |
| Venezuelan | 22 | 0.1% |
| Welsh | 275 | 0.8% |
| West Indian | 78 | 0.2% |
| Yugoslavian | 73 | 0.2% | View All 93 Rows |
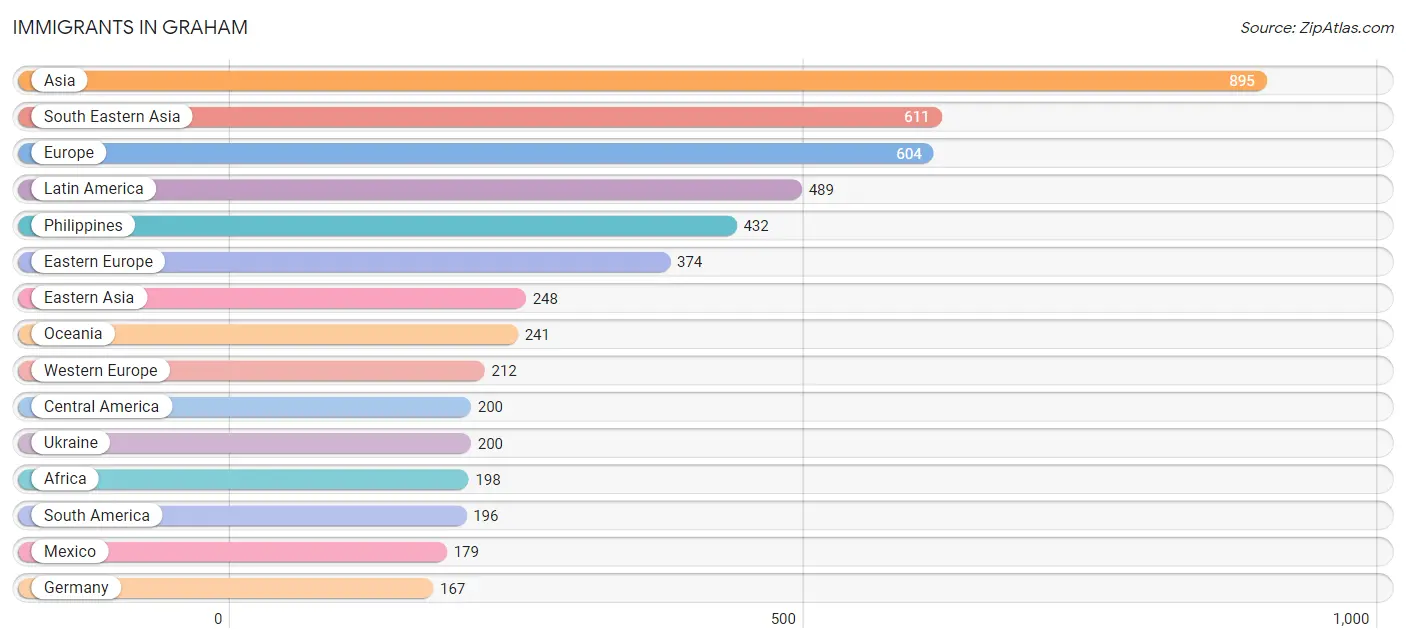
Immigrants in Graham
The most numerous immigrant groups reported in Graham came from Asia (895 | 2.6%), South Eastern Asia (611 | 1.8%), Europe (604 | 1.7%), Latin America (489 | 1.4%), and Philippines (432 | 1.2%), together accounting for 8.7% of all Graham residents.
| Immigration Origin | # Population | % Population |
| Africa | 198 | 0.6% |
| Asia | 895 | 2.6% |
| Australia | 27 | 0.1% |
| Austria | 32 | 0.1% |
| Bosnia and Herzegovina | 10 | 0.0% |
| Brazil | 35 | 0.1% |
| Cambodia | 16 | 0.1% |
| Canada | 37 | 0.1% |
| Caribbean | 93 | 0.3% |
| Central America | 200 | 0.6% |
| China | 67 | 0.2% |
| Czechoslovakia | 17 | 0.1% |
| Dominican Republic | 93 | 0.3% |
| Eastern Africa | 164 | 0.5% |
| Eastern Asia | 248 | 0.7% |
| Eastern Europe | 374 | 1.1% |
| El Salvador | 9 | 0.0% |
| England | 18 | 0.1% |
| Ethiopia | 9 | 0.0% |
| Europe | 604 | 1.7% |
| Germany | 167 | 0.5% |
| Guyana | 5 | 0.0% |
| Indonesia | 6 | 0.0% |
| Iran | 29 | 0.1% |
| Japan | 42 | 0.1% |
| Kenya | 145 | 0.4% |
| Korea | 139 | 0.4% |
| Laos | 17 | 0.1% |
| Latin America | 489 | 1.4% |
| Mexico | 179 | 0.5% |
| Micronesia | 130 | 0.4% |
| Moldova | 16 | 0.1% |
| Nepal | 7 | 0.0% |
| Netherlands | 13 | 0.0% |
| Northern Europe | 18 | 0.1% |
| Oceania | 241 | 0.7% |
| Panama | 12 | 0.0% |
| Peru | 134 | 0.4% |
| Philippines | 432 | 1.2% |
| Romania | 1 | 0.0% |
| Russia | 119 | 0.3% |
| South Africa | 20 | 0.1% |
| South America | 196 | 0.6% |
| South Central Asia | 36 | 0.1% |
| South Eastern Asia | 611 | 1.8% |
| Taiwan | 11 | 0.0% |
| Thailand | 11 | 0.0% |
| Ukraine | 200 | 0.6% |
| Venezuela | 22 | 0.1% |
| Vietnam | 129 | 0.4% |
| Western Africa | 14 | 0.0% |
| Western Europe | 212 | 0.6% | View All 52 Rows |
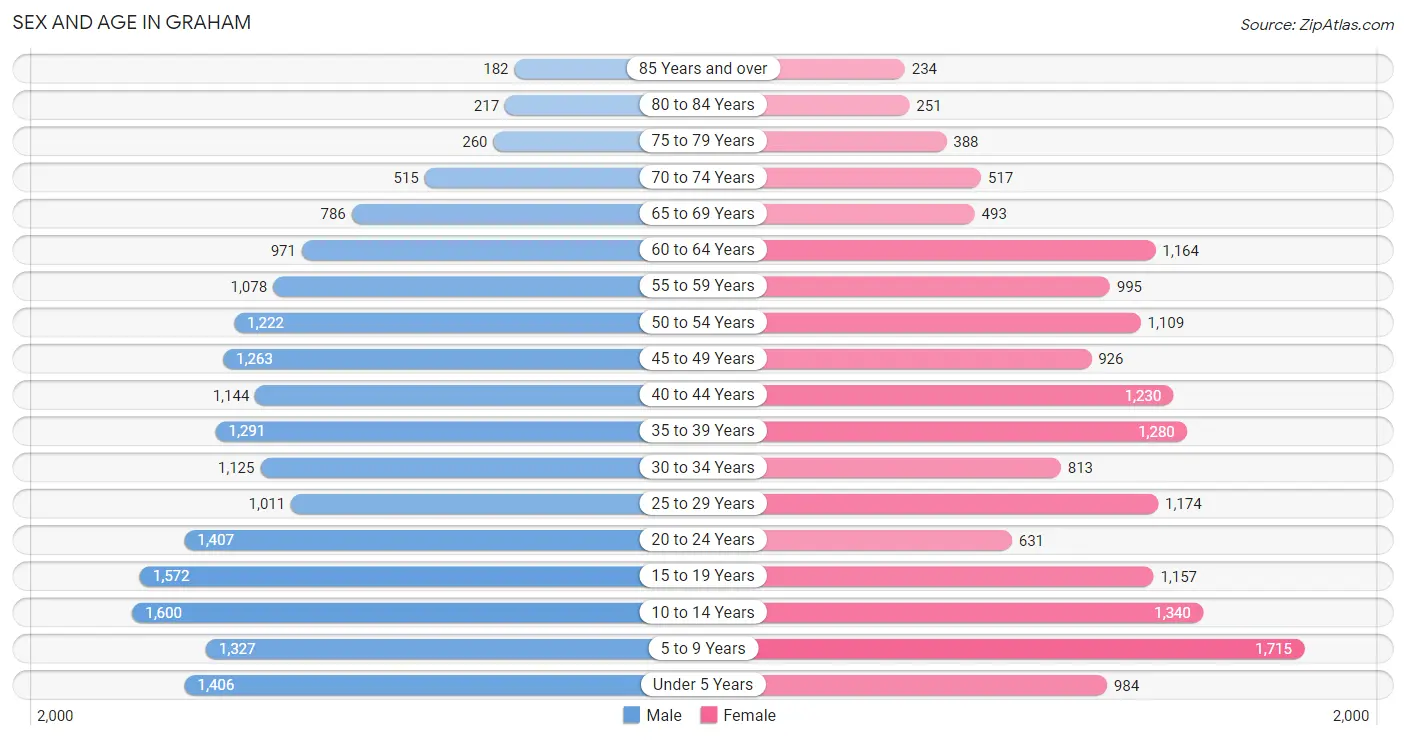
Sex and Age in Graham
Sex and Age in Graham
The most populous age groups in Graham are 10 to 14 Years (1,600 | 8.7%) for men and 5 to 9 Years (1,715 | 10.5%) for women.
| Age Bracket | Male | Female |
| Under 5 Years | 1,406 (7.6%) | 984 (6.0%) |
| 5 to 9 Years | 1,327 (7.2%) | 1,715 (10.5%) |
| 10 to 14 Years | 1,600 (8.7%) | 1,340 (8.2%) |
| 15 to 19 Years | 1,572 (8.6%) | 1,157 (7.0%) |
| 20 to 24 Years | 1,407 (7.7%) | 631 (3.8%) |
| 25 to 29 Years | 1,011 (5.5%) | 1,174 (7.2%) |
| 30 to 34 Years | 1,125 (6.1%) | 813 (5.0%) |
| 35 to 39 Years | 1,291 (7.0%) | 1,280 (7.8%) |
| 40 to 44 Years | 1,144 (6.2%) | 1,230 (7.5%) |
| 45 to 49 Years | 1,263 (6.9%) | 926 (5.7%) |
| 50 to 54 Years | 1,222 (6.7%) | 1,109 (6.8%) |
| 55 to 59 Years | 1,078 (5.9%) | 995 (6.1%) |
| 60 to 64 Years | 971 (5.3%) | 1,164 (7.1%) |
| 65 to 69 Years | 786 (4.3%) | 493 (3.0%) |
| 70 to 74 Years | 515 (2.8%) | 517 (3.2%) |
| 75 to 79 Years | 260 (1.4%) | 388 (2.4%) |
| 80 to 84 Years | 217 (1.2%) | 251 (1.5%) |
| 85 Years and over | 182 (1.0%) | 234 (1.4%) |
| Total | 18,377 (100.0%) | 16,401 (100.0%) |
Families and Households in Graham
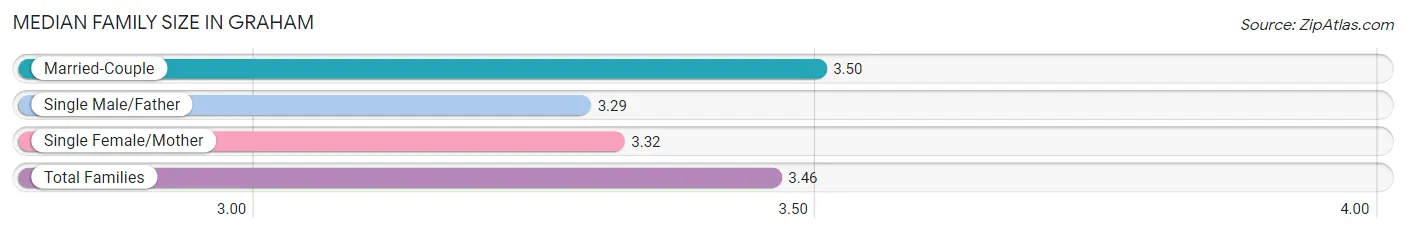
Median Family Size in Graham
The median family size in Graham is 3.46 persons per family, with married-couple families (6,759 | 77.0%) accounting for the largest median family size of 3.5 persons per family. On the other hand, single male/father families (967 | 11.0%) represent the smallest median family size with 3.29 persons per family.
| Family Type | # Families | Family Size |
| Married-Couple | 6,759 (77.0%) | 3.50 |
| Single Male/Father | 967 (11.0%) | 3.29 |
| Single Female/Mother | 1,048 (11.9%) | 3.32 |
| Total Families | 8,774 (100.0%) | 3.46 |
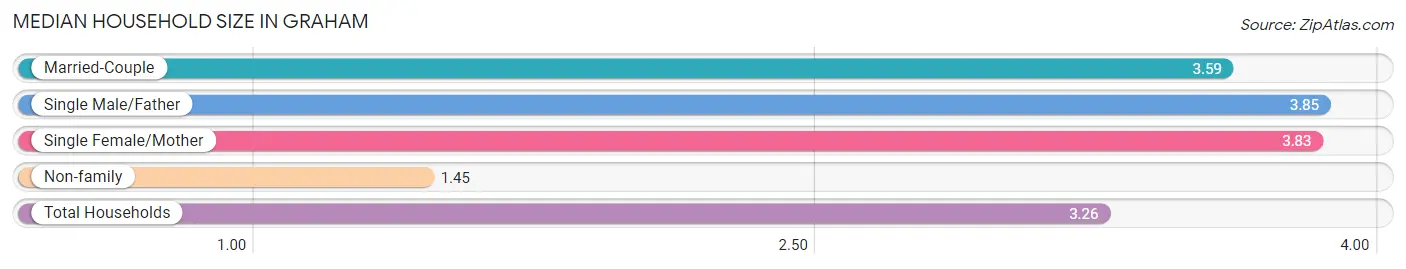
Median Household Size in Graham
The median household size in Graham is 3.26 persons per household, with single male/father households (967 | 9.1%) accounting for the largest median household size of 3.85 persons per household. non-family households (1,857 | 17.5%) represent the smallest median household size with 1.45 persons per household.
| Household Type | # Households | Household Size |
| Married-Couple | 6,759 (63.6%) | 3.59 |
| Single Male/Father | 967 (9.1%) | 3.85 |
| Single Female/Mother | 1,048 (9.9%) | 3.83 |
| Non-family | 1,857 (17.5%) | 1.45 |
| Total Households | 10,631 (100.0%) | 3.26 |
Household Size by Marriage Status in Graham
Out of a total of 10,631 households in Graham, 8,774 (82.5%) are family households, while 1,857 (17.5%) are nonfamily households. The most numerous type of family households are 2-person households, comprising 2,685, and the most common type of nonfamily households are 1-person households, comprising 1,246.
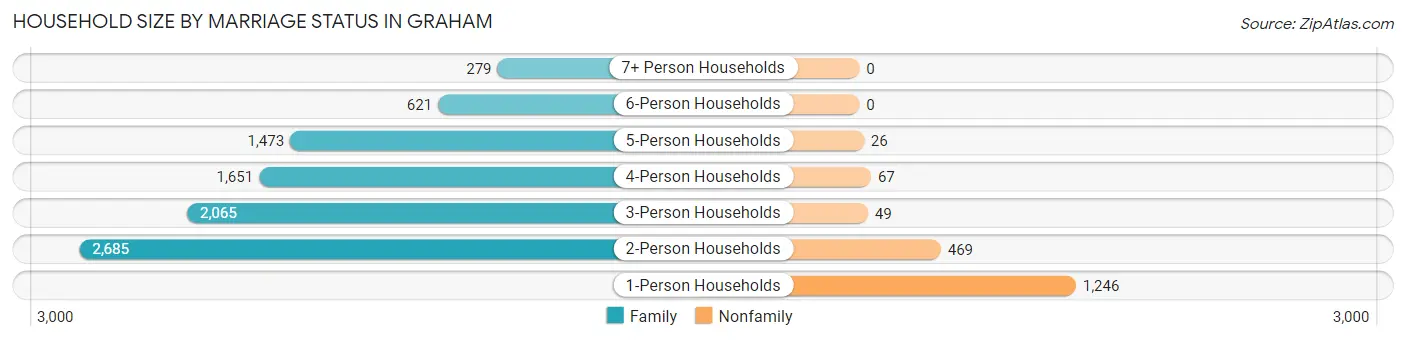
| Household Size | Family Households | Nonfamily Households |
| 1-Person Households | - | 1,246 (11.7%) |
| 2-Person Households | 2,685 (25.3%) | 469 (4.4%) |
| 3-Person Households | 2,065 (19.4%) | 49 (0.5%) |
| 4-Person Households | 1,651 (15.5%) | 67 (0.6%) |
| 5-Person Households | 1,473 (13.9%) | 26 (0.2%) |
| 6-Person Households | 621 (5.8%) | 0 (0.0%) |
| 7+ Person Households | 279 (2.6%) | 0 (0.0%) |
| Total | 8,774 (82.5%) | 1,857 (17.5%) |
Female Fertility in Graham
Fertility by Age in Graham
Average fertility rate in Graham is 62.0 births per 1,000 women. Women in the age bracket of 20 to 34 years have the highest fertility rate with 140.0 births per 1,000 women. Women in the age bracket of 20 to 34 years acount for 80.0% of all women with births.
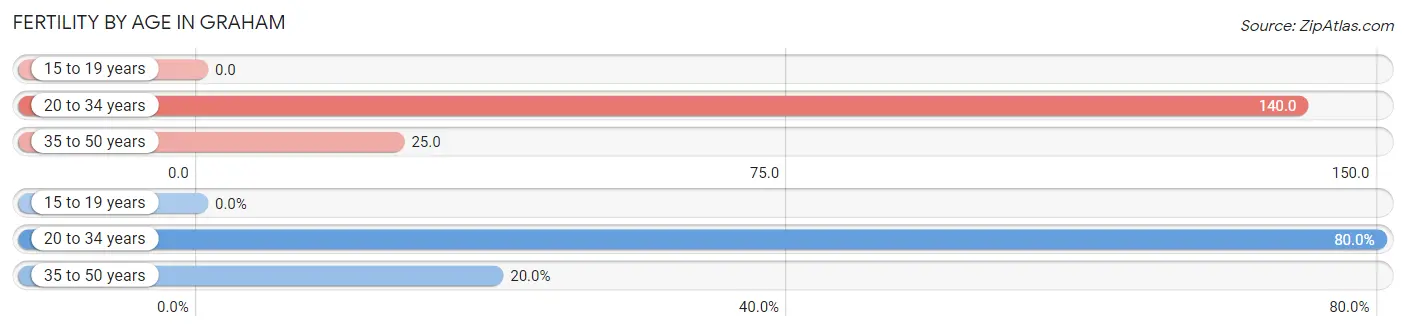
| Age Bracket | Women with Births | Births / 1,000 Women |
| 15 to 19 years | 0 (0.0%) | 0.0 |
| 20 to 34 years | 367 (80.0%) | 140.0 |
| 35 to 50 years | 92 (20.0%) | 25.0 |
| Total | 459 (100.0%) | 62.0 |
Fertility by Age by Marriage Status in Graham
70.8% of women with births (459) in Graham are married. The highest percentage of unmarried women with births falls into 20 to 34 years age bracket with 33.5% of them unmarried at the time of birth, while the lowest percentage of unmarried women with births belong to 35 to 50 years age bracket with 12.0% of them unmarried.
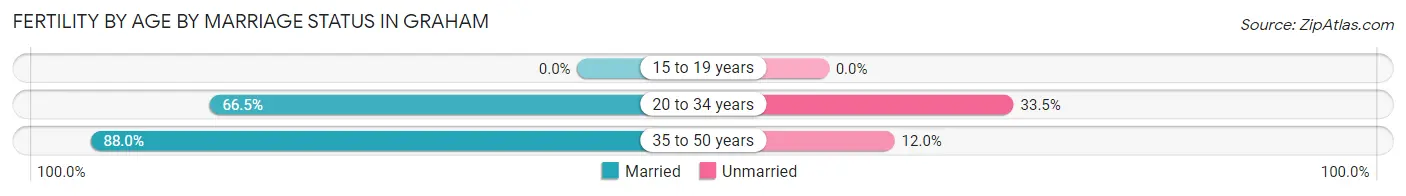
| Age Bracket | Married | Unmarried |
| 15 to 19 years | 0 (0.0%) | 0 (0.0%) |
| 20 to 34 years | 244 (66.5%) | 123 (33.5%) |
| 35 to 50 years | 81 (88.0%) | 11 (12.0%) |
| Total | 325 (70.8%) | 134 (29.2%) |
Fertility by Education in Graham
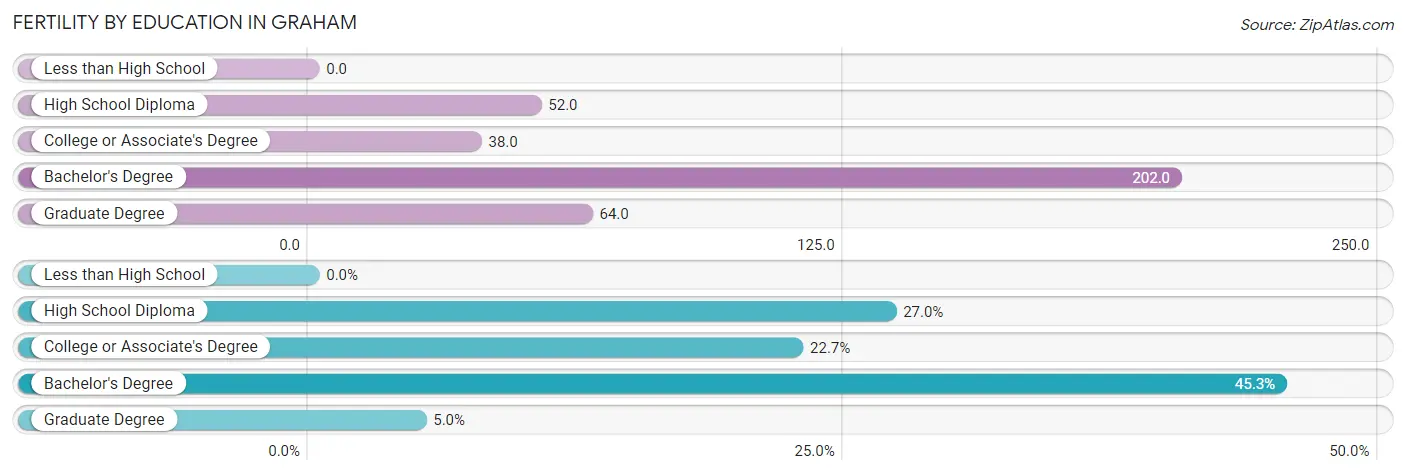
| Educational Attainment | Women with Births | Births / 1,000 Women |
| Less than High School | 0 (0.0%) | 0.0 |
| High School Diploma | 124 (27.0%) | 52.0 |
| College or Associate's Degree | 104 (22.7%) | 38.0 |
| Bachelor's Degree | 208 (45.3%) | 202.0 |
| Graduate Degree | 23 (5.0%) | 64.0 |
| Total | 459 (100.0%) | 62.0 |
Fertility by Education by Marriage Status in Graham
29.2% of women with births in Graham are unmarried. Women with the educational attainment of college or associate's degree are most likely to be married with 100.0% of them married at childbirth, while women with the educational attainment of high school diploma are least likely to be married with 79.8% of them unmarried at childbirth.
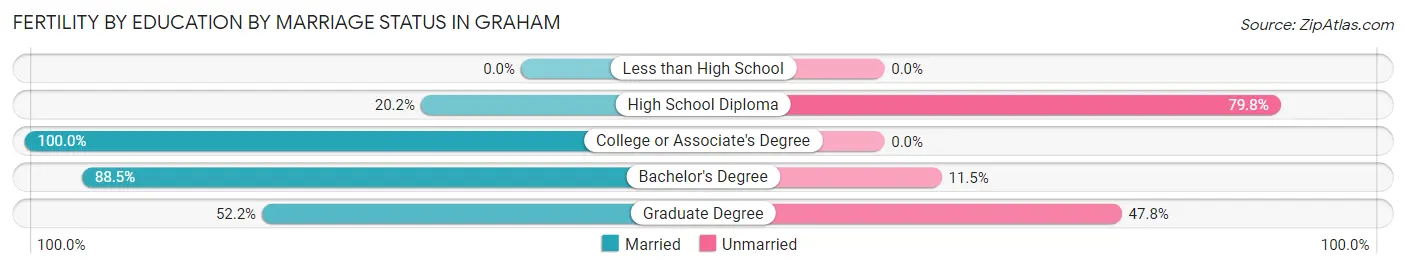
| Educational Attainment | Married | Unmarried |
| Less than High School | 0 (0.0%) | 0 (0.0%) |
| High School Diploma | 25 (20.2%) | 99 (79.8%) |
| College or Associate's Degree | 104 (100.0%) | 0 (0.0%) |
| Bachelor's Degree | 184 (88.5%) | 24 (11.5%) |
| Graduate Degree | 12 (52.2%) | 11 (47.8%) |
| Total | 325 (70.8%) | 134 (29.2%) |
Employment Characteristics in Graham
Employment by Class of Employer in Graham
Among the 15,996 employed individuals in Graham, private company employees (10,711 | 67.0%), local government employees (1,321 | 8.3%), and not-for-profit organizations (1,104 | 6.9%) make up the most common classes of employment.
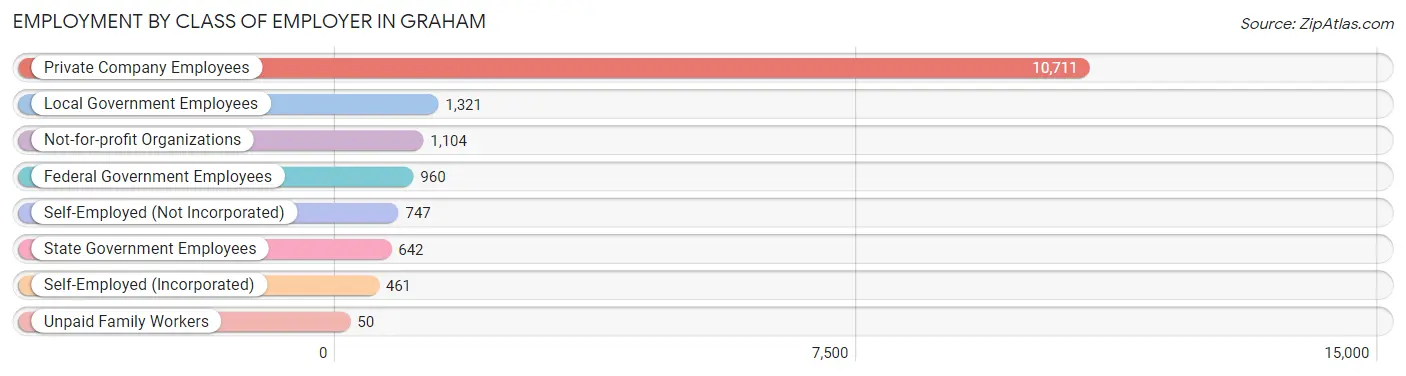
| Employer Class | # Employees | % Employees |
| Private Company Employees | 10,711 | 67.0% |
| Self-Employed (Incorporated) | 461 | 2.9% |
| Self-Employed (Not Incorporated) | 747 | 4.7% |
| Not-for-profit Organizations | 1,104 | 6.9% |
| Local Government Employees | 1,321 | 8.3% |
| State Government Employees | 642 | 4.0% |
| Federal Government Employees | 960 | 6.0% |
| Unpaid Family Workers | 50 | 0.3% |
| Total | 15,996 | 100.0% |
Employment Status by Age in Graham
According to the labor force statistics for Graham, out of the total population over 16 years of age (25,798), 67.2% or 17,336 individuals are in the labor force, with 5.8% or 1,005 of them unemployed. The age group with the highest labor force participation rate is 35 to 44 years, with 86.8% or 4,292 individuals in the labor force. Within the labor force, the 16 to 19 years age range has the highest percentage of unemployed individuals, with 12.9% or 126 of them being unemployed.
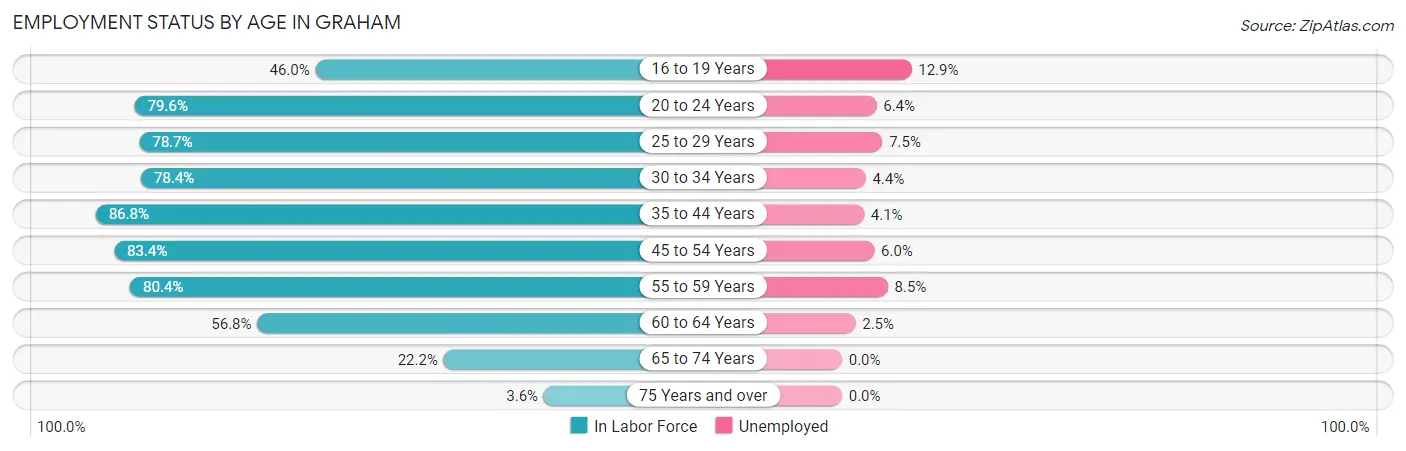
| Age Bracket | In Labor Force | Unemployed |
| 16 to 19 Years | 976 (46.0%) | 126 (12.9%) |
| 20 to 24 Years | 1,622 (79.6%) | 104 (6.4%) |
| 25 to 29 Years | 1,720 (78.7%) | 129 (7.5%) |
| 30 to 34 Years | 1,519 (78.4%) | 67 (4.4%) |
| 35 to 44 Years | 4,292 (86.8%) | 176 (4.1%) |
| 45 to 54 Years | 3,770 (83.4%) | 226 (6.0%) |
| 55 to 59 Years | 1,667 (80.4%) | 142 (8.5%) |
| 60 to 64 Years | 1,213 (56.8%) | 30 (2.5%) |
| 65 to 74 Years | 513 (22.2%) | 0 (0.0%) |
| 75 Years and over | 55 (3.6%) | 0 (0.0%) |
| Total | 17,336 (67.2%) | 1,005 (5.8%) |
Employment Status by Educational Attainment in Graham
According to labor force statistics for Graham, 79.7% of individuals (14,183) out of the total population between 25 and 64 years of age (17,796) are in the labor force, with 5.5% or 780 of them being unemployed. The group with the highest labor force participation rate are those with the educational attainment of bachelor's degree or higher, with 83.4% or 3,092 individuals in the labor force. Within the labor force, individuals with less than high school education have the highest percentage of unemployment, with 13.8% or 117 of them being unemployed.
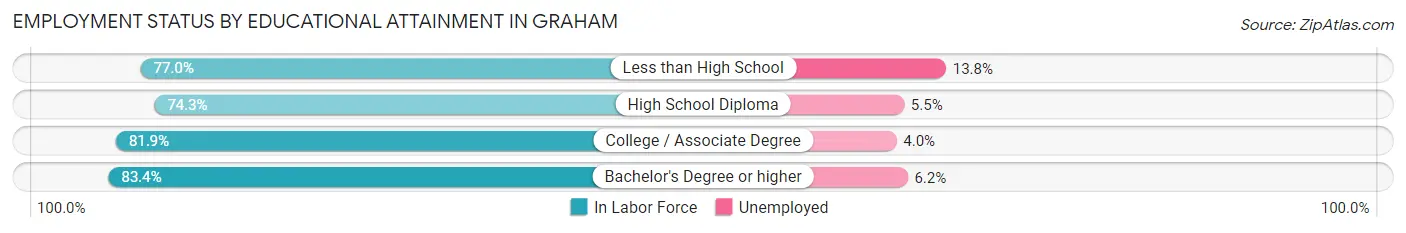
| Educational Attainment | In Labor Force | Unemployed |
| Less than High School | 849 (77.0%) | 152 (13.8%) |
| High School Diploma | 3,888 (74.3%) | 288 (5.5%) |
| College / Associate Degree | 6,349 (81.9%) | 310 (4.0%) |
| Bachelor's Degree or higher | 3,092 (83.4%) | 230 (6.2%) |
| Total | 14,183 (79.7%) | 979 (5.5%) |
Employment Occupations by Sex in Graham
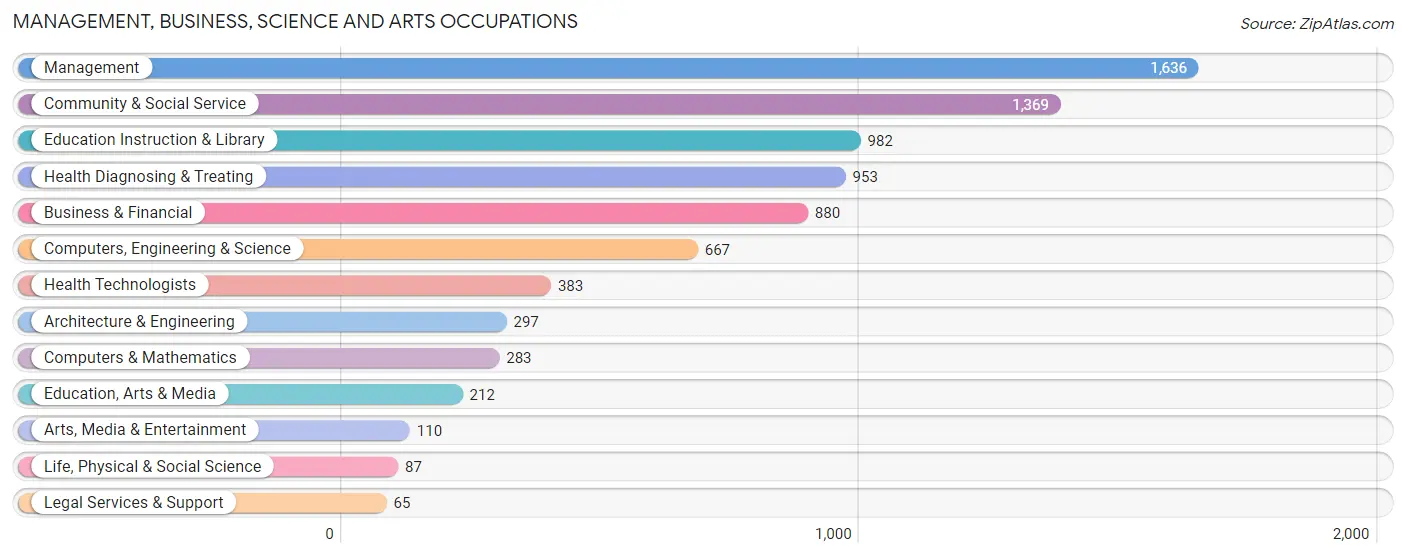
Management, Business, Science and Arts Occupations
The most common Management, Business, Science and Arts occupations in Graham are Management (1,636 | 10.2%), Community & Social Service (1,369 | 8.5%), Education Instruction & Library (982 | 6.1%), Health Diagnosing & Treating (953 | 5.9%), and Business & Financial (880 | 5.5%).
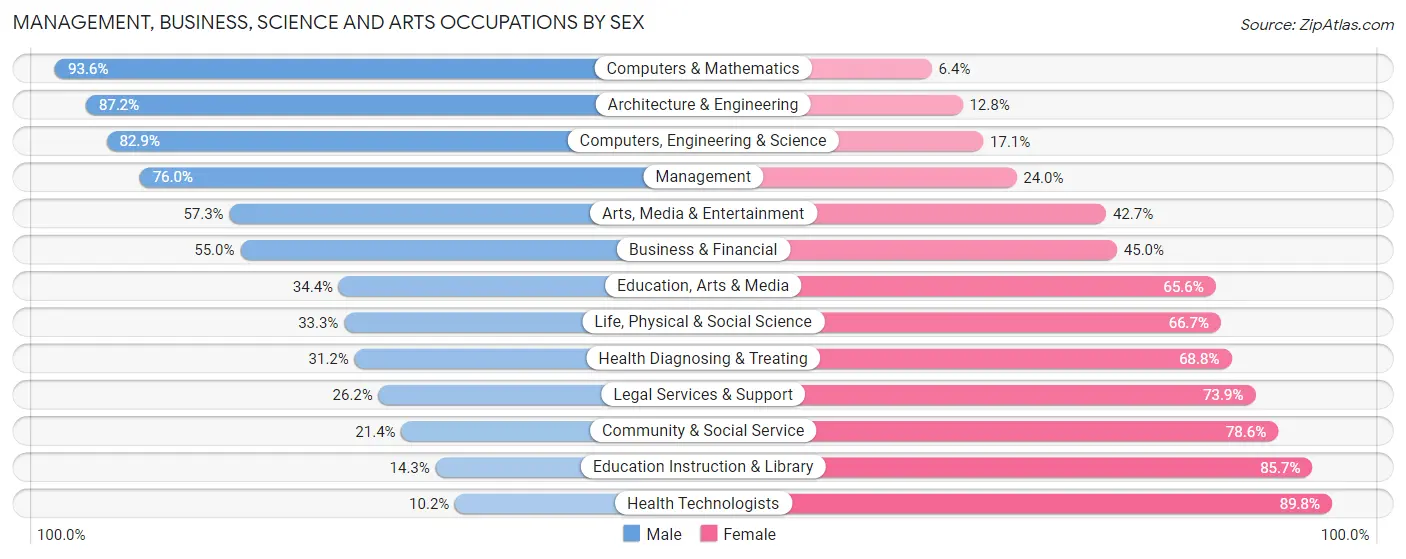
Management, Business, Science and Arts Occupations by Sex
Within the Management, Business, Science and Arts occupations in Graham, the most male-oriented occupations are Computers & Mathematics (93.6%), Architecture & Engineering (87.2%), and Computers, Engineering & Science (82.9%), while the most female-oriented occupations are Health Technologists (89.8%), Education Instruction & Library (85.7%), and Community & Social Service (78.6%).
| Occupation | Male | Female |
| Management | 1,243 (76.0%) | 393 (24.0%) |
| Business & Financial | 484 (55.0%) | 396 (45.0%) |
| Computers, Engineering & Science | 553 (82.9%) | 114 (17.1%) |
| Computers & Mathematics | 265 (93.6%) | 18 (6.4%) |
| Architecture & Engineering | 259 (87.2%) | 38 (12.8%) |
| Life, Physical & Social Science | 29 (33.3%) | 58 (66.7%) |
| Community & Social Service | 293 (21.4%) | 1,076 (78.6%) |
| Education, Arts & Media | 73 (34.4%) | 139 (65.6%) |
| Legal Services & Support | 17 (26.2%) | 48 (73.9%) |
| Education Instruction & Library | 140 (14.3%) | 842 (85.7%) |
| Arts, Media & Entertainment | 63 (57.3%) | 47 (42.7%) |
| Health Diagnosing & Treating | 297 (31.2%) | 656 (68.8%) |
| Health Technologists | 39 (10.2%) | 344 (89.8%) |
| Total (Category) | 2,870 (52.1%) | 2,635 (47.9%) |
| Total (Overall) | 9,067 (56.4%) | 7,020 (43.6%) |
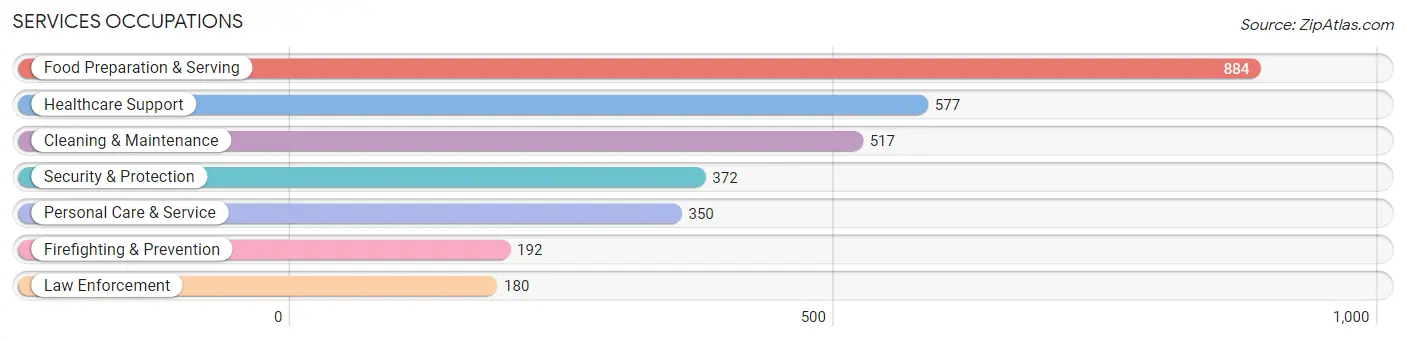
Services Occupations
The most common Services occupations in Graham are Food Preparation & Serving (884 | 5.5%), Healthcare Support (577 | 3.6%), Cleaning & Maintenance (517 | 3.2%), Security & Protection (372 | 2.3%), and Personal Care & Service (350 | 2.2%).
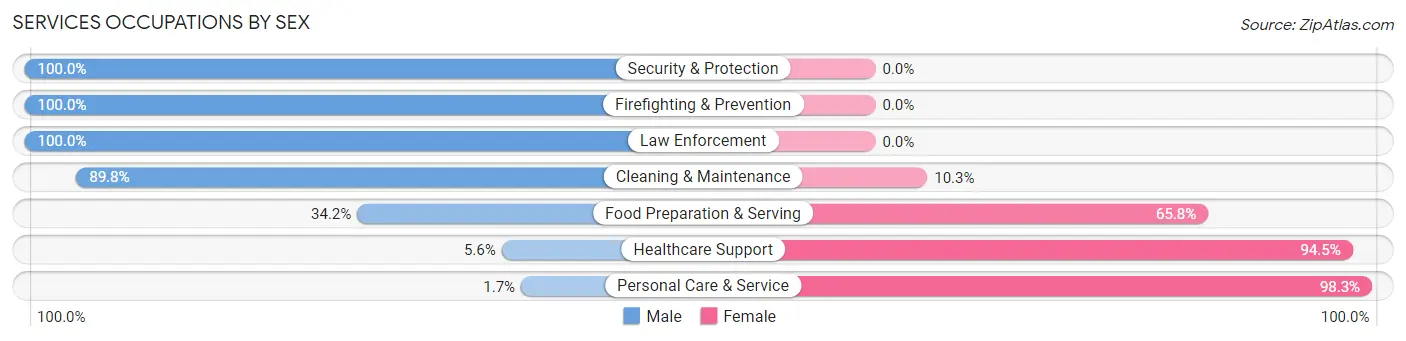
Services Occupations by Sex
Within the Services occupations in Graham, the most male-oriented occupations are Security & Protection (100.0%), Firefighting & Prevention (100.0%), and Law Enforcement (100.0%), while the most female-oriented occupations are Personal Care & Service (98.3%), Healthcare Support (94.5%), and Food Preparation & Serving (65.8%).
| Occupation | Male | Female |
| Healthcare Support | 32 (5.6%) | 545 (94.5%) |
| Security & Protection | 372 (100.0%) | 0 (0.0%) |
| Firefighting & Prevention | 192 (100.0%) | 0 (0.0%) |
| Law Enforcement | 180 (100.0%) | 0 (0.0%) |
| Food Preparation & Serving | 302 (34.2%) | 582 (65.8%) |
| Cleaning & Maintenance | 464 (89.7%) | 53 (10.2%) |
| Personal Care & Service | 6 (1.7%) | 344 (98.3%) |
| Total (Category) | 1,176 (43.6%) | 1,524 (56.4%) |
| Total (Overall) | 9,067 (56.4%) | 7,020 (43.6%) |
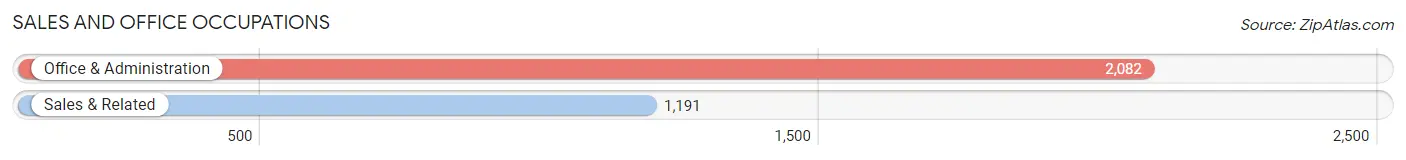
Sales and Office Occupations
The most common Sales and Office occupations in Graham are Office & Administration (2,082 | 12.9%), and Sales & Related (1,191 | 7.4%).
Sales and Office Occupations by Sex
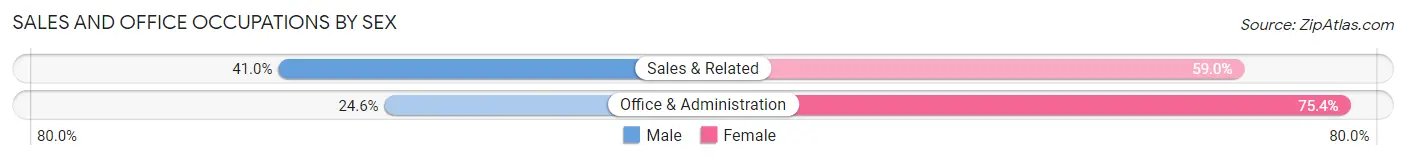
| Occupation | Male | Female |
| Sales & Related | 488 (41.0%) | 703 (59.0%) |
| Office & Administration | 513 (24.6%) | 1,569 (75.4%) |
| Total (Category) | 1,001 (30.6%) | 2,272 (69.4%) |
| Total (Overall) | 9,067 (56.4%) | 7,020 (43.6%) |
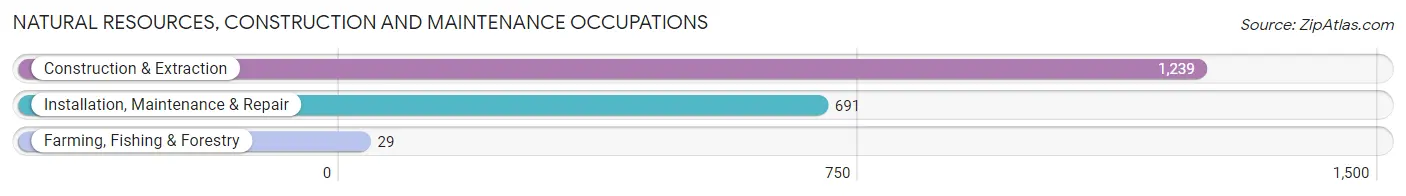
Natural Resources, Construction and Maintenance Occupations
The most common Natural Resources, Construction and Maintenance occupations in Graham are Construction & Extraction (1,239 | 7.7%), Installation, Maintenance & Repair (691 | 4.3%), and Farming, Fishing & Forestry (29 | 0.2%).
Natural Resources, Construction and Maintenance Occupations by Sex
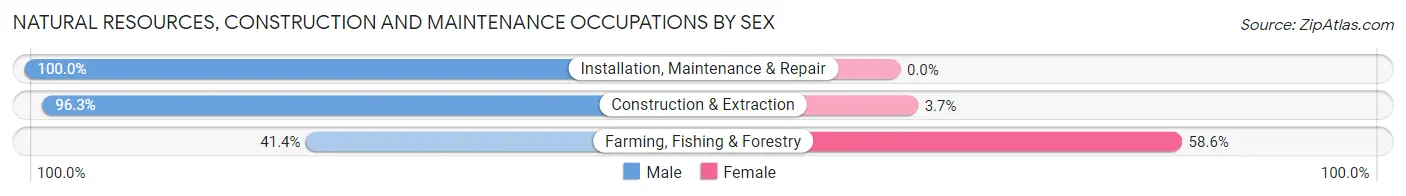
| Occupation | Male | Female |
| Farming, Fishing & Forestry | 12 (41.4%) | 17 (58.6%) |
| Construction & Extraction | 1,193 (96.3%) | 46 (3.7%) |
| Installation, Maintenance & Repair | 691 (100.0%) | 0 (0.0%) |
| Total (Category) | 1,896 (96.8%) | 63 (3.2%) |
| Total (Overall) | 9,067 (56.4%) | 7,020 (43.6%) |
Production, Transportation and Moving Occupations
The most common Production, Transportation and Moving occupations in Graham are Material Moving (973 | 6.0%), Production (934 | 5.8%), and Transportation (743 | 4.6%).
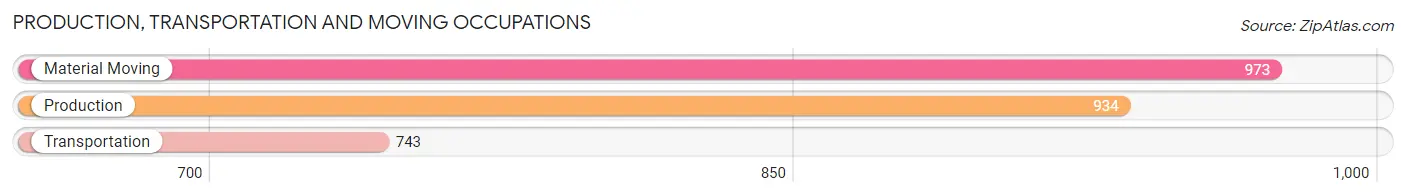
Production, Transportation and Moving Occupations by Sex
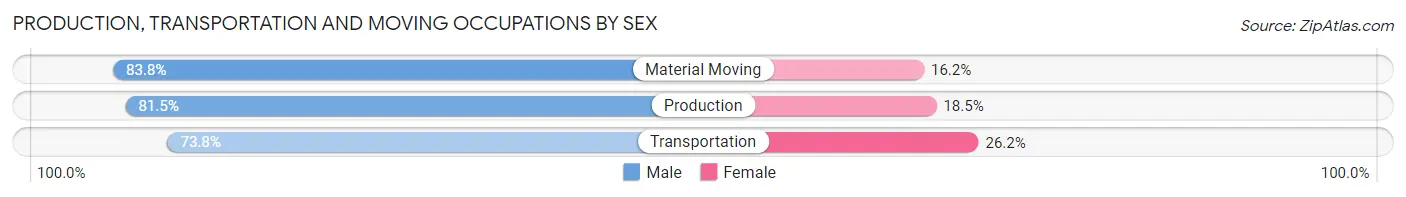
| Occupation | Male | Female |
| Production | 761 (81.5%) | 173 (18.5%) |
| Transportation | 548 (73.8%) | 195 (26.2%) |
| Material Moving | 815 (83.8%) | 158 (16.2%) |
| Total (Category) | 2,124 (80.1%) | 526 (19.9%) |
| Total (Overall) | 9,067 (56.4%) | 7,020 (43.6%) |
Employment Industries by Sex in Graham
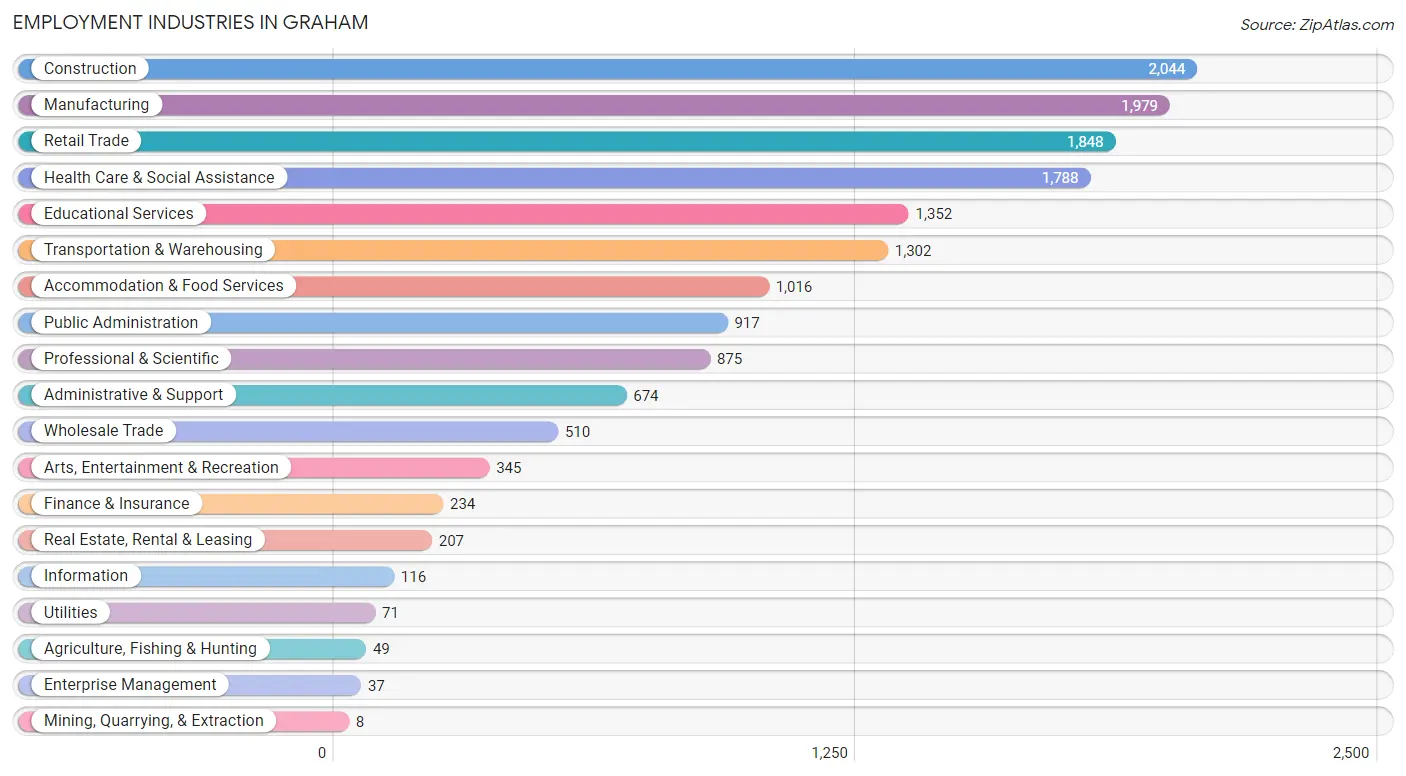
Employment Industries in Graham
The major employment industries in Graham include Construction (2,044 | 12.7%), Manufacturing (1,979 | 12.3%), Retail Trade (1,848 | 11.5%), Health Care & Social Assistance (1,788 | 11.1%), and Educational Services (1,352 | 8.4%).
Employment Industries by Sex in Graham
The Graham industries that see more men than women are Mining, Quarrying, & Extraction (100.0%), Enterprise Management (100.0%), and Administrative & Support (89.5%), whereas the industries that tend to have a higher number of women are Health Care & Social Assistance (83.2%), Information (82.8%), and Educational Services (82.0%).
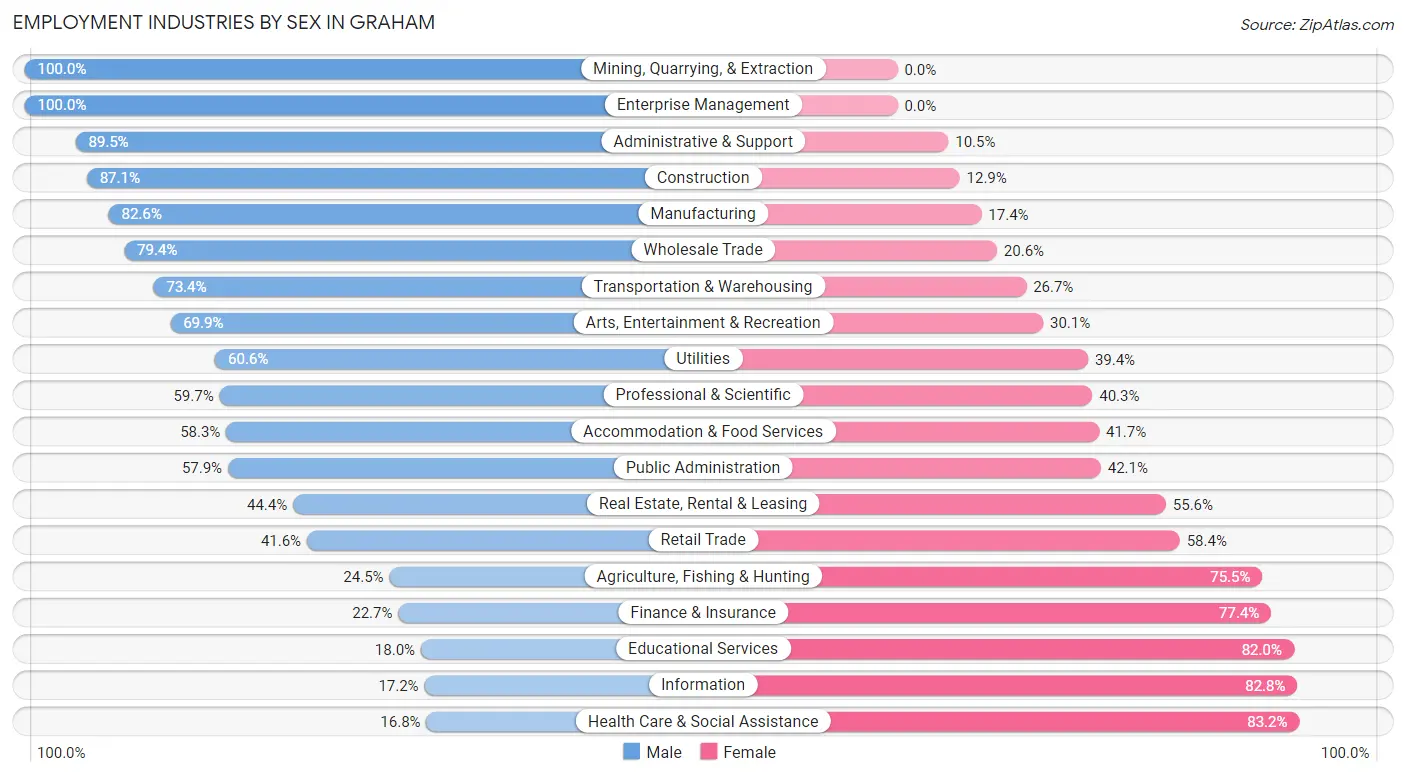
| Industry | Male | Female |
| Agriculture, Fishing & Hunting | 12 (24.5%) | 37 (75.5%) |
| Mining, Quarrying, & Extraction | 8 (100.0%) | 0 (0.0%) |
| Construction | 1,781 (87.1%) | 263 (12.9%) |
| Manufacturing | 1,635 (82.6%) | 344 (17.4%) |
| Wholesale Trade | 405 (79.4%) | 105 (20.6%) |
| Retail Trade | 768 (41.6%) | 1,080 (58.4%) |
| Transportation & Warehousing | 955 (73.4%) | 347 (26.7%) |
| Utilities | 43 (60.6%) | 28 (39.4%) |
| Information | 20 (17.2%) | 96 (82.8%) |
| Finance & Insurance | 53 (22.7%) | 181 (77.3%) |
| Real Estate, Rental & Leasing | 92 (44.4%) | 115 (55.6%) |
| Professional & Scientific | 522 (59.7%) | 353 (40.3%) |
| Enterprise Management | 37 (100.0%) | 0 (0.0%) |
| Administrative & Support | 603 (89.5%) | 71 (10.5%) |
| Educational Services | 243 (18.0%) | 1,109 (82.0%) |
| Health Care & Social Assistance | 301 (16.8%) | 1,487 (83.2%) |
| Arts, Entertainment & Recreation | 241 (69.9%) | 104 (30.1%) |
| Accommodation & Food Services | 592 (58.3%) | 424 (41.7%) |
| Public Administration | 531 (57.9%) | 386 (42.1%) |
| Total | 9,067 (56.4%) | 7,020 (43.6%) |
Education in Graham
School Enrollment in Graham
The most common levels of schooling among the 9,600 students in Graham are elementary school (2,531 | 26.4%), middle school (2,470 | 25.7%), and high school (2,274 | 23.7%).
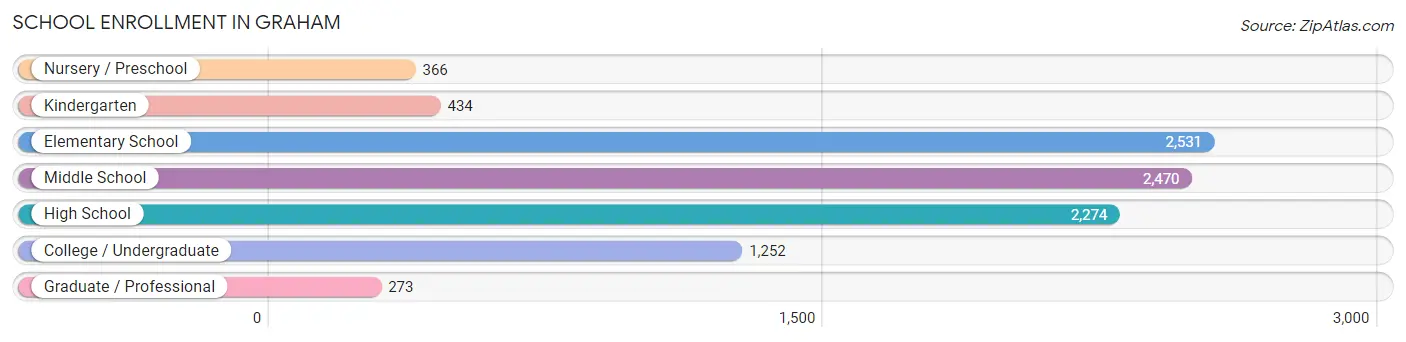
| School Level | # Students | % Students |
| Nursery / Preschool | 366 | 3.8% |
| Kindergarten | 434 | 4.5% |
| Elementary School | 2,531 | 26.4% |
| Middle School | 2,470 | 25.7% |
| High School | 2,274 | 23.7% |
| College / Undergraduate | 1,252 | 13.0% |
| Graduate / Professional | 273 | 2.8% |
| Total | 9,600 | 100.0% |
School Enrollment by Age by Funding Source in Graham
Out of a total of 9,600 students who are enrolled in schools in Graham, 1,642 (17.1%) attend a private institution, while the remaining 7,958 (82.9%) are enrolled in public schools. The age group of 35 years and over has the highest likelihood of being enrolled in private schools, with 186 (44.6% in the age bracket) enrolled. Conversely, the age group of 15 to 17 year olds has the lowest likelihood of being enrolled in a private school, with 1,615 (91.3% in the age bracket) attending a public institution.
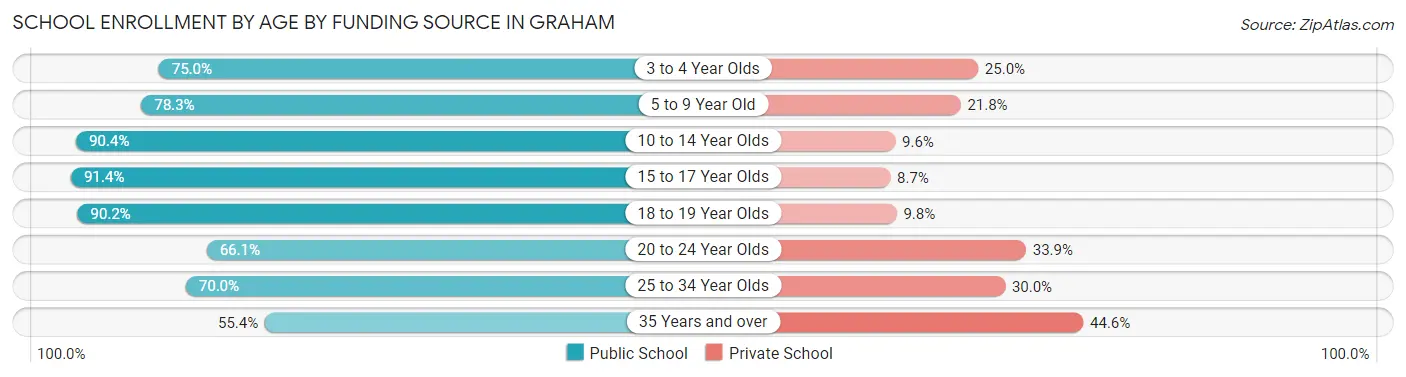
| Age Bracket | Public School | Private School |
| 3 to 4 Year Olds | 210 (75.0%) | 70 (25.0%) |
| 5 to 9 Year Old | 2,238 (78.2%) | 622 (21.7%) |
| 10 to 14 Year Olds | 2,595 (90.4%) | 275 (9.6%) |
| 15 to 17 Year Olds | 1,615 (91.3%) | 153 (8.6%) |
| 18 to 19 Year Olds | 513 (90.2%) | 56 (9.8%) |
| 20 to 24 Year Olds | 405 (66.1%) | 208 (33.9%) |
| 25 to 34 Year Olds | 156 (70.0%) | 67 (30.0%) |
| 35 Years and over | 231 (55.4%) | 186 (44.6%) |
| Total | 7,958 (82.9%) | 1,642 (17.1%) |
Educational Attainment by Field of Study in Graham
Business (1,064 | 22.6%), arts & humanities (733 | 15.6%), education (715 | 15.2%), science & technology (488 | 10.4%), and psychology (249 | 5.3%) are the most common fields of study among 4,709 individuals in Graham who have obtained a bachelor's degree or higher.
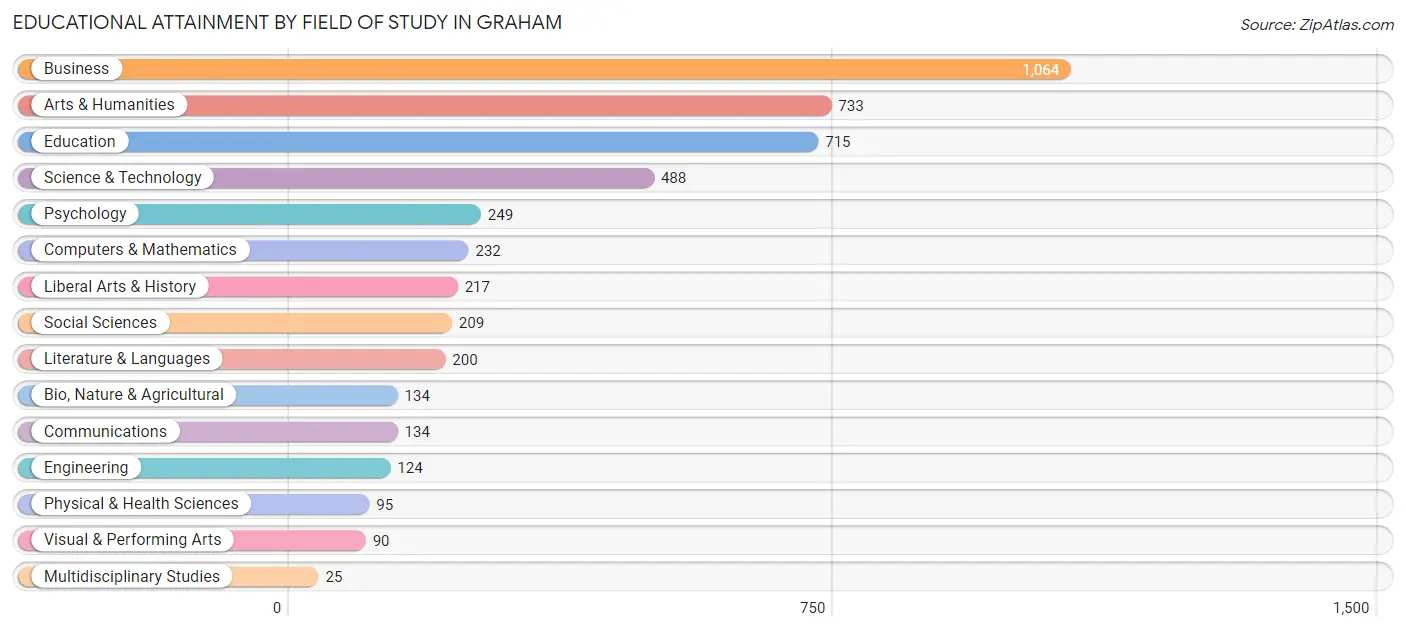
| Field of Study | # Graduates | % Graduates |
| Computers & Mathematics | 232 | 4.9% |
| Bio, Nature & Agricultural | 134 | 2.9% |
| Physical & Health Sciences | 95 | 2.0% |
| Psychology | 249 | 5.3% |
| Social Sciences | 209 | 4.4% |
| Engineering | 124 | 2.6% |
| Multidisciplinary Studies | 25 | 0.5% |
| Science & Technology | 488 | 10.4% |
| Business | 1,064 | 22.6% |
| Education | 715 | 15.2% |
| Literature & Languages | 200 | 4.3% |
| Liberal Arts & History | 217 | 4.6% |
| Visual & Performing Arts | 90 | 1.9% |
| Communications | 134 | 2.9% |
| Arts & Humanities | 733 | 15.6% |
| Total | 4,709 | 100.0% |
Transportation & Commute in Graham
Vehicle Availability by Sex in Graham
The most prevalent vehicle ownership categories in Graham are males with 3 vehicles (2,958, accounting for 32.7%) and females with 3 vehicles (1,547, making up 42.7%).
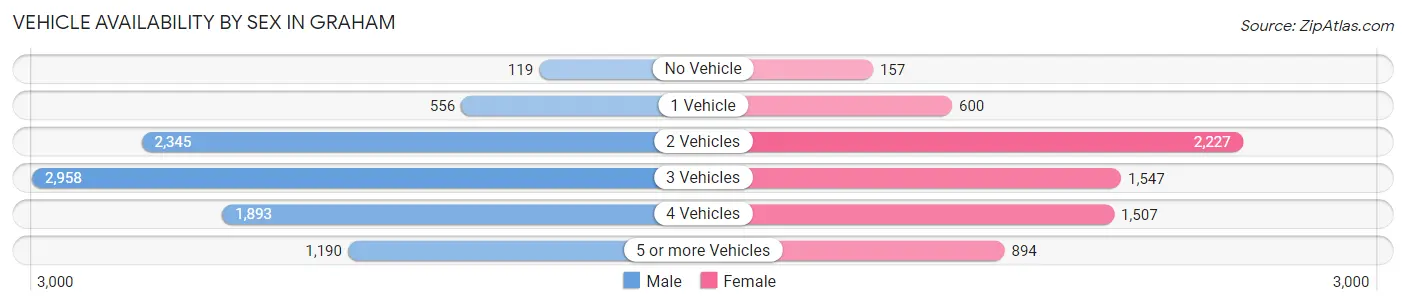
| Vehicles Available | Male | Female |
| No Vehicle | 119 (1.3%) | 157 (2.3%) |
| 1 Vehicle | 556 (6.1%) | 600 (8.7%) |
| 2 Vehicles | 2,345 (25.9%) | 2,227 (32.1%) |
| 3 Vehicles | 2,958 (32.7%) | 1,547 (22.3%) |
| 4 Vehicles | 1,893 (20.9%) | 1,507 (21.7%) |
| 5 or more Vehicles | 1,190 (13.1%) | 894 (12.9%) |
| Total | 9,061 (100.0%) | 6,932 (100.0%) |
Commute Time in Graham
The most frequently occuring commute durations in Graham are 45 to 59 minutes (2,616 commuters, 17.9%), 60 to 89 minutes (2,103 commuters, 14.4%), and 30 to 34 minutes (1,870 commuters, 12.8%).
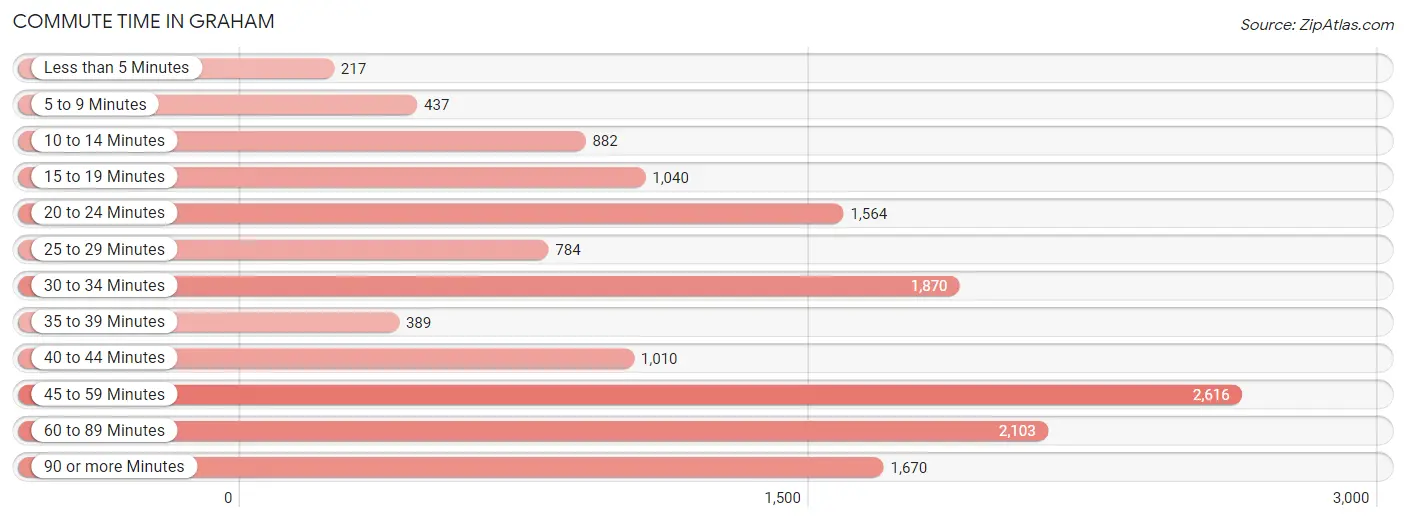
| Commute Time | # Commuters | % Commuters |
| Less than 5 Minutes | 217 | 1.5% |
| 5 to 9 Minutes | 437 | 3.0% |
| 10 to 14 Minutes | 882 | 6.0% |
| 15 to 19 Minutes | 1,040 | 7.1% |
| 20 to 24 Minutes | 1,564 | 10.7% |
| 25 to 29 Minutes | 784 | 5.4% |
| 30 to 34 Minutes | 1,870 | 12.8% |
| 35 to 39 Minutes | 389 | 2.7% |
| 40 to 44 Minutes | 1,010 | 6.9% |
| 45 to 59 Minutes | 2,616 | 17.9% |
| 60 to 89 Minutes | 2,103 | 14.4% |
| 90 or more Minutes | 1,670 | 11.5% |
Commute Time by Sex in Graham
The most common commute times in Graham are 45 to 59 minutes (1,530 commuters, 18.5%) for males and 45 to 59 minutes (1,086 commuters, 17.1%) for females.
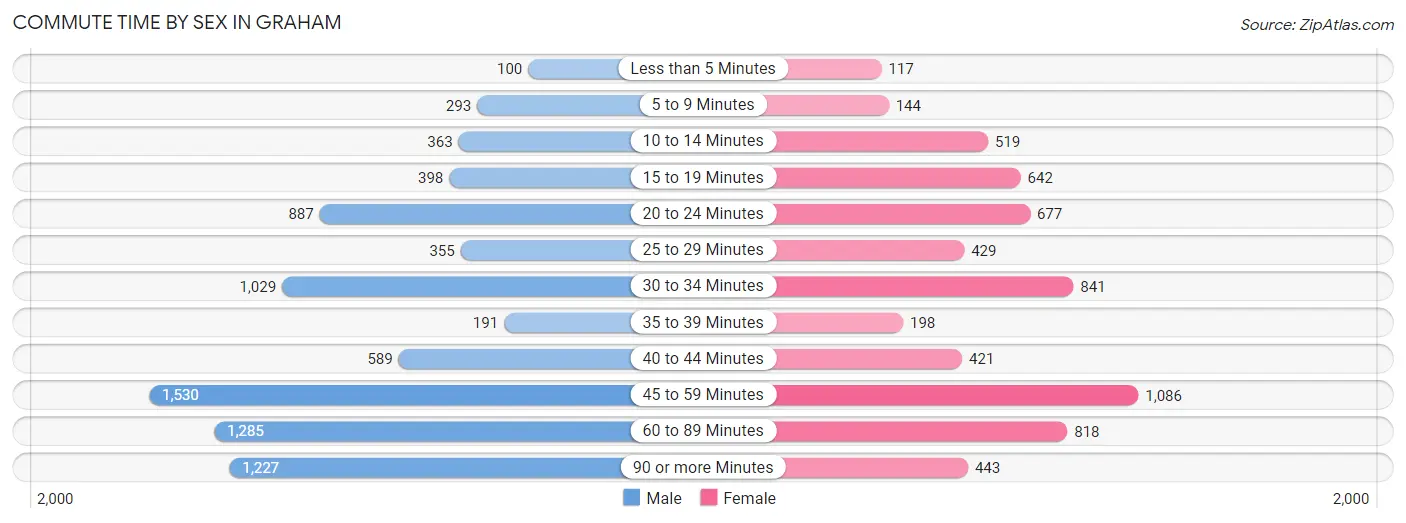
| Commute Time | Male | Female |
| Less than 5 Minutes | 100 (1.2%) | 117 (1.8%) |
| 5 to 9 Minutes | 293 (3.5%) | 144 (2.3%) |
| 10 to 14 Minutes | 363 (4.4%) | 519 (8.2%) |
| 15 to 19 Minutes | 398 (4.8%) | 642 (10.1%) |
| 20 to 24 Minutes | 887 (10.8%) | 677 (10.7%) |
| 25 to 29 Minutes | 355 (4.3%) | 429 (6.8%) |
| 30 to 34 Minutes | 1,029 (12.5%) | 841 (13.3%) |
| 35 to 39 Minutes | 191 (2.3%) | 198 (3.1%) |
| 40 to 44 Minutes | 589 (7.1%) | 421 (6.7%) |
| 45 to 59 Minutes | 1,530 (18.5%) | 1,086 (17.1%) |
| 60 to 89 Minutes | 1,285 (15.6%) | 818 (12.9%) |
| 90 or more Minutes | 1,227 (14.9%) | 443 (7.0%) |
Time of Departure to Work by Sex in Graham
The most frequent times of departure to work in Graham are 12:00 AM to 4:59 AM (1,394, 16.9%) for males and 7:00 AM to 7:29 AM (789, 12.4%) for females.
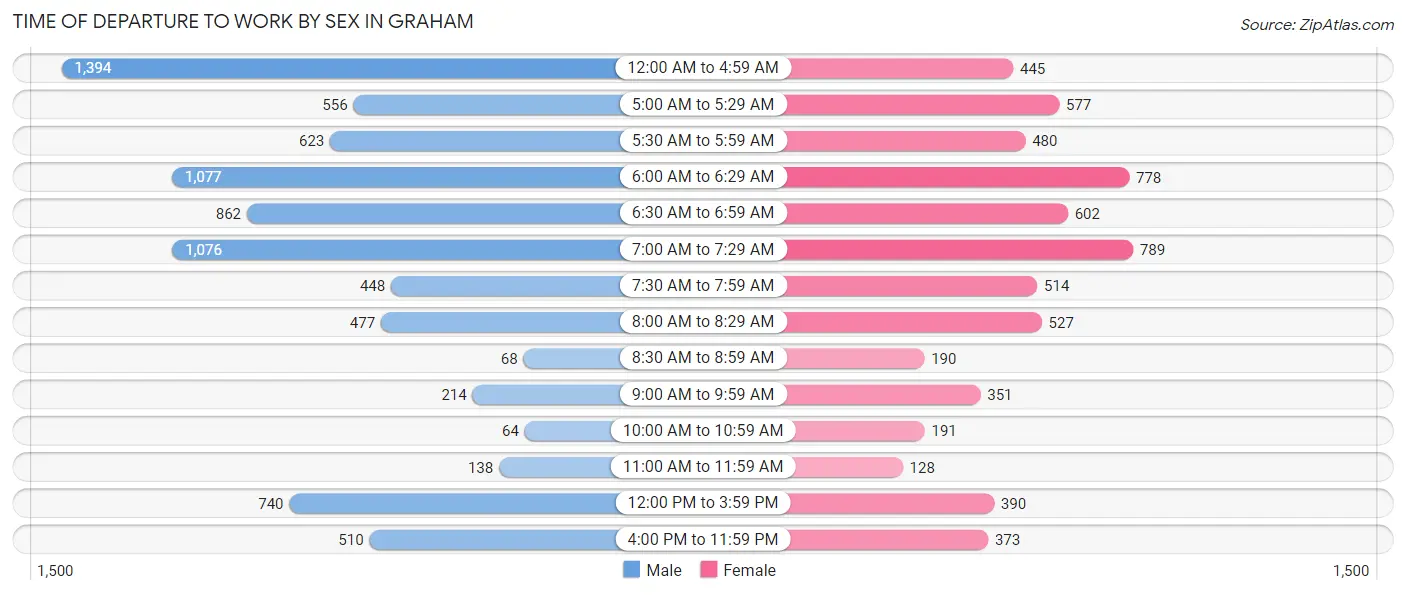
| Time of Departure | Male | Female |
| 12:00 AM to 4:59 AM | 1,394 (16.9%) | 445 (7.0%) |
| 5:00 AM to 5:29 AM | 556 (6.7%) | 577 (9.1%) |
| 5:30 AM to 5:59 AM | 623 (7.5%) | 480 (7.6%) |
| 6:00 AM to 6:29 AM | 1,077 (13.1%) | 778 (12.3%) |
| 6:30 AM to 6:59 AM | 862 (10.4%) | 602 (9.5%) |
| 7:00 AM to 7:29 AM | 1,076 (13.1%) | 789 (12.4%) |
| 7:30 AM to 7:59 AM | 448 (5.4%) | 514 (8.1%) |
| 8:00 AM to 8:29 AM | 477 (5.8%) | 527 (8.3%) |
| 8:30 AM to 8:59 AM | 68 (0.8%) | 190 (3.0%) |
| 9:00 AM to 9:59 AM | 214 (2.6%) | 351 (5.5%) |
| 10:00 AM to 10:59 AM | 64 (0.8%) | 191 (3.0%) |
| 11:00 AM to 11:59 AM | 138 (1.7%) | 128 (2.0%) |
| 12:00 PM to 3:59 PM | 740 (9.0%) | 390 (6.2%) |
| 4:00 PM to 11:59 PM | 510 (6.2%) | 373 (5.9%) |
| Total | 8,247 (100.0%) | 6,335 (100.0%) |
Housing Occupancy in Graham
Occupancy by Ownership in Graham
Of the total 10,631 dwellings in Graham, owner-occupied units account for 8,770 (82.5%), while renter-occupied units make up 1,861 (17.5%).
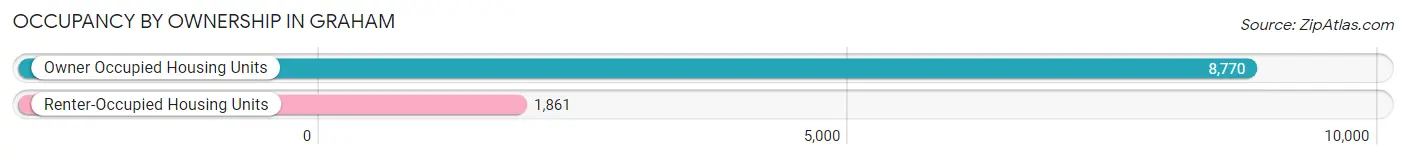
| Occupancy | # Housing Units | % Housing Units |
| Owner Occupied Housing Units | 8,770 | 82.5% |
| Renter-Occupied Housing Units | 1,861 | 17.5% |
| Total Occupied Housing Units | 10,631 | 100.0% |
Occupancy by Household Size in Graham
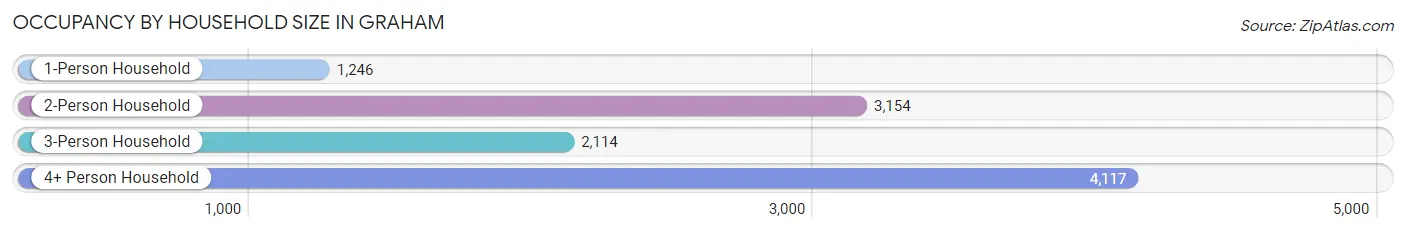
| Household Size | # Housing Units | % Housing Units |
| 1-Person Household | 1,246 | 11.7% |
| 2-Person Household | 3,154 | 29.7% |
| 3-Person Household | 2,114 | 19.9% |
| 4+ Person Household | 4,117 | 38.7% |
| Total Housing Units | 10,631 | 100.0% |
Occupancy by Ownership by Household Size in Graham
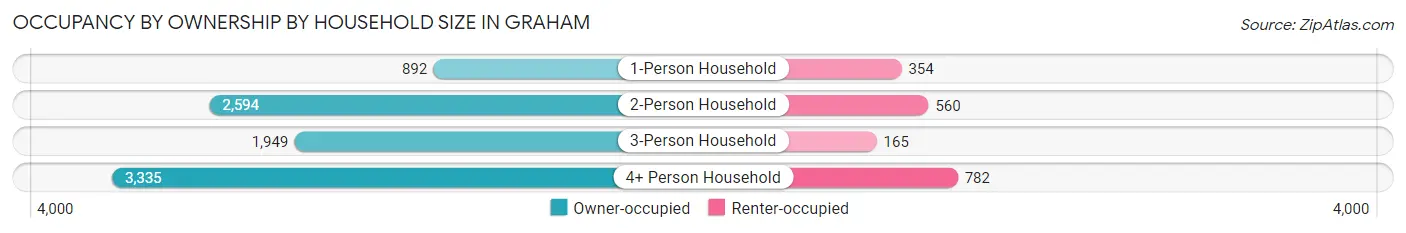
| Household Size | Owner-occupied | Renter-occupied |
| 1-Person Household | 892 (71.6%) | 354 (28.4%) |
| 2-Person Household | 2,594 (82.2%) | 560 (17.8%) |
| 3-Person Household | 1,949 (92.2%) | 165 (7.8%) |
| 4+ Person Household | 3,335 (81.0%) | 782 (19.0%) |
| Total Housing Units | 8,770 (82.5%) | 1,861 (17.5%) |
Occupancy by Educational Attainment in Graham
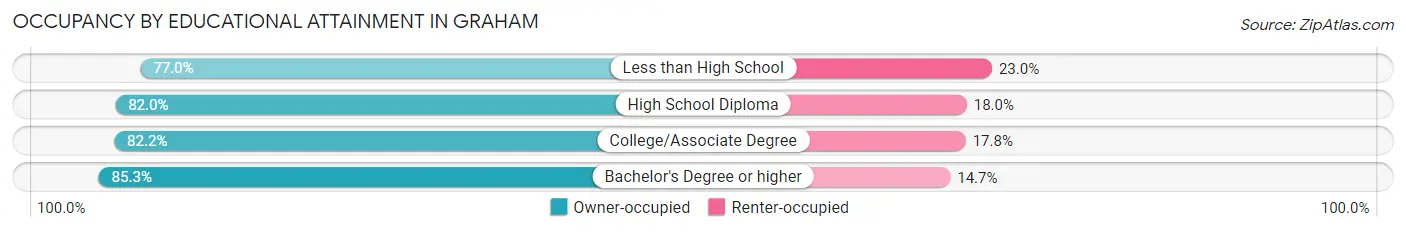
| Household Size | Owner-occupied | Renter-occupied |
| Less than High School | 604 (77.0%) | 180 (23.0%) |
| High School Diploma | 1,949 (82.0%) | 427 (18.0%) |
| College/Associate Degree | 4,196 (82.2%) | 906 (17.8%) |
| Bachelor's Degree or higher | 2,021 (85.3%) | 348 (14.7%) |
Occupancy by Age of Householder in Graham
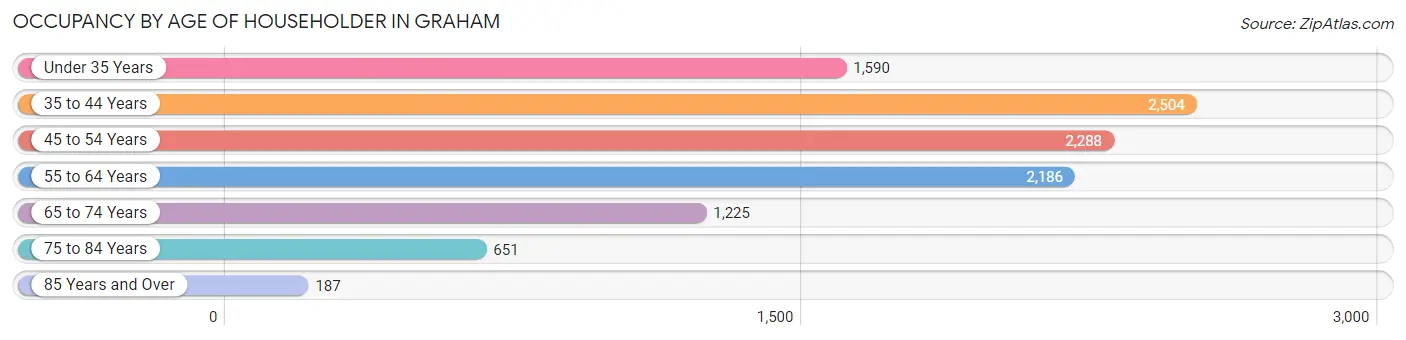
| Age Bracket | # Households | % Households |
| Under 35 Years | 1,590 | 15.0% |
| 35 to 44 Years | 2,504 | 23.5% |
| 45 to 54 Years | 2,288 | 21.5% |
| 55 to 64 Years | 2,186 | 20.6% |
| 65 to 74 Years | 1,225 | 11.5% |
| 75 to 84 Years | 651 | 6.1% |
| 85 Years and Over | 187 | 1.8% |
| Total | 10,631 | 100.0% |
Housing Finances in Graham
Median Income by Occupancy in Graham
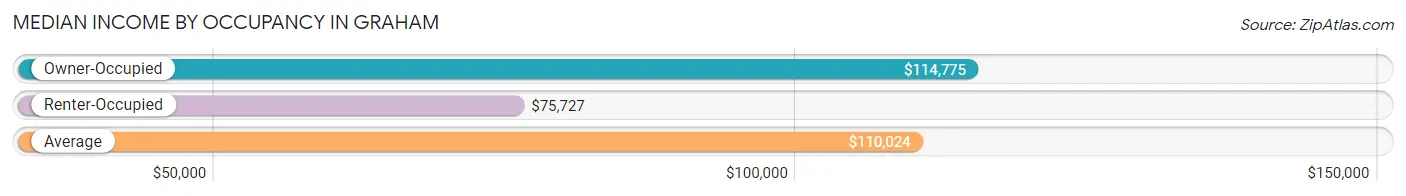
| Occupancy Type | # Households | Median Income |
| Owner-Occupied | 8,770 (82.5%) | $114,775 |
| Renter-Occupied | 1,861 (17.5%) | $75,727 |
| Average | 10,631 (100.0%) | $110,024 |
Occupancy by Householder Income Bracket in Graham
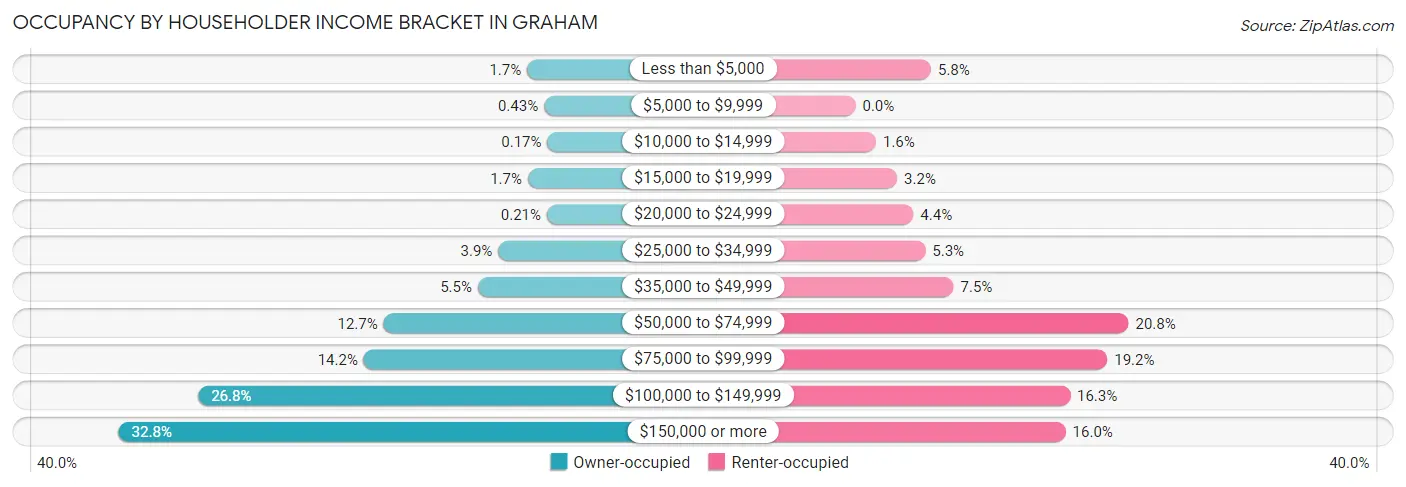
| Income Bracket | Owner-occupied | Renter-occupied |
| Less than $5,000 | 151 (1.7%) | 107 (5.8%) |
| $5,000 to $9,999 | 38 (0.4%) | 0 (0.0%) |
| $10,000 to $14,999 | 15 (0.2%) | 29 (1.6%) |
| $15,000 to $19,999 | 146 (1.7%) | 59 (3.2%) |
| $20,000 to $24,999 | 18 (0.2%) | 82 (4.4%) |
| $25,000 to $34,999 | 344 (3.9%) | 99 (5.3%) |
| $35,000 to $49,999 | 480 (5.5%) | 139 (7.5%) |
| $50,000 to $74,999 | 1,109 (12.7%) | 387 (20.8%) |
| $75,000 to $99,999 | 1,242 (14.2%) | 357 (19.2%) |
| $100,000 to $149,999 | 2,348 (26.8%) | 304 (16.3%) |
| $150,000 or more | 2,879 (32.8%) | 298 (16.0%) |
| Total | 8,770 (100.0%) | 1,861 (100.0%) |
Monthly Housing Cost Tiers in Graham
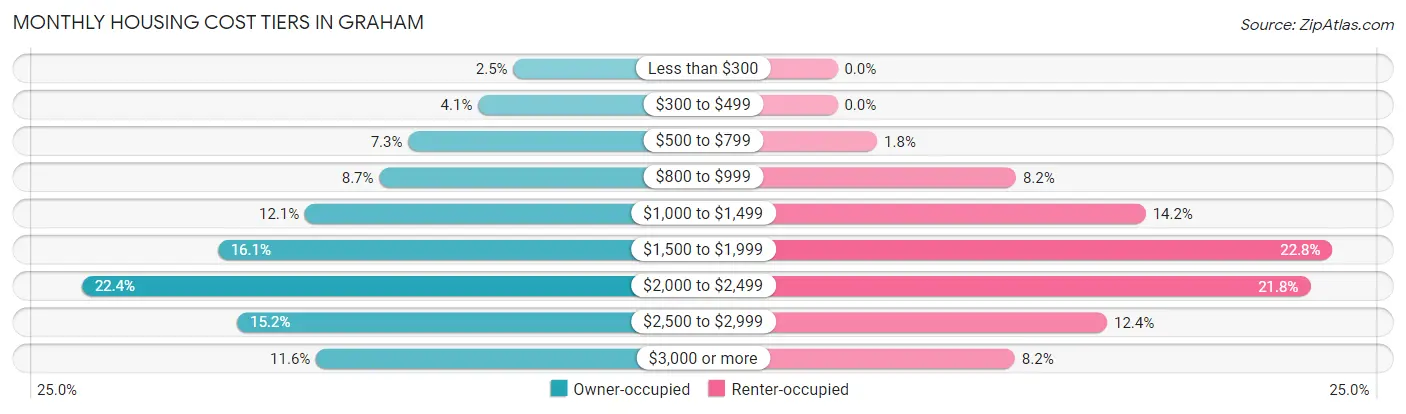
| Monthly Cost | Owner-occupied | Renter-occupied |
| Less than $300 | 219 (2.5%) | 0 (0.0%) |
| $300 to $499 | 361 (4.1%) | 0 (0.0%) |
| $500 to $799 | 644 (7.3%) | 34 (1.8%) |
| $800 to $999 | 760 (8.7%) | 153 (8.2%) |
| $1,000 to $1,499 | 1,060 (12.1%) | 264 (14.2%) |
| $1,500 to $1,999 | 1,413 (16.1%) | 424 (22.8%) |
| $2,000 to $2,499 | 1,962 (22.4%) | 405 (21.8%) |
| $2,500 to $2,999 | 1,335 (15.2%) | 231 (12.4%) |
| $3,000 or more | 1,016 (11.6%) | 152 (8.2%) |
| Total | 8,770 (100.0%) | 1,861 (100.0%) |
Physical Housing Characteristics in Graham
Housing Structures in Graham
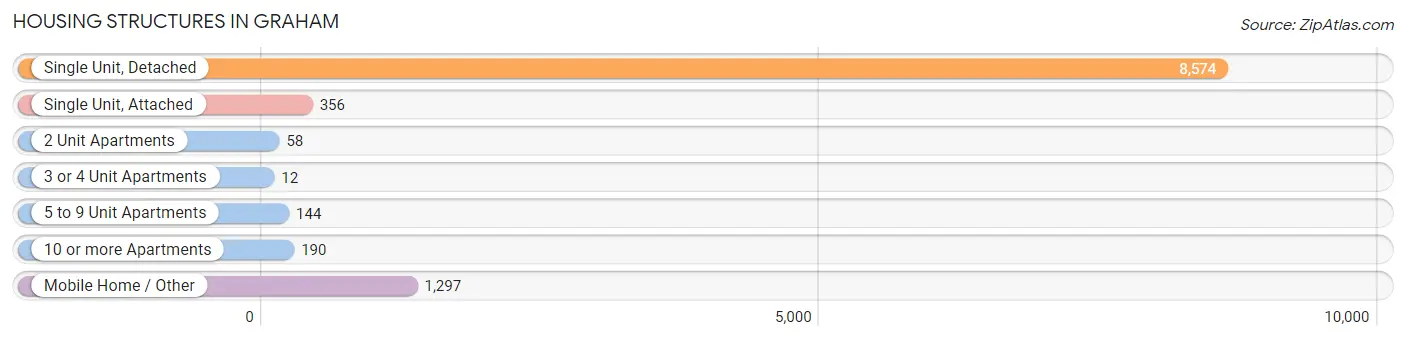
| Structure Type | # Housing Units | % Housing Units |
| Single Unit, Detached | 8,574 | 80.6% |
| Single Unit, Attached | 356 | 3.4% |
| 2 Unit Apartments | 58 | 0.5% |
| 3 or 4 Unit Apartments | 12 | 0.1% |
| 5 to 9 Unit Apartments | 144 | 1.3% |
| 10 or more Apartments | 190 | 1.8% |
| Mobile Home / Other | 1,297 | 12.2% |
| Total | 10,631 | 100.0% |
Housing Structures by Occupancy in Graham
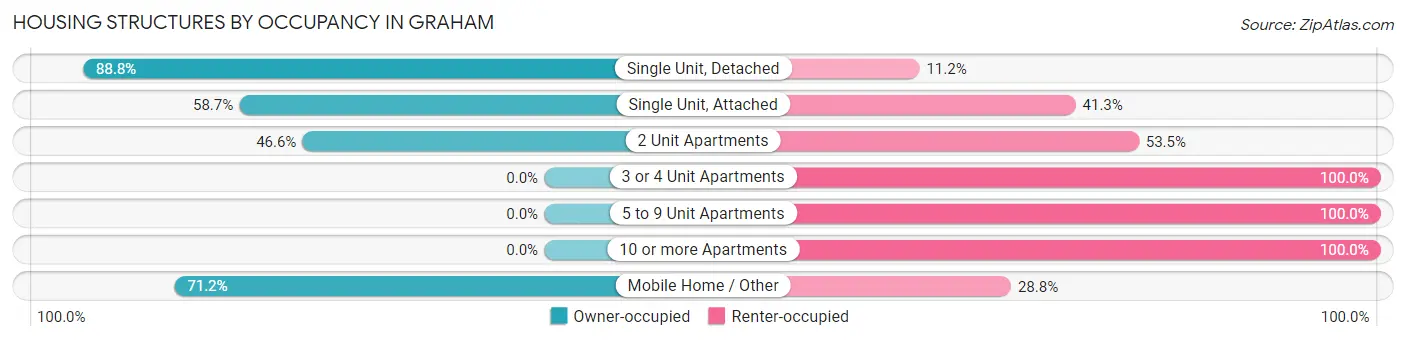
| Structure Type | Owner-occupied | Renter-occupied |
| Single Unit, Detached | 7,611 (88.8%) | 963 (11.2%) |
| Single Unit, Attached | 209 (58.7%) | 147 (41.3%) |
| 2 Unit Apartments | 27 (46.6%) | 31 (53.4%) |
| 3 or 4 Unit Apartments | 0 (0.0%) | 12 (100.0%) |
| 5 to 9 Unit Apartments | 0 (0.0%) | 144 (100.0%) |
| 10 or more Apartments | 0 (0.0%) | 190 (100.0%) |
| Mobile Home / Other | 923 (71.2%) | 374 (28.8%) |
| Total | 8,770 (82.5%) | 1,861 (17.5%) |
Housing Structures by Number of Rooms in Graham
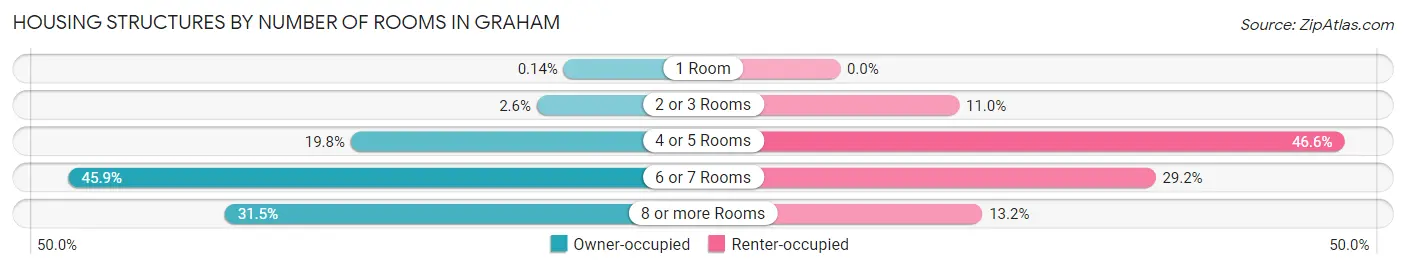
| Number of Rooms | Owner-occupied | Renter-occupied |
| 1 Room | 12 (0.1%) | 0 (0.0%) |
| 2 or 3 Rooms | 231 (2.6%) | 205 (11.0%) |
| 4 or 5 Rooms | 1,739 (19.8%) | 868 (46.6%) |
| 6 or 7 Rooms | 4,027 (45.9%) | 543 (29.2%) |
| 8 or more Rooms | 2,761 (31.5%) | 245 (13.2%) |
| Total | 8,770 (100.0%) | 1,861 (100.0%) |
Housing Structure by Heating Type in Graham
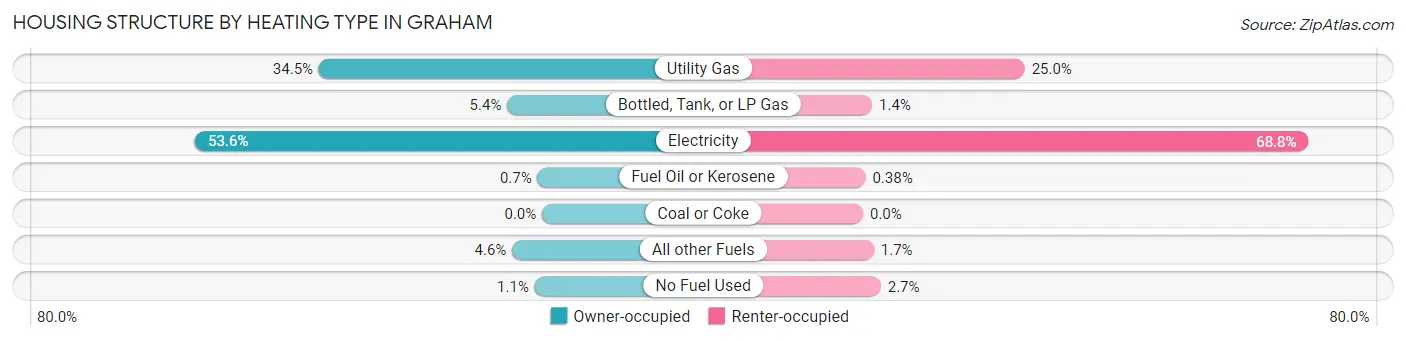
| Heating Type | Owner-occupied | Renter-occupied |
| Utility Gas | 3,026 (34.5%) | 465 (25.0%) |
| Bottled, Tank, or LP Gas | 473 (5.4%) | 26 (1.4%) |
| Electricity | 4,704 (53.6%) | 1,281 (68.8%) |
| Fuel Oil or Kerosene | 61 (0.7%) | 7 (0.4%) |
| Coal or Coke | 0 (0.0%) | 0 (0.0%) |
| All other Fuels | 406 (4.6%) | 31 (1.7%) |
| No Fuel Used | 100 (1.1%) | 51 (2.7%) |
| Total | 8,770 (100.0%) | 1,861 (100.0%) |
Household Vehicle Usage in Graham
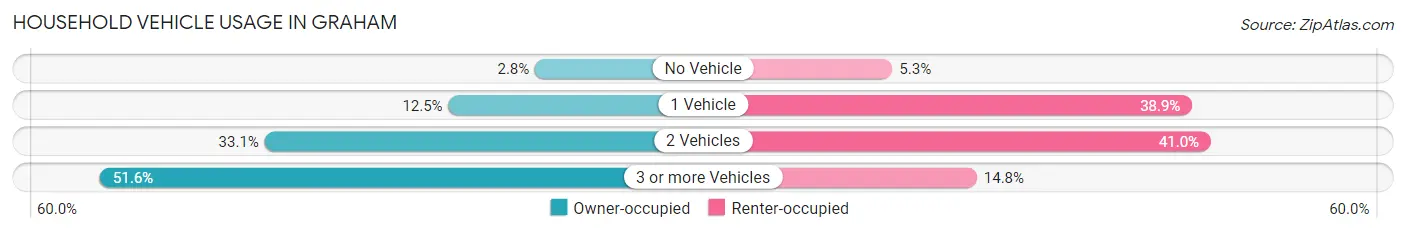
| Vehicles per Household | Owner-occupied | Renter-occupied |
| No Vehicle | 246 (2.8%) | 99 (5.3%) |
| 1 Vehicle | 1,098 (12.5%) | 724 (38.9%) |
| 2 Vehicles | 2,904 (33.1%) | 763 (41.0%) |
| 3 or more Vehicles | 4,522 (51.6%) | 275 (14.8%) |
| Total | 8,770 (100.0%) | 1,861 (100.0%) |
Real Estate & Mortgages in Graham
Real Estate and Mortgage Overview in Graham
| Characteristic | Without Mortgage | With Mortgage |
| Housing Units | 2,144 | 6,626 |
| Median Property Value | $394,400 | $438,400 |
| Median Household Income | $80,459 | $2,418 |
| Monthly Housing Costs | $803 | $1,016 |
| Real Estate Taxes | $4,288 | $181 |
Property Value by Mortgage Status in Graham
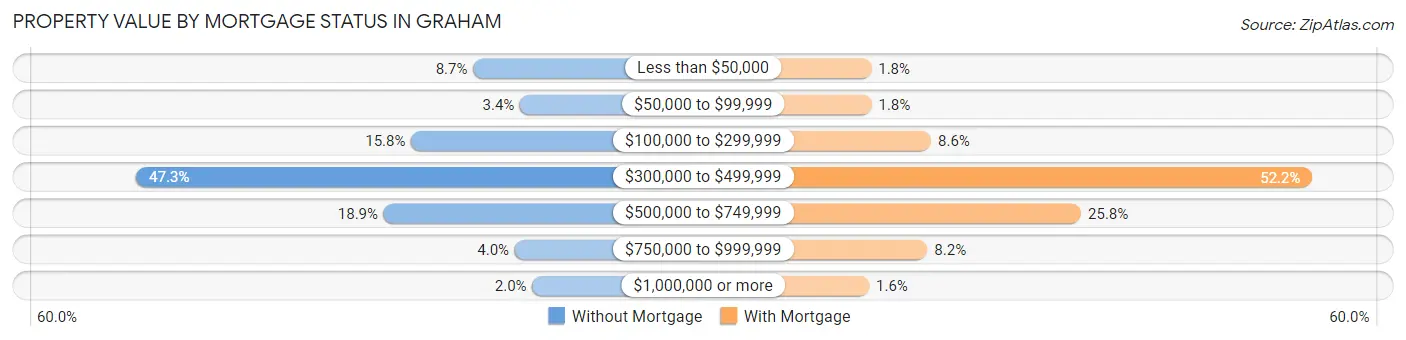
| Property Value | Without Mortgage | With Mortgage |
| Less than $50,000 | 187 (8.7%) | 119 (1.8%) |
| $50,000 to $99,999 | 72 (3.4%) | 121 (1.8%) |
| $100,000 to $299,999 | 339 (15.8%) | 572 (8.6%) |
| $300,000 to $499,999 | 1,013 (47.2%) | 3,459 (52.2%) |
| $500,000 to $749,999 | 406 (18.9%) | 1,708 (25.8%) |
| $750,000 to $999,999 | 85 (4.0%) | 544 (8.2%) |
| $1,000,000 or more | 42 (2.0%) | 103 (1.5%) |
| Total | 2,144 (100.0%) | 6,626 (100.0%) |
Household Income by Mortgage Status in Graham
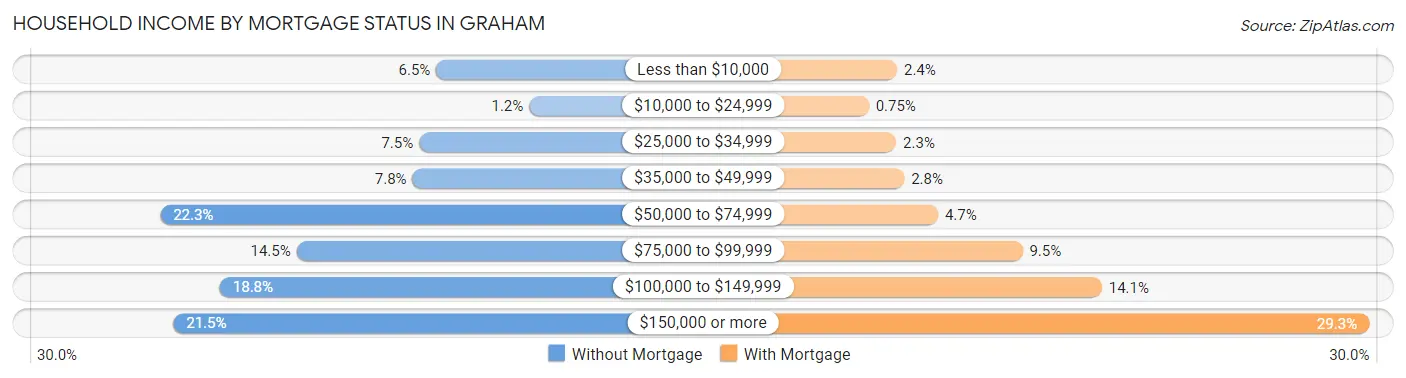
| Household Income | Without Mortgage | With Mortgage |
| Less than $10,000 | 139 (6.5%) | 157 (2.4%) |
| $10,000 to $24,999 | 25 (1.2%) | 50 (0.7%) |
| $25,000 to $34,999 | 160 (7.5%) | 154 (2.3%) |
| $35,000 to $49,999 | 168 (7.8%) | 184 (2.8%) |
| $50,000 to $74,999 | 477 (22.3%) | 312 (4.7%) |
| $75,000 to $99,999 | 310 (14.5%) | 632 (9.5%) |
| $100,000 to $149,999 | 404 (18.8%) | 932 (14.1%) |
| $150,000 or more | 461 (21.5%) | 1,944 (29.3%) |
| Total | 2,144 (100.0%) | 6,626 (100.0%) |
Property Value to Household Income Ratio in Graham
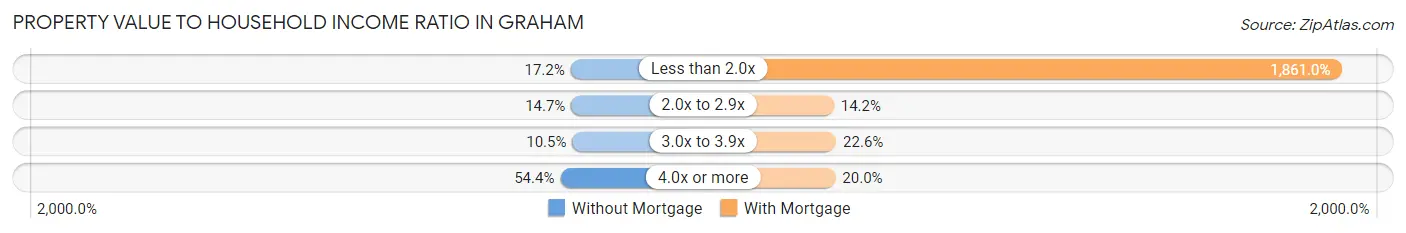
| Value-to-Income Ratio | Without Mortgage | With Mortgage |
| Less than 2.0x | 368 (17.2%) | 123,309 (1,861.0%) |
| 2.0x to 2.9x | 314 (14.6%) | 939 (14.2%) |
| 3.0x to 3.9x | 226 (10.5%) | 1,499 (22.6%) |
| 4.0x or more | 1,166 (54.4%) | 1,325 (20.0%) |
| Total | 2,144 (100.0%) | 6,626 (100.0%) |
Real Estate Taxes by Mortgage Status in Graham
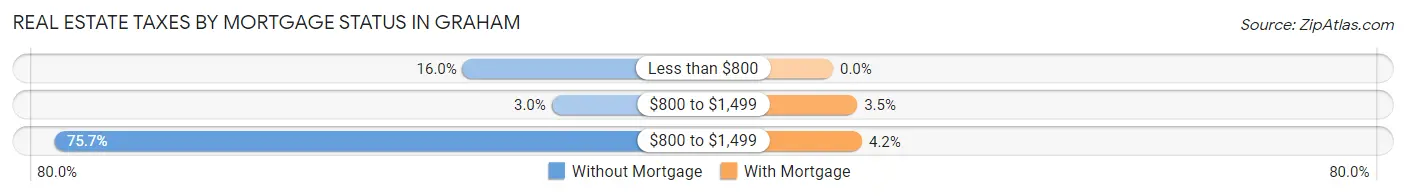
| Property Taxes | Without Mortgage | With Mortgage |
| Less than $800 | 343 (16.0%) | 0 (0.0%) |
| $800 to $1,499 | 64 (3.0%) | 234 (3.5%) |
| $800 to $1,499 | 1,623 (75.7%) | 281 (4.2%) |
| Total | 2,144 (100.0%) | 6,626 (100.0%) |
Health & Disability in Graham
Health Insurance Coverage by Age in Graham
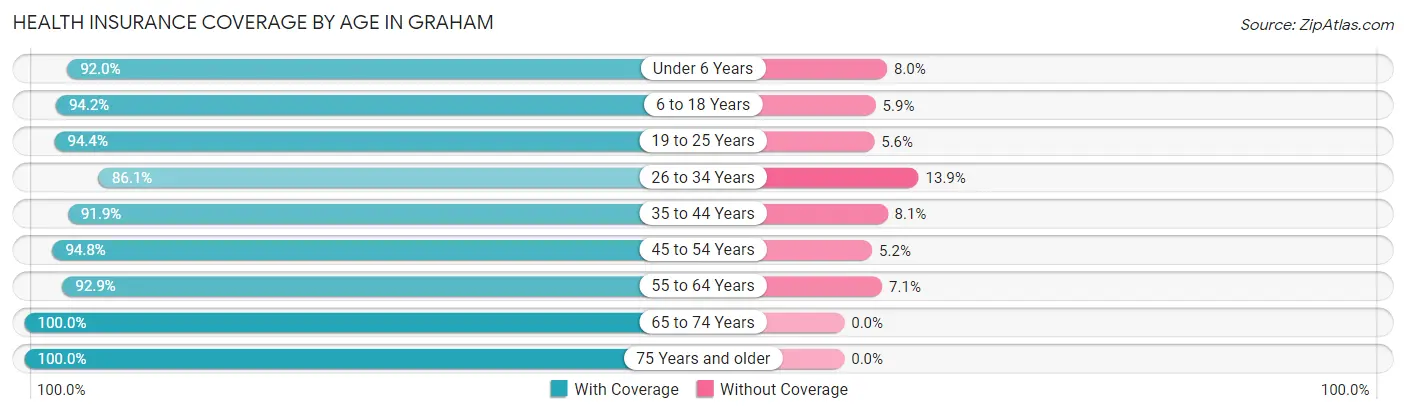
| Age Bracket | With Coverage | Without Coverage |
| Under 6 Years | 2,464 (92.0%) | 213 (8.0%) |
| 6 to 18 Years | 7,454 (94.2%) | 463 (5.9%) |
| 19 to 25 Years | 2,718 (94.4%) | 161 (5.6%) |
| 26 to 34 Years | 3,169 (86.1%) | 510 (13.9%) |
| 35 to 44 Years | 4,400 (91.9%) | 387 (8.1%) |
| 45 to 54 Years | 4,285 (94.8%) | 235 (5.2%) |
| 55 to 64 Years | 3,911 (92.9%) | 297 (7.1%) |
| 65 to 74 Years | 2,302 (100.0%) | 0 (0.0%) |
| 75 Years and older | 1,501 (100.0%) | 0 (0.0%) |
| Total | 32,204 (93.4%) | 2,266 (6.6%) |
Health Insurance Coverage by Citizenship Status in Graham
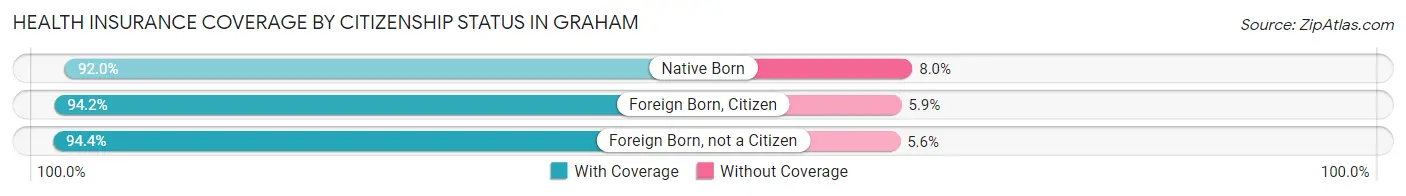
| Citizenship Status | With Coverage | Without Coverage |
| Native Born | 2,464 (92.0%) | 213 (8.0%) |
| Foreign Born, Citizen | 7,454 (94.2%) | 463 (5.9%) |
| Foreign Born, not a Citizen | 2,718 (94.4%) | 161 (5.6%) |
Health Insurance Coverage by Household Income in Graham
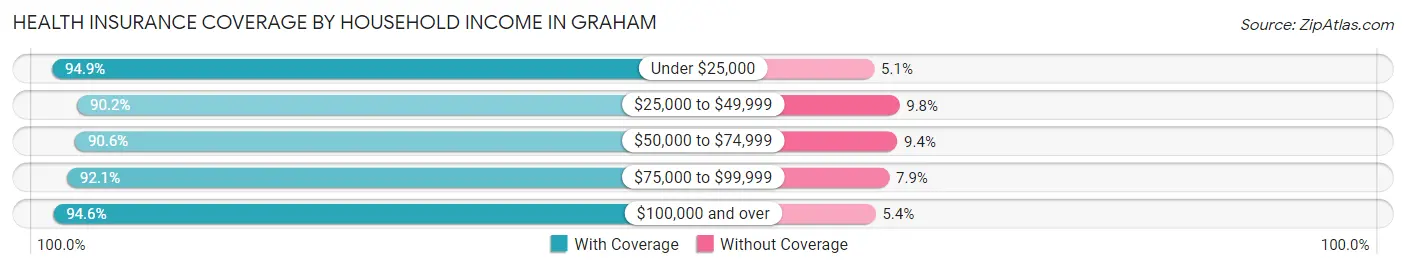
| Household Income | With Coverage | Without Coverage |
| Under $25,000 | 961 (94.9%) | 52 (5.1%) |
| $25,000 to $49,999 | 2,054 (90.2%) | 224 (9.8%) |
| $50,000 to $74,999 | 4,278 (90.6%) | 446 (9.4%) |
| $75,000 to $99,999 | 4,543 (92.1%) | 391 (7.9%) |
| $100,000 and over | 20,293 (94.6%) | 1,152 (5.4%) |
Public vs Private Health Insurance Coverage by Age in Graham
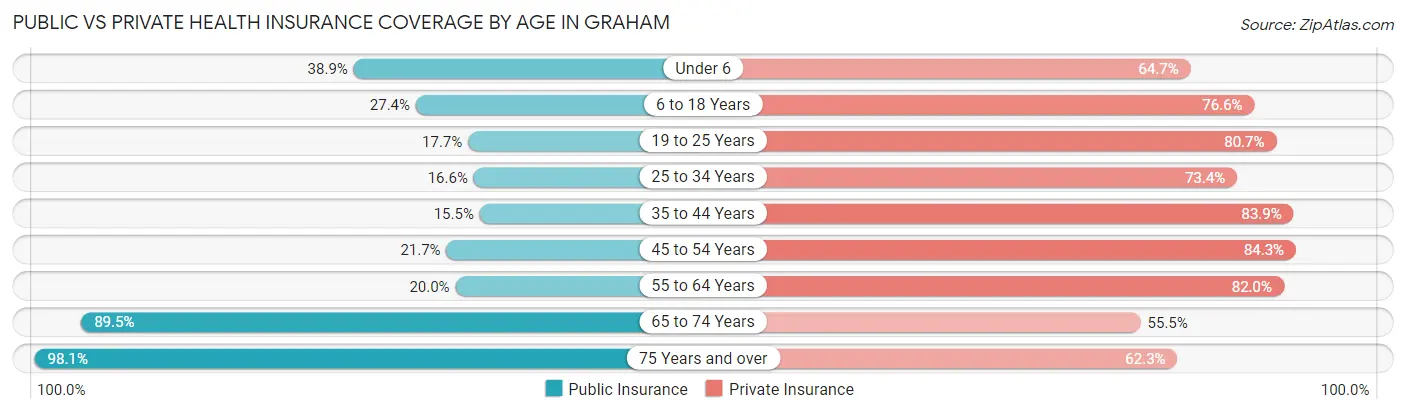
| Age Bracket | Public Insurance | Private Insurance |
| Under 6 | 1,042 (38.9%) | 1,733 (64.7%) |
| 6 to 18 Years | 2,168 (27.4%) | 6,063 (76.6%) |
| 19 to 25 Years | 509 (17.7%) | 2,322 (80.6%) |
| 25 to 34 Years | 612 (16.6%) | 2,700 (73.4%) |
| 35 to 44 Years | 743 (15.5%) | 4,014 (83.9%) |
| 45 to 54 Years | 981 (21.7%) | 3,810 (84.3%) |
| 55 to 64 Years | 843 (20.0%) | 3,452 (82.0%) |
| 65 to 74 Years | 2,060 (89.5%) | 1,277 (55.5%) |
| 75 Years and over | 1,473 (98.1%) | 935 (62.3%) |
| Total | 10,431 (30.3%) | 26,306 (76.3%) |
Disability Status by Sex by Age in Graham
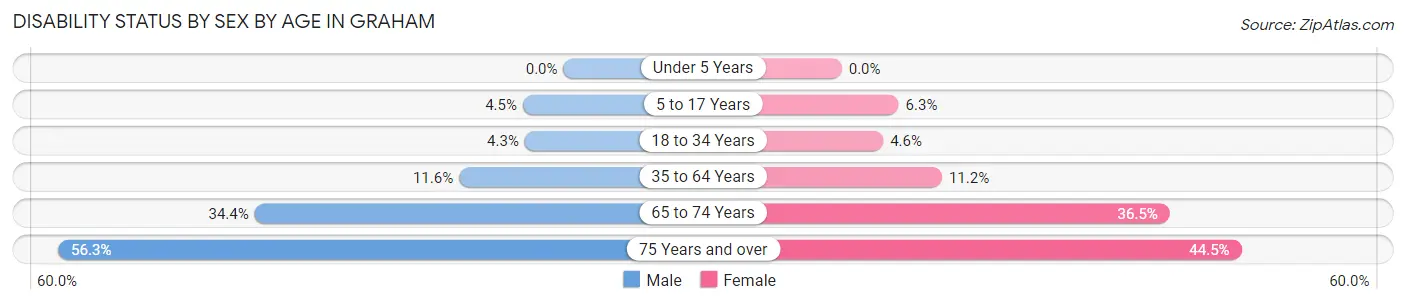
| Age Bracket | Male | Female |
| Under 5 Years | 0 (0.0%) | 0 (0.0%) |
| 5 to 17 Years | 186 (4.5%) | 231 (6.3%) |
| 18 to 34 Years | 165 (4.3%) | 146 (4.6%) |
| 35 to 64 Years | 798 (11.6%) | 742 (11.2%) |
| 65 to 74 Years | 445 (34.4%) | 368 (36.5%) |
| 75 Years and over | 359 (56.3%) | 384 (44.5%) |
Disability Class by Sex by Age in Graham
Disability Class: Hearing Difficulty
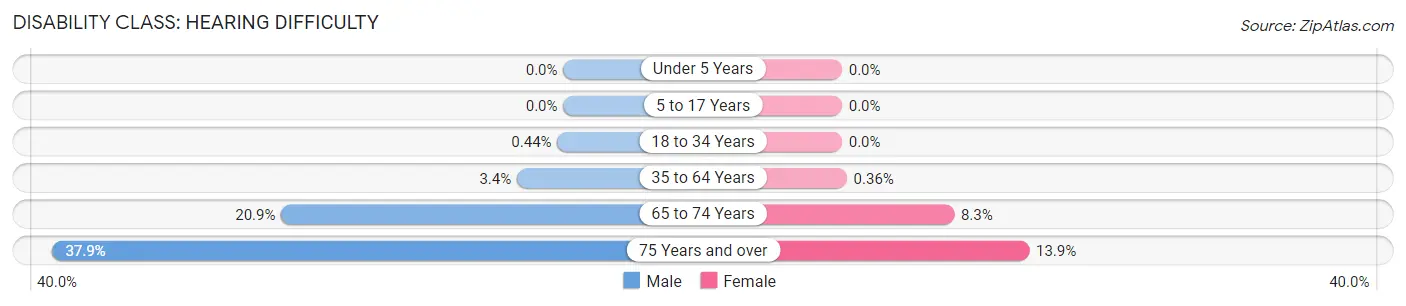
| Age Bracket | Male | Female |
| Under 5 Years | 0 (0.0%) | 0 (0.0%) |
| 5 to 17 Years | 0 (0.0%) | 0 (0.0%) |
| 18 to 34 Years | 17 (0.4%) | 0 (0.0%) |
| 35 to 64 Years | 236 (3.4%) | 24 (0.4%) |
| 65 to 74 Years | 271 (20.9%) | 84 (8.3%) |
| 75 Years and over | 242 (37.9%) | 120 (13.9%) |
Disability Class: Vision Difficulty
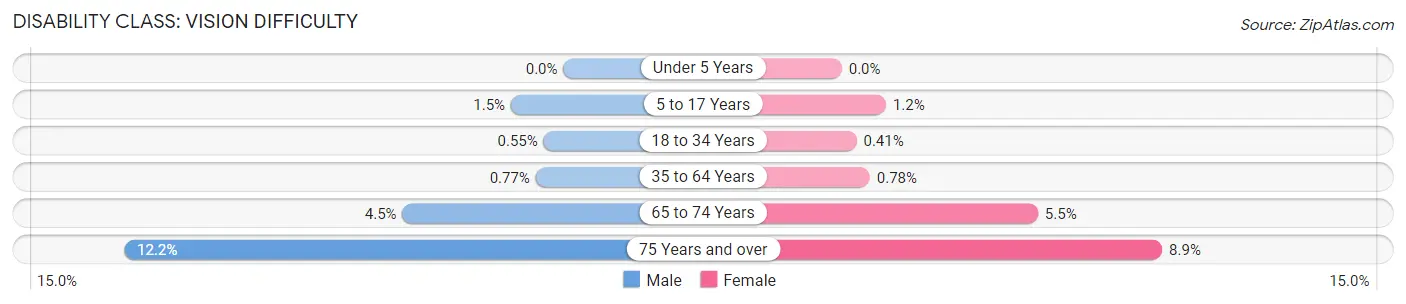
| Age Bracket | Male | Female |
| Under 5 Years | 0 (0.0%) | 0 (0.0%) |
| 5 to 17 Years | 60 (1.5%) | 45 (1.2%) |
| 18 to 34 Years | 21 (0.5%) | 13 (0.4%) |
| 35 to 64 Years | 53 (0.8%) | 52 (0.8%) |
| 65 to 74 Years | 58 (4.5%) | 55 (5.5%) |
| 75 Years and over | 78 (12.2%) | 77 (8.9%) |
Disability Class: Cognitive Difficulty
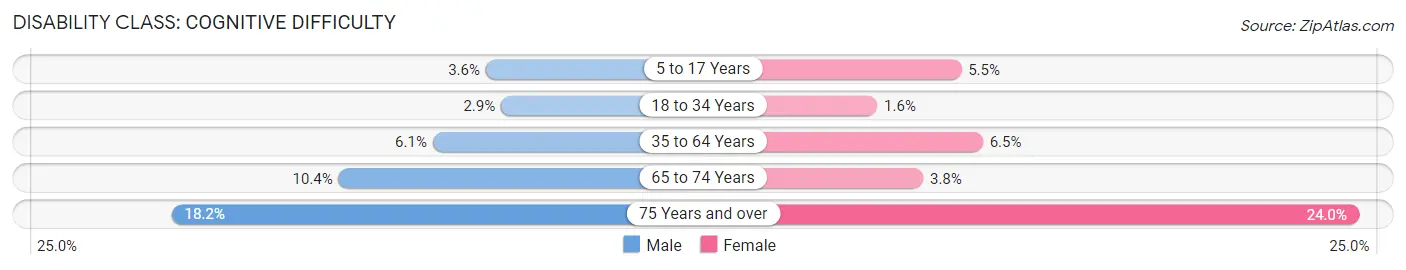
| Age Bracket | Male | Female |
| 5 to 17 Years | 148 (3.6%) | 202 (5.5%) |
| 18 to 34 Years | 111 (2.9%) | 52 (1.6%) |
| 35 to 64 Years | 416 (6.1%) | 435 (6.5%) |
| 65 to 74 Years | 135 (10.4%) | 38 (3.8%) |
| 75 Years and over | 116 (18.2%) | 207 (24.0%) |
Disability Class: Ambulatory Difficulty
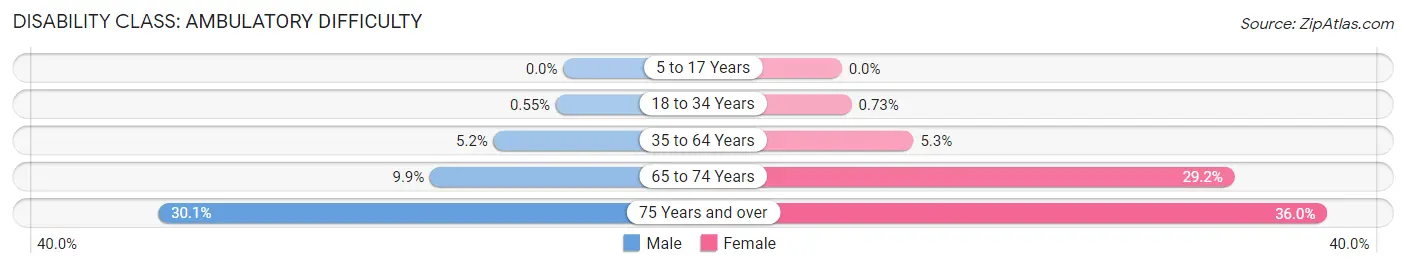
| Age Bracket | Male | Female |
| 5 to 17 Years | 0 (0.0%) | 0 (0.0%) |
| 18 to 34 Years | 21 (0.5%) | 23 (0.7%) |
| 35 to 64 Years | 355 (5.2%) | 354 (5.3%) |
| 65 to 74 Years | 128 (9.9%) | 294 (29.2%) |
| 75 Years and over | 192 (30.1%) | 311 (36.0%) |
Disability Class: Self-Care Difficulty
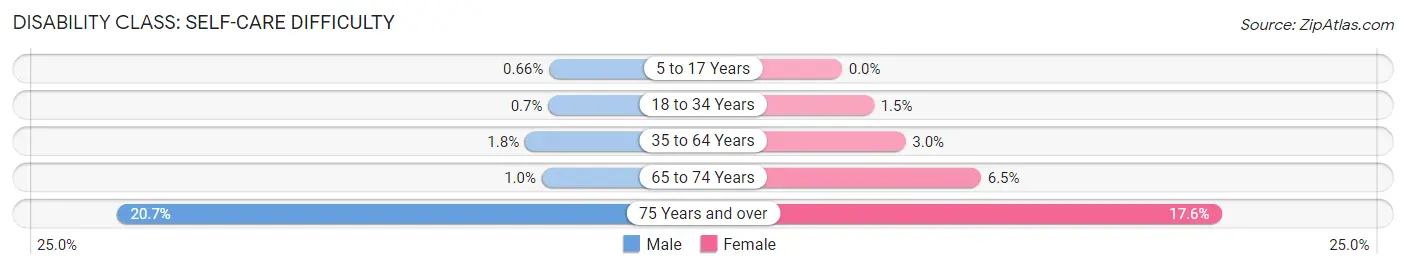
| Age Bracket | Male | Female |
| 5 to 17 Years | 27 (0.7%) | 0 (0.0%) |
| 18 to 34 Years | 27 (0.7%) | 47 (1.5%) |
| 35 to 64 Years | 122 (1.8%) | 196 (2.9%) |
| 65 to 74 Years | 13 (1.0%) | 65 (6.5%) |
| 75 Years and over | 132 (20.7%) | 152 (17.6%) |
Technology Access in Graham
Computing Device Access in Graham
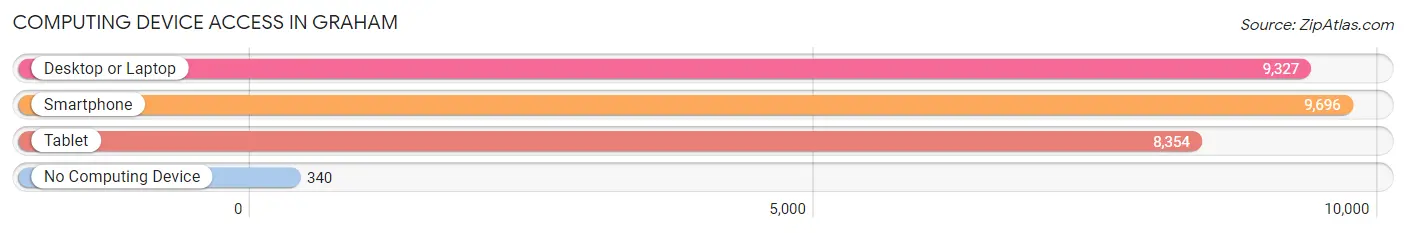
| Device Type | # Households | % Households |
| Desktop or Laptop | 9,327 | 87.7% |
| Smartphone | 9,696 | 91.2% |
| Tablet | 8,354 | 78.6% |
| No Computing Device | 340 | 3.2% |
| Total | 10,631 | 100.0% |
Internet Access in Graham
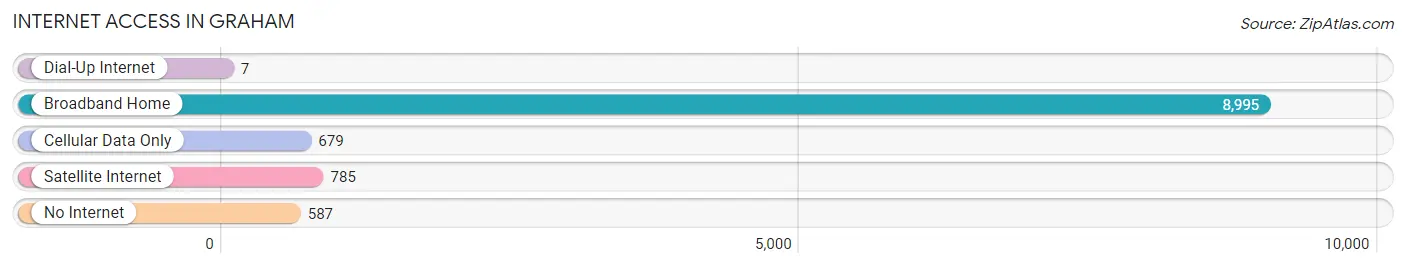
| Internet Type | # Households | % Households |
| Dial-Up Internet | 7 | 0.1% |
| Broadband Home | 8,995 | 84.6% |
| Cellular Data Only | 679 | 6.4% |
| Satellite Internet | 785 | 7.4% |
| No Internet | 587 | 5.5% |
| Total | 10,631 | 100.0% |
Graham Summary
Graham is a small unincorporated community located in Pierce County, Washington. It is situated in the foothills of the Cascade Mountains, approximately 25 miles southeast of Tacoma and 40 miles northeast of Seattle. The population of Graham was estimated to be 8,717 in 2019.
History
The area that is now Graham was first settled in the late 1800s by homesteaders. The first post office was established in 1891 and the town was officially incorporated in 1909. The town was named after the Graham family, who were among the first settlers in the area.
The town of Graham was originally a farming and logging community. In the early 1900s, the town was home to several sawmills and a shingle mill. The town also had a general store, a blacksmith shop, and a hotel.
Geography
Graham is located in the foothills of the Cascade Mountains, approximately 25 miles southeast of Tacoma and 40 miles northeast of Seattle. The town is situated at an elevation of approximately 500 feet above sea level. The area is characterized by rolling hills and dense forests.
The climate in Graham is mild and temperate. Summers are warm and dry, while winters are cool and wet. The average annual temperature is approximately 50 degrees Fahrenheit.
Economy
The economy of Graham is largely based on agriculture and forestry. The town is home to several farms, which produce a variety of crops, including apples, cherries, and hay. The town is also home to several logging companies, which harvest timber from the surrounding forests.
In addition to agriculture and forestry, Graham is home to several small businesses, including restaurants, retail stores, and auto repair shops. The town is also home to a number of manufacturing companies, which produce a variety of products, including furniture, clothing, and electronics.
Demographics
As of 2019, the population of Graham was estimated to be 8,717. The population is predominantly white (90.3%), with small percentages of African American (2.2%), Asian (2.1%), and Hispanic (2.7%) residents. The median household income in Graham is $60,945, and the median home value is $269,400.
The town of Graham is served by the Bethel School District. The district operates four elementary schools, one middle school, and one high school. The town is also home to several private schools, including a Catholic school and a Christian school.
Common Questions
What is Per Capita Income in Graham?
Per Capita income in Graham is $38,959.
What is the Median Family Income in Graham?
Median Family Income in Graham is $111,527.
What is the Median Household income in Graham?
Median Household Income in Graham is $110,024.
What is Income or Wage Gap in Graham?
Income or Wage Gap in Graham is 36.9%.
Women in Graham earn 63.1 cents for every dollar earned by a man.
What is Inequality or Gini Index in Graham?
Inequality or Gini Index in Graham is 0.37.
What is the Total Population of Graham?
Total Population of Graham is 34,778.
What is the Total Male Population of Graham?
Total Male Population of Graham is 18,377.
What is the Total Female Population of Graham?
Total Female Population of Graham is 16,401.
What is the Ratio of Males per 100 Females in Graham?
There are 112.05 Males per 100 Females in Graham.
What is the Ratio of Females per 100 Males in Graham?
There are 89.25 Females per 100 Males in Graham.
What is the Median Population Age in Graham?
Median Population Age in Graham is 35.2 Years.
What is the Average Family Size in Graham
Average Family Size in Graham is 3.5 People.
What is the Average Household Size in Graham
Average Household Size in Graham is 3.3 People.
How Large is the Labor Force in Graham?
There are 17,336 People in the Labor Forcein in Graham.
What is the Percentage of People in the Labor Force in Graham?
67.2% of People are in the Labor Force in Graham.
What is the Unemployment Rate in Graham?
Unemployment Rate in Graham is 5.8%.