Steilacoom, WA Map & Demographics
Steilacoom Map
Steilacoom Overview
$48,678
PER CAPITA INCOME
$119,514
AVG FAMILY INCOME
$94,708
AVG HOUSEHOLD INCOME
20.6%
WAGE / INCOME GAP [ % ]
79.4¢/ $1
WAGE / INCOME GAP [ $ ]
0.40
INEQUALITY / GINI INDEX
6,680
TOTAL POPULATION
3,221
MALE POPULATION
3,459
FEMALE POPULATION
93.12
MALES / 100 FEMALES
107.39
FEMALES / 100 MALES
38.4
MEDIAN AGE
2.8
AVG FAMILY SIZE
2.4
AVG HOUSEHOLD SIZE
3,360
LABOR FORCE [ PEOPLE ]
61.5%
PERCENT IN LABOR FORCE
3.3%
UNEMPLOYMENT RATE
Steilacoom Zip Codes
Income in Steilacoom
Income Overview in Steilacoom
Per Capita Income in Steilacoom is $48,678, while median incomes of families and households are $119,514 and $94,708 respectively.
| Characteristic | Number | Measure |
| Per Capita Income | 6,680 | $48,678 |
| Median Family Income | 1,922 | $119,514 |
| Mean Family Income | 1,922 | $124,199 |
| Median Household Income | 2,778 | $94,708 |
| Mean Household Income | 2,778 | $117,040 |
| Income Deficit | 1,922 | $0 |
| Wage / Income Gap (%) | 6,680 | 20.60% |
| Wage / Income Gap ($) | 6,680 | 79.40¢ per $1 |
| Gini / Inequality Index | 6,680 | 0.40 |
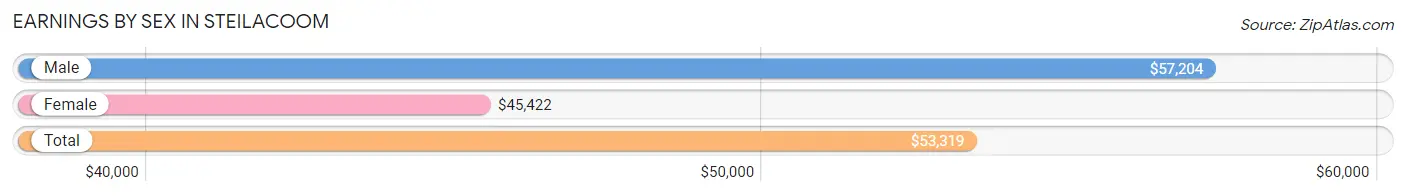
Earnings by Sex in Steilacoom
Average Earnings in Steilacoom are $53,319, $57,204 for men and $45,422 for women, a difference of 20.6%.
| Sex | Number | Average Earnings |
| Male | 2,083 (58.1%) | $57,204 |
| Female | 1,502 (41.9%) | $45,422 |
| Total | 3,585 (100.0%) | $53,319 |
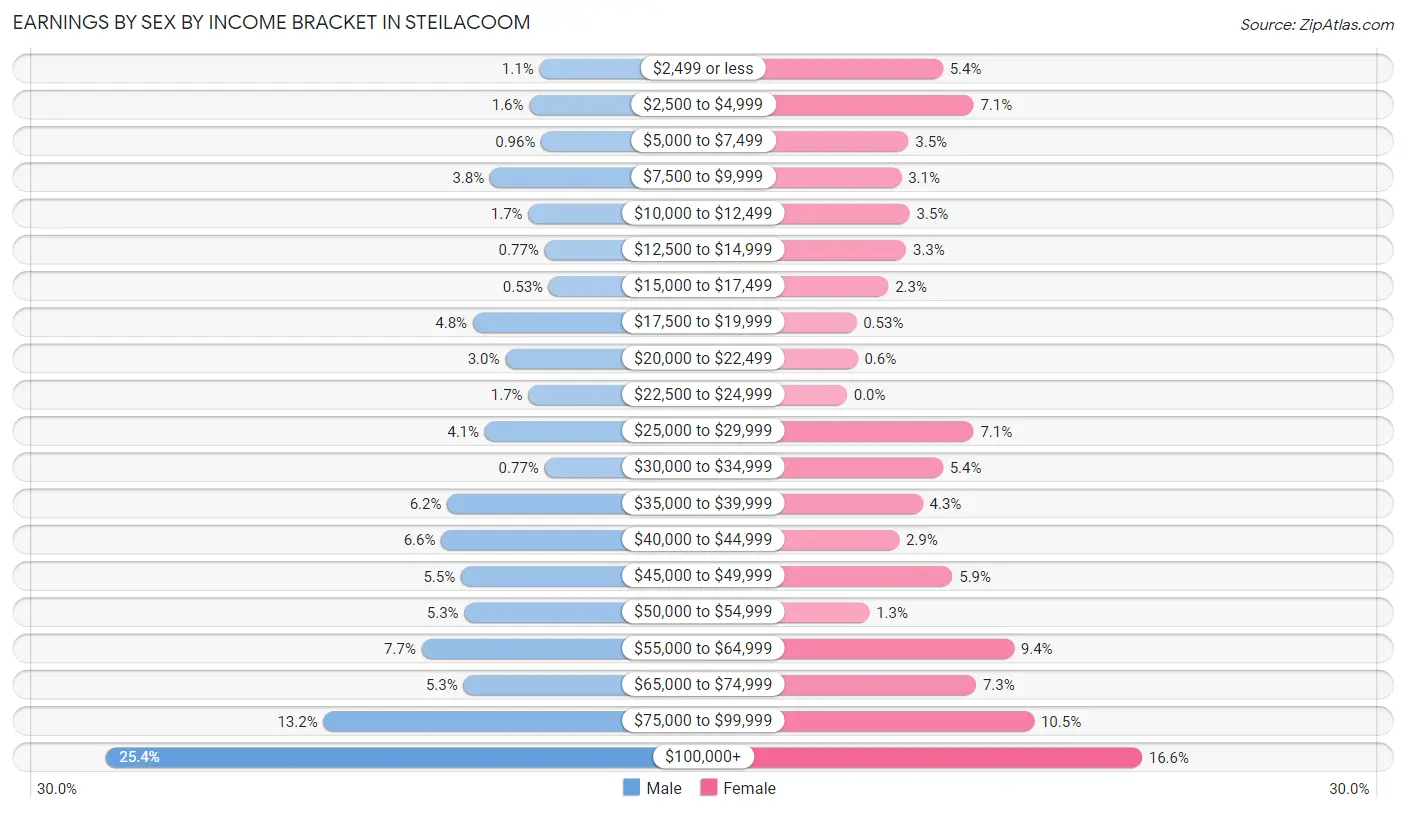
Earnings by Sex by Income Bracket in Steilacoom
The most common earnings brackets in Steilacoom are $100,000+ for men (529 | 25.4%) and $100,000+ for women (249 | 16.6%).
| Income | Male | Female |
| $2,499 or less | 22 (1.1%) | 81 (5.4%) |
| $2,500 to $4,999 | 34 (1.6%) | 107 (7.1%) |
| $5,000 to $7,499 | 20 (1.0%) | 52 (3.5%) |
| $7,500 to $9,999 | 80 (3.8%) | 46 (3.1%) |
| $10,000 to $12,499 | 35 (1.7%) | 53 (3.5%) |
| $12,500 to $14,999 | 16 (0.8%) | 50 (3.3%) |
| $15,000 to $17,499 | 11 (0.5%) | 35 (2.3%) |
| $17,500 to $19,999 | 100 (4.8%) | 8 (0.5%) |
| $20,000 to $22,499 | 62 (3.0%) | 9 (0.6%) |
| $22,500 to $24,999 | 35 (1.7%) | 0 (0.0%) |
| $25,000 to $29,999 | 86 (4.1%) | 107 (7.1%) |
| $30,000 to $34,999 | 16 (0.8%) | 81 (5.4%) |
| $35,000 to $39,999 | 130 (6.2%) | 64 (4.3%) |
| $40,000 to $44,999 | 137 (6.6%) | 44 (2.9%) |
| $45,000 to $49,999 | 114 (5.5%) | 89 (5.9%) |
| $50,000 to $54,999 | 110 (5.3%) | 19 (1.3%) |
| $55,000 to $64,999 | 160 (7.7%) | 141 (9.4%) |
| $65,000 to $74,999 | 111 (5.3%) | 109 (7.3%) |
| $75,000 to $99,999 | 275 (13.2%) | 158 (10.5%) |
| $100,000+ | 529 (25.4%) | 249 (16.6%) |
| Total | 2,083 (100.0%) | 1,502 (100.0%) |
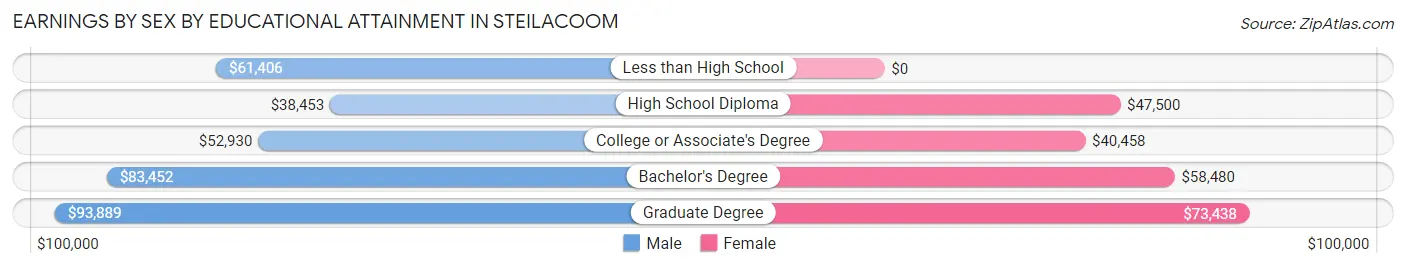
Earnings by Sex by Educational Attainment in Steilacoom
Average earnings in Steilacoom are $64,286 for men and $49,792 for women, a difference of 22.6%. Men with an educational attainment of graduate degree enjoy the highest average annual earnings of $93,889, while those with high school diploma education earn the least with $38,453. Women with an educational attainment of graduate degree earn the most with the average annual earnings of $73,438, while those with college or associate's degree education have the smallest earnings of $40,458.
| Educational Attainment | Male Income | Female Income |
| Less than High School | $61,406 | $0 |
| High School Diploma | $38,453 | $47,500 |
| College or Associate's Degree | $52,930 | $40,458 |
| Bachelor's Degree | $83,452 | $58,480 |
| Graduate Degree | $93,889 | $73,438 |
| Total | $64,286 | $49,792 |
Family Income in Steilacoom
Family Income Brackets in Steilacoom
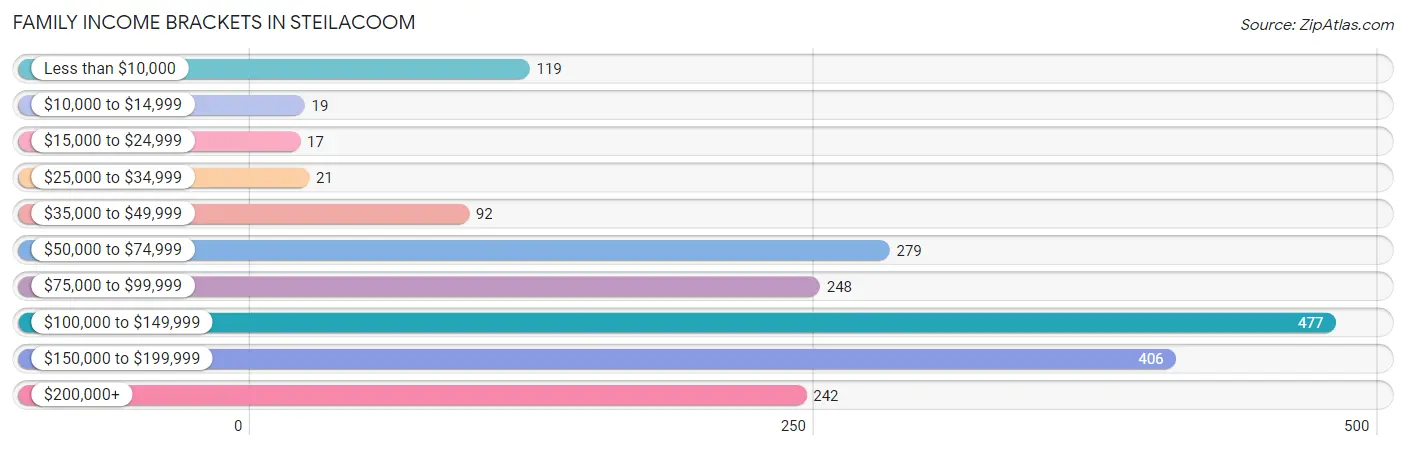
According to the Steilacoom family income data, there are 477 families falling into the $100,000 to $149,999 income range, which is the most common income bracket and makes up 24.8% of all families. Conversely, the $15,000 to $24,999 income bracket is the least frequent group with only 17 families (0.9%) belonging to this category.
| Income Bracket | # Families | % Families |
| Less than $10,000 | 119 | 6.2% |
| $10,000 to $14,999 | 19 | 1.0% |
| $15,000 to $24,999 | 17 | 0.9% |
| $25,000 to $34,999 | 21 | 1.1% |
| $35,000 to $49,999 | 92 | 4.8% |
| $50,000 to $74,999 | 279 | 14.5% |
| $75,000 to $99,999 | 248 | 12.9% |
| $100,000 to $149,999 | 477 | 24.8% |
| $150,000 to $199,999 | 406 | 21.1% |
| $200,000+ | 242 | 12.6% |
Family Income by Famaliy Size in Steilacoom
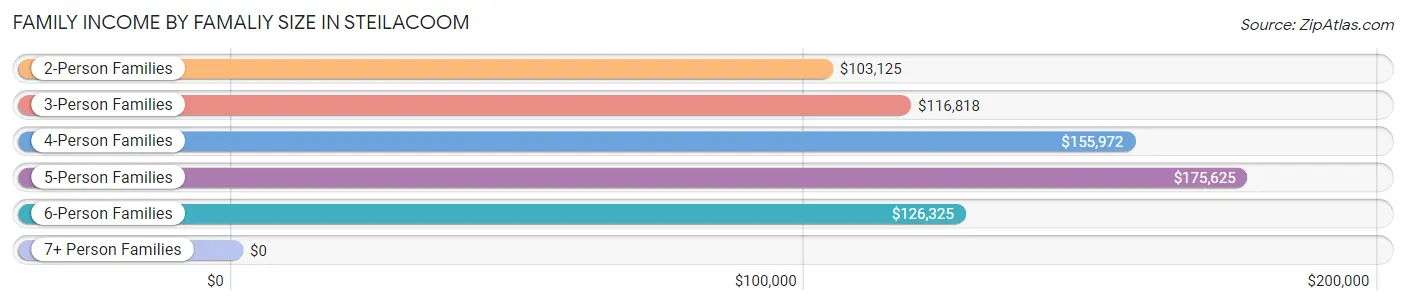
5-person families (66 | 3.4%) account for the highest median family income in Steilacoom with $175,625 per family, while 2-person families (1,146 | 59.6%) have the highest median income of $51,562 per family member.
| Income Bracket | # Families | Median Income |
| 2-Person Families | 1,146 (59.6%) | $103,125 |
| 3-Person Families | 316 (16.4%) | $116,818 |
| 4-Person Families | 297 (15.4%) | $155,972 |
| 5-Person Families | 66 (3.4%) | $175,625 |
| 6-Person Families | 73 (3.8%) | $126,325 |
| 7+ Person Families | 24 (1.3%) | $0 |
| Total | 1,922 (100.0%) | $119,514 |
Family Income by Number of Earners in Steilacoom
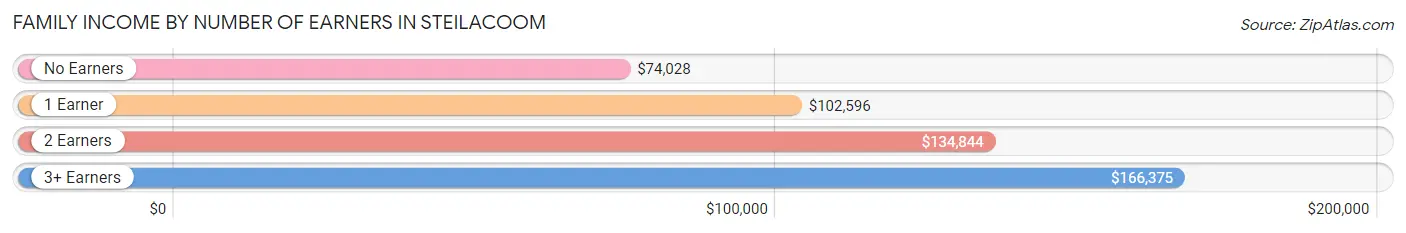
The median family income in Steilacoom is $119,514, with families comprising 3+ earners (74) having the highest median family income of $166,375, while families with no earners (283) have the lowest median family income of $74,028, accounting for 3.8% and 14.7% of families, respectively.
| Number of Earners | # Families | Median Income |
| No Earners | 283 (14.7%) | $74,028 |
| 1 Earner | 672 (35.0%) | $102,596 |
| 2 Earners | 893 (46.5%) | $134,844 |
| 3+ Earners | 74 (3.8%) | $166,375 |
| Total | 1,922 (100.0%) | $119,514 |
Household Income in Steilacoom
Household Income Brackets in Steilacoom
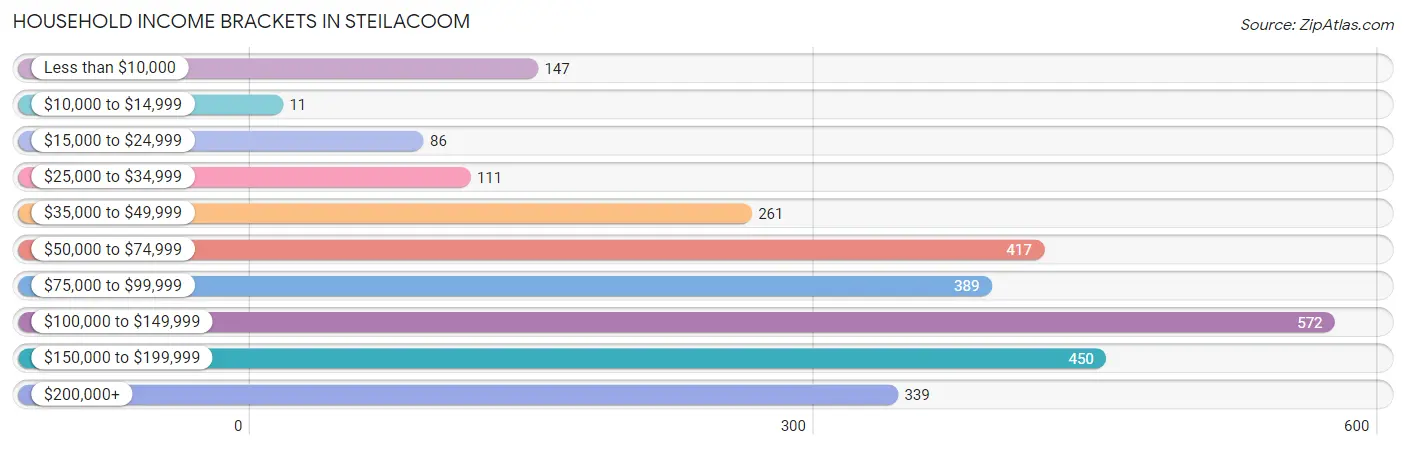
With 572 households falling in the category, the $100,000 to $149,999 income range is the most frequent in Steilacoom, accounting for 20.6% of all households. In contrast, only 11 households (0.4%) fall into the $10,000 to $14,999 income bracket, making it the least populous group.
| Income Bracket | # Households | % Households |
| Less than $10,000 | 147 | 5.3% |
| $10,000 to $14,999 | 11 | 0.4% |
| $15,000 to $24,999 | 86 | 3.1% |
| $25,000 to $34,999 | 111 | 4.0% |
| $35,000 to $49,999 | 261 | 9.4% |
| $50,000 to $74,999 | 417 | 15.0% |
| $75,000 to $99,999 | 389 | 14.0% |
| $100,000 to $149,999 | 572 | 20.6% |
| $150,000 to $199,999 | 450 | 16.2% |
| $200,000+ | 339 | 12.2% |
Household Income by Householder Age in Steilacoom
The median household income in Steilacoom is $94,708, with the highest median household income of $126,389 found in the 45 to 64 years age bracket for the primary householder. A total of 882 households (31.8%) fall into this category. Meanwhile, the 15 to 24 years age bracket for the primary householder has the lowest median household income of $0, with 201 households (7.2%) in this group.
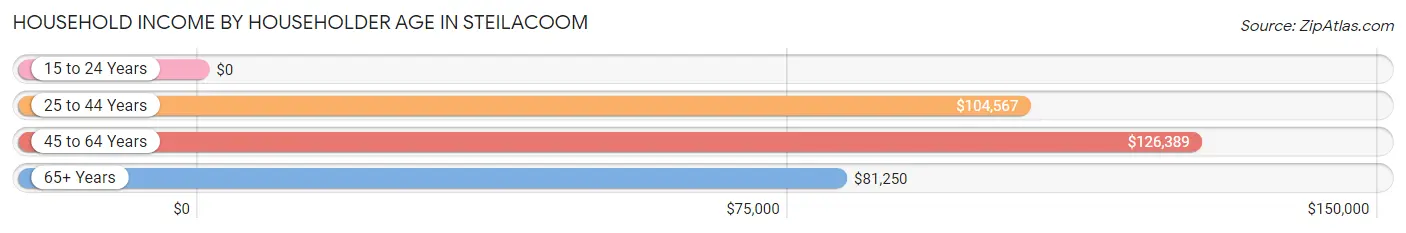
| Income Bracket | # Households | Median Income |
| 15 to 24 Years | 201 (7.2%) | $0 |
| 25 to 44 Years | 909 (32.7%) | $104,567 |
| 45 to 64 Years | 882 (31.8%) | $126,389 |
| 65+ Years | 786 (28.3%) | $81,250 |
| Total | 2,778 (100.0%) | $94,708 |
Poverty in Steilacoom
Income Below Poverty by Sex and Age in Steilacoom
With 6.2% poverty level for males and 11.7% for females among the residents of Steilacoom, 18 to 24 year old males and 18 to 24 year old females are the most vulnerable to poverty, with 96 males (29.6%) and 127 females (38.1%) in their respective age groups living below the poverty level.
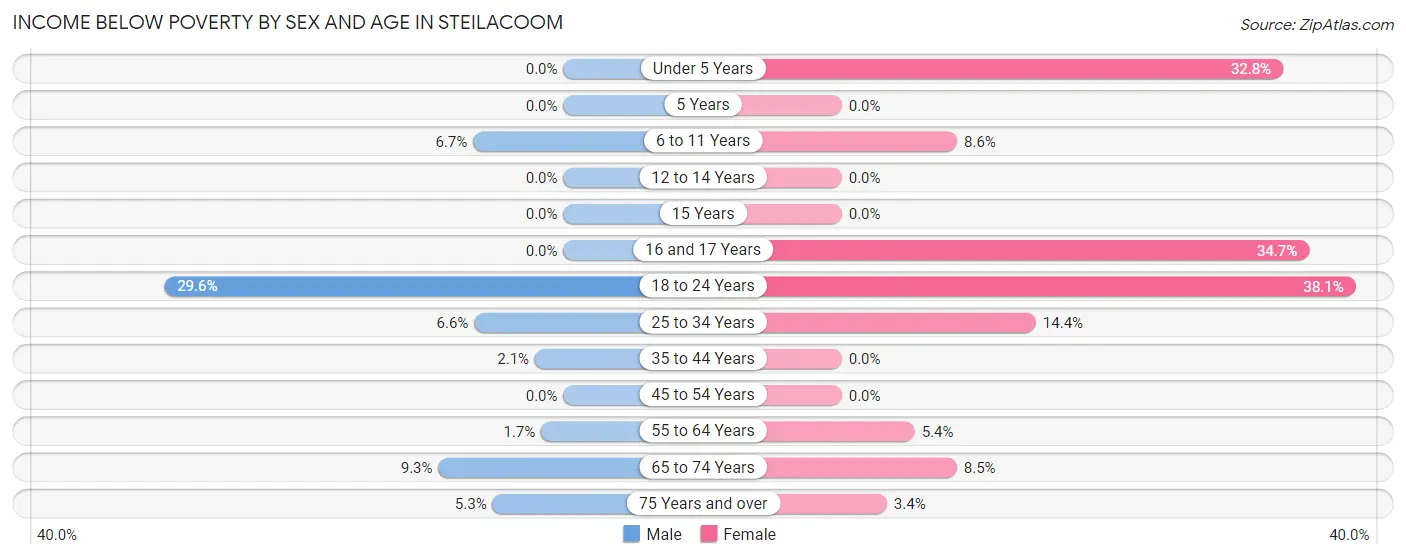
| Age Bracket | Male | Female |
| Under 5 Years | 0 (0.0%) | 93 (32.8%) |
| 5 Years | 0 (0.0%) | 0 (0.0%) |
| 6 to 11 Years | 15 (6.7%) | 22 (8.6%) |
| 12 to 14 Years | 0 (0.0%) | 0 (0.0%) |
| 15 Years | 0 (0.0%) | 0 (0.0%) |
| 16 and 17 Years | 0 (0.0%) | 17 (34.7%) |
| 18 to 24 Years | 96 (29.6%) | 127 (38.1%) |
| 25 to 34 Years | 26 (6.6%) | 67 (14.4%) |
| 35 to 44 Years | 12 (2.1%) | 0 (0.0%) |
| 45 to 54 Years | 0 (0.0%) | 0 (0.0%) |
| 55 to 64 Years | 7 (1.7%) | 27 (5.4%) |
| 65 to 74 Years | 36 (9.3%) | 41 (8.5%) |
| 75 Years and over | 9 (5.3%) | 9 (3.4%) |
| Total | 201 (6.2%) | 403 (11.7%) |
Income Above Poverty by Sex and Age in Steilacoom
According to the poverty statistics in Steilacoom, males aged under 5 years and females aged 5 years are the age groups that are most secure financially, with 100.0% of males and 100.0% of females in these age groups living above the poverty line.
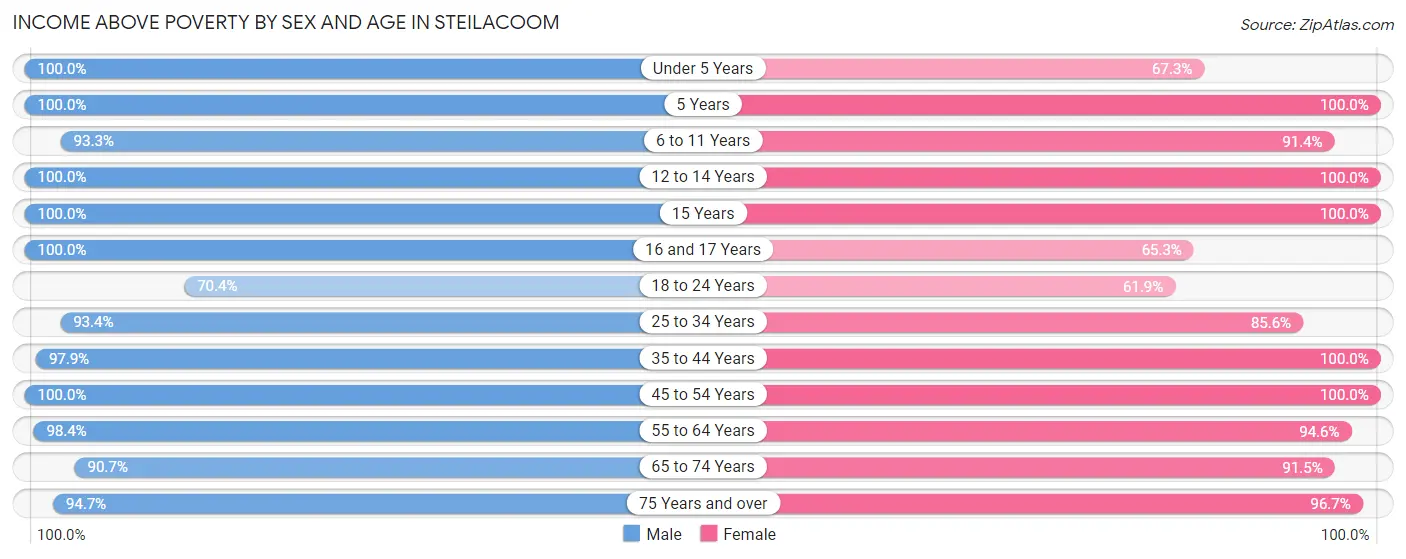
| Age Bracket | Male | Female |
| Under 5 Years | 186 (100.0%) | 191 (67.2%) |
| 5 Years | 20 (100.0%) | 66 (100.0%) |
| 6 to 11 Years | 209 (93.3%) | 235 (91.4%) |
| 12 to 14 Years | 64 (100.0%) | 76 (100.0%) |
| 15 Years | 17 (100.0%) | 22 (100.0%) |
| 16 and 17 Years | 38 (100.0%) | 32 (65.3%) |
| 18 to 24 Years | 228 (70.4%) | 206 (61.9%) |
| 25 to 34 Years | 367 (93.4%) | 398 (85.6%) |
| 35 to 44 Years | 558 (97.9%) | 378 (100.0%) |
| 45 to 54 Years | 403 (100.0%) | 282 (100.0%) |
| 55 to 64 Years | 416 (98.4%) | 471 (94.6%) |
| 65 to 74 Years | 352 (90.7%) | 439 (91.5%) |
| 75 Years and over | 162 (94.7%) | 260 (96.7%) |
| Total | 3,020 (93.8%) | 3,056 (88.3%) |
Income Below Poverty Among Married-Couple Families in Steilacoom
The poverty statistics for married-couple families in Steilacoom show that 1.4% or 20 of the total 1,435 families live below the poverty line. Families with 1 or 2 children have the highest poverty rate of 2.1%, comprising of 9 families. On the other hand, families with 3 or 4 children have the lowest poverty rate of 0.0%, which includes 0 families.
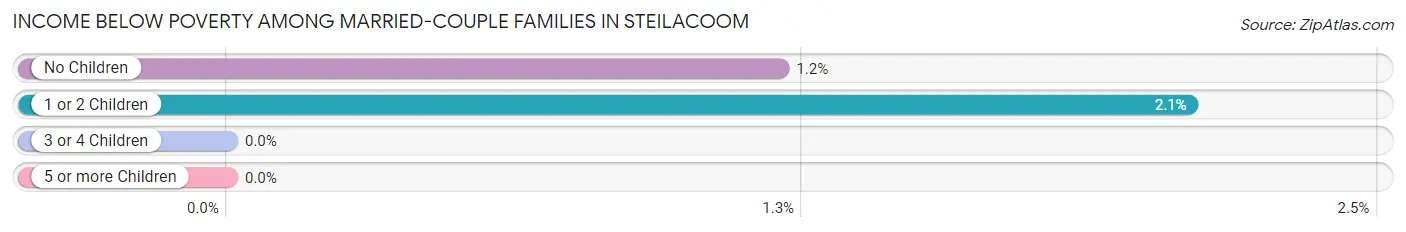
| Children | Above Poverty | Below Poverty |
| No Children | 909 (98.8%) | 11 (1.2%) |
| 1 or 2 Children | 421 (97.9%) | 9 (2.1%) |
| 3 or 4 Children | 67 (100.0%) | 0 (0.0%) |
| 5 or more Children | 18 (100.0%) | 0 (0.0%) |
| Total | 1,415 (98.6%) | 20 (1.4%) |
Income Below Poverty Among Single-Parent Households in Steilacoom
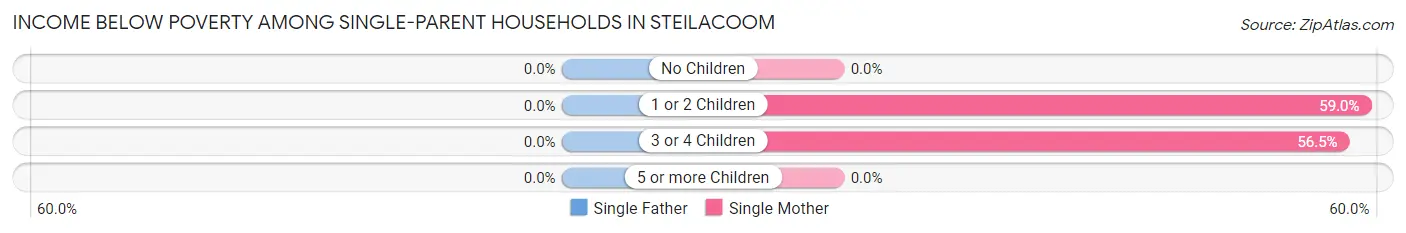
| Children | Single Father | Single Mother |
| No Children | 0 (0.0%) | 0 (0.0%) |
| 1 or 2 Children | 0 (0.0%) | 115 (59.0%) |
| 3 or 4 Children | 0 (0.0%) | 13 (56.5%) |
| 5 or more Children | 0 (0.0%) | 0 (0.0%) |
| Total | 0 (0.0%) | 128 (45.9%) |
Income Below Poverty Among Married-Couple vs Single-Parent Households in Steilacoom
The poverty data for Steilacoom shows that 20 of the married-couple family households (1.4%) and 128 of the single-parent households (26.3%) are living below the poverty level. Within the married-couple family households, those with 1 or 2 children have the highest poverty rate, with 9 households (2.1%) falling below the poverty line. Among the single-parent households, those with 3 or 4 children have the highest poverty rate, with 13 household (56.5%) living below poverty.
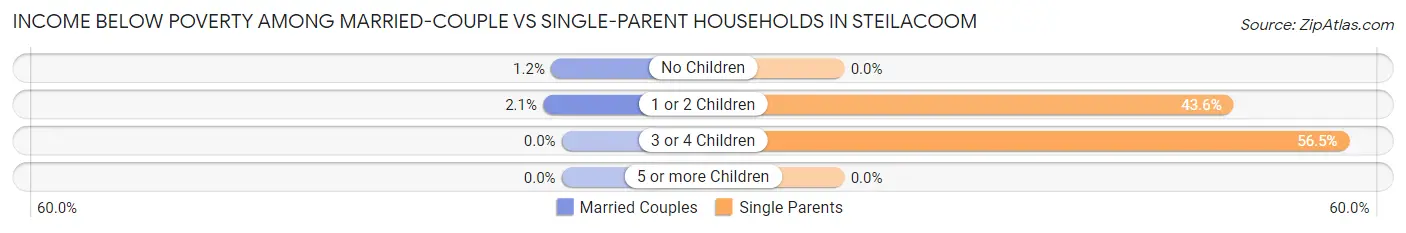
| Children | Married-Couple Families | Single-Parent Households |
| No Children | 11 (1.2%) | 0 (0.0%) |
| 1 or 2 Children | 9 (2.1%) | 115 (43.6%) |
| 3 or 4 Children | 0 (0.0%) | 13 (56.5%) |
| 5 or more Children | 0 (0.0%) | 0 (0.0%) |
| Total | 20 (1.4%) | 128 (26.3%) |
Race in Steilacoom
The most populous races in Steilacoom are White / Caucasian (4,767 | 71.4%), Hispanic or Latino (1,032 | 15.4%), and Two or more Races (892 | 13.4%).
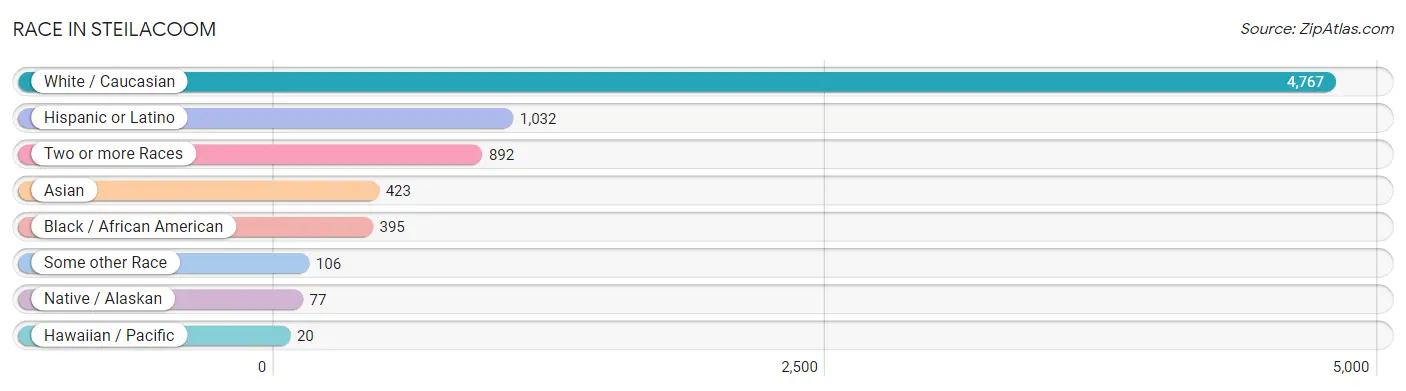
| Race | # Population | % Population |
| Asian | 423 | 6.3% |
| Black / African American | 395 | 5.9% |
| Hawaiian / Pacific | 20 | 0.3% |
| Hispanic or Latino | 1,032 | 15.4% |
| Native / Alaskan | 77 | 1.1% |
| White / Caucasian | 4,767 | 71.4% |
| Two or more Races | 892 | 13.4% |
| Some other Race | 106 | 1.6% |
| Total | 6,680 | 100.0% |
Ancestry in Steilacoom
The most populous ancestries reported in Steilacoom are German (1,484 | 22.2%), English (1,025 | 15.3%), Mexican (705 | 10.5%), Irish (700 | 10.5%), and French (283 | 4.2%), together accounting for 62.8% of all Steilacoom residents.
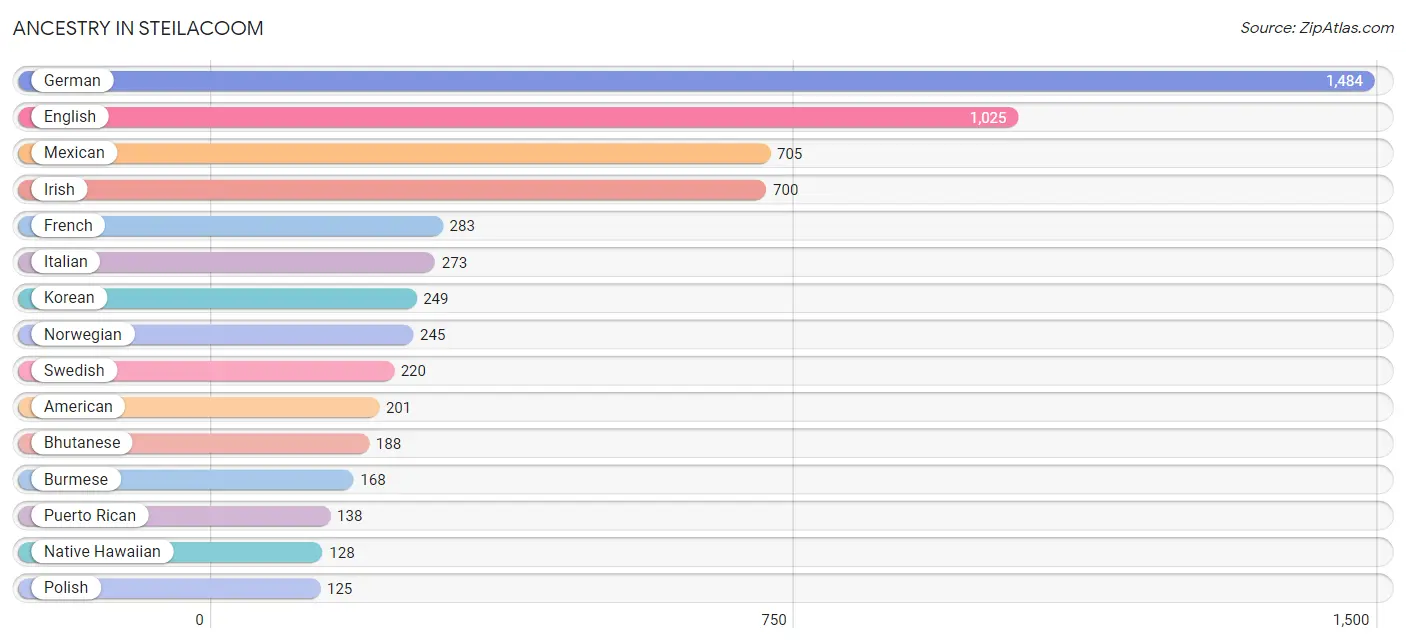
| Ancestry | # Population | % Population |
| African | 68 | 1.0% |
| American | 201 | 3.0% |
| Austrian | 19 | 0.3% |
| Bhutanese | 188 | 2.8% |
| Blackfeet | 34 | 0.5% |
| British | 112 | 1.7% |
| Burmese | 168 | 2.5% |
| Canadian | 20 | 0.3% |
| Central American | 40 | 0.6% |
| Cherokee | 31 | 0.5% |
| Choctaw | 6 | 0.1% |
| Colombian | 84 | 1.3% |
| Colville | 19 | 0.3% |
| Cuban | 28 | 0.4% |
| Czech | 37 | 0.5% |
| Danish | 64 | 1.0% |
| Dominican | 19 | 0.3% |
| Dutch | 48 | 0.7% |
| Eastern European | 107 | 1.6% |
| English | 1,025 | 15.3% |
| Estonian | 9 | 0.1% |
| Ethiopian | 5 | 0.1% |
| European | 53 | 0.8% |
| Finnish | 9 | 0.1% |
| French | 283 | 4.2% |
| French Canadian | 23 | 0.3% |
| German | 1,484 | 22.2% |
| Greek | 20 | 0.3% |
| Guamanian / Chamorro | 13 | 0.2% |
| Hungarian | 62 | 0.9% |
| Icelander | 9 | 0.1% |
| Indian (Asian) | 115 | 1.7% |
| Irish | 700 | 10.5% |
| Italian | 273 | 4.1% |
| Japanese | 29 | 0.4% |
| Kenyan | 68 | 1.0% |
| Korean | 249 | 3.7% |
| Laotian | 9 | 0.1% |
| Mexican | 705 | 10.5% |
| Native Hawaiian | 128 | 1.9% |
| Northern European | 9 | 0.1% |
| Norwegian | 245 | 3.7% |
| Panamanian | 5 | 0.1% |
| Polish | 125 | 1.9% |
| Portuguese | 24 | 0.4% |
| Puerto Rican | 138 | 2.1% |
| Puget Sound Salish | 48 | 0.7% |
| Romanian | 37 | 0.5% |
| Salvadoran | 35 | 0.5% |
| Samoan | 19 | 0.3% |
| Scandinavian | 69 | 1.0% |
| Scotch-Irish | 48 | 0.7% |
| Scottish | 122 | 1.8% |
| Slovak | 13 | 0.2% |
| South American | 84 | 1.3% |
| Sri Lankan | 61 | 0.9% |
| Subsaharan African | 98 | 1.5% |
| Swedish | 220 | 3.3% |
| Swiss | 17 | 0.3% |
| Thai | 48 | 0.7% |
| Tsimshian | 10 | 0.2% |
| Ukrainian | 16 | 0.2% |
| Welsh | 36 | 0.5% |
| West Indian | 27 | 0.4% | View All 64 Rows |
Immigrants in Steilacoom
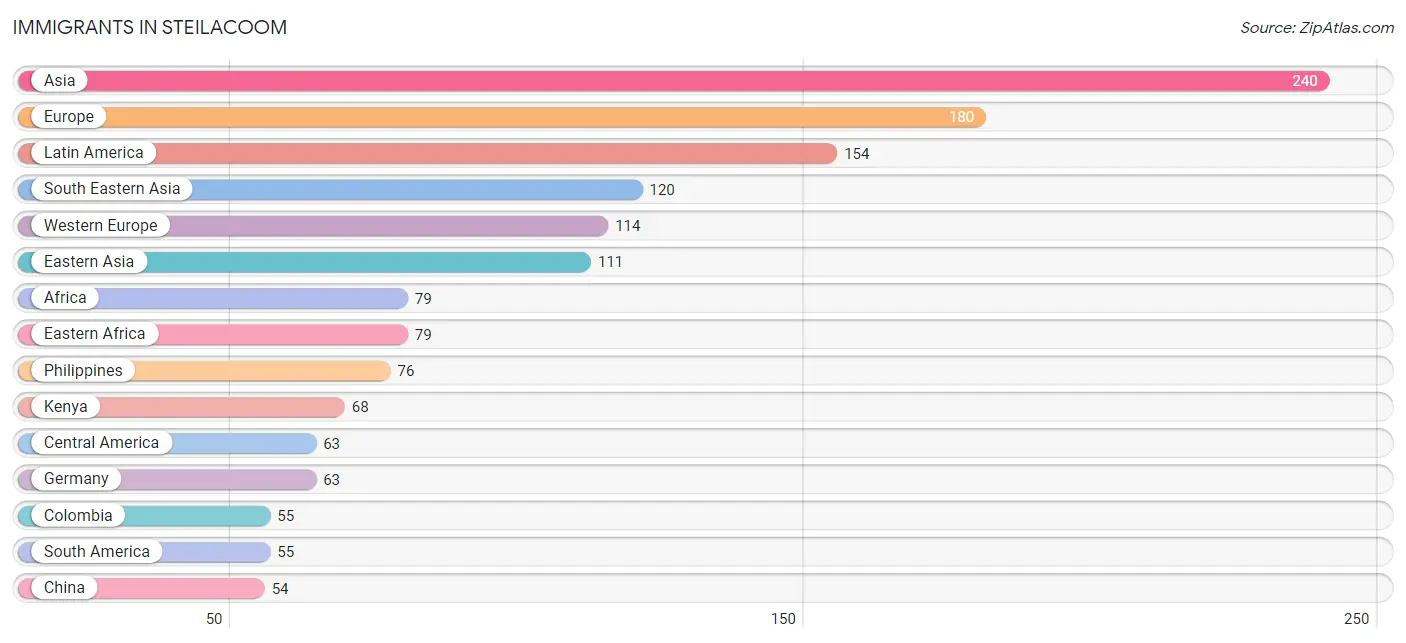
The most numerous immigrant groups reported in Steilacoom came from Asia (240 | 3.6%), Europe (180 | 2.7%), Latin America (154 | 2.3%), South Eastern Asia (120 | 1.8%), and Western Europe (114 | 1.7%), together accounting for 12.1% of all Steilacoom residents.
| Immigration Origin | # Population | % Population |
| Africa | 79 | 1.2% |
| Asia | 240 | 3.6% |
| Austria | 43 | 0.6% |
| Bulgaria | 20 | 0.3% |
| Canada | 9 | 0.1% |
| Caribbean | 36 | 0.5% |
| Central America | 63 | 0.9% |
| China | 54 | 0.8% |
| Colombia | 55 | 0.8% |
| Denmark | 4 | 0.1% |
| Eastern Africa | 79 | 1.2% |
| Eastern Asia | 111 | 1.7% |
| Eastern Europe | 36 | 0.5% |
| El Salvador | 11 | 0.2% |
| England | 12 | 0.2% |
| Europe | 180 | 2.7% |
| France | 8 | 0.1% |
| Germany | 63 | 0.9% |
| Hungary | 8 | 0.1% |
| India | 9 | 0.1% |
| Indonesia | 9 | 0.1% |
| Jamaica | 19 | 0.3% |
| Japan | 6 | 0.1% |
| Kenya | 68 | 1.0% |
| Korea | 51 | 0.8% |
| Latin America | 154 | 2.3% |
| Mexico | 47 | 0.7% |
| Northern Europe | 30 | 0.4% |
| Panama | 5 | 0.1% |
| Philippines | 76 | 1.1% |
| Romania | 8 | 0.1% |
| South America | 55 | 0.8% |
| South Central Asia | 9 | 0.1% |
| South Eastern Asia | 120 | 1.8% |
| Trinidad and Tobago | 17 | 0.3% |
| Vietnam | 35 | 0.5% |
| Western Europe | 114 | 1.7% | View All 37 Rows |
Sex and Age in Steilacoom
Sex and Age in Steilacoom
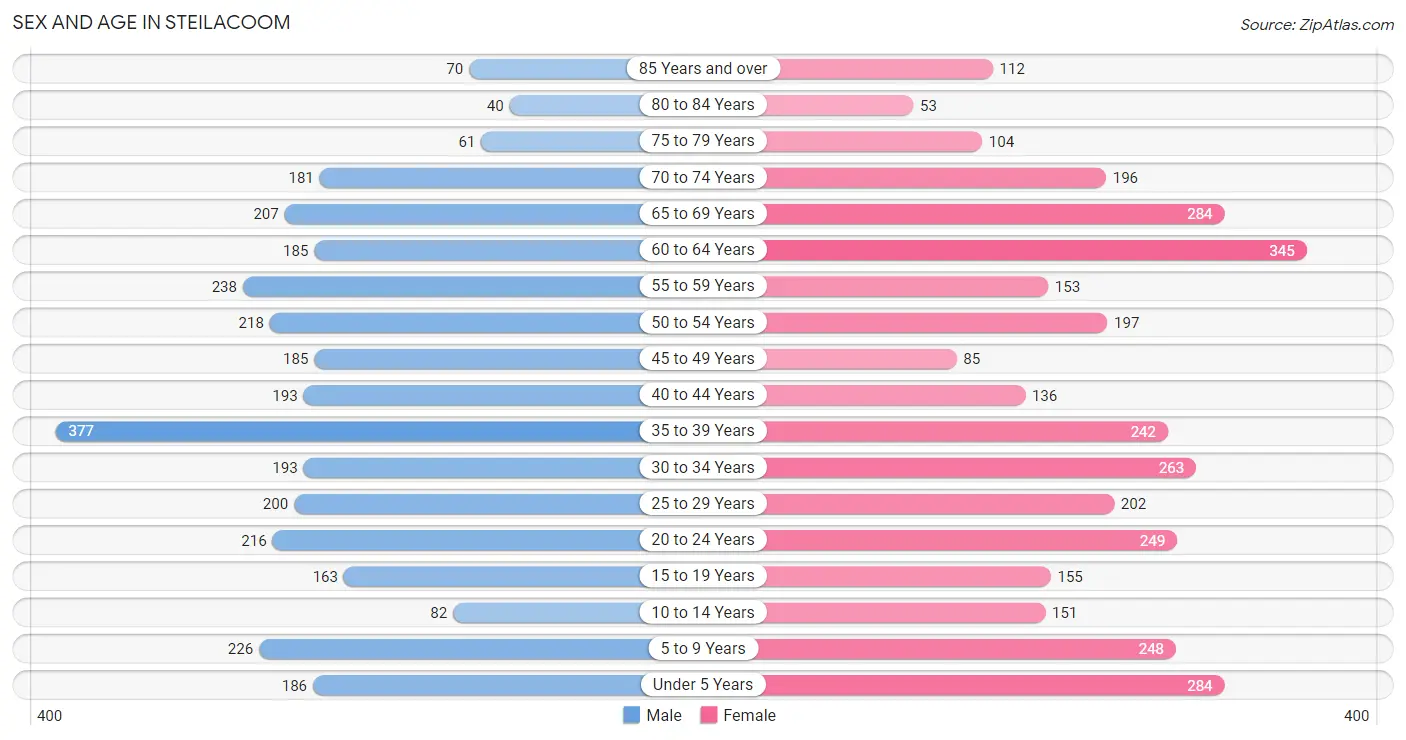
The most populous age groups in Steilacoom are 35 to 39 Years (377 | 11.7%) for men and 60 to 64 Years (345 | 10.0%) for women.
| Age Bracket | Male | Female |
| Under 5 Years | 186 (5.8%) | 284 (8.2%) |
| 5 to 9 Years | 226 (7.0%) | 248 (7.2%) |
| 10 to 14 Years | 82 (2.5%) | 151 (4.4%) |
| 15 to 19 Years | 163 (5.1%) | 155 (4.5%) |
| 20 to 24 Years | 216 (6.7%) | 249 (7.2%) |
| 25 to 29 Years | 200 (6.2%) | 202 (5.8%) |
| 30 to 34 Years | 193 (6.0%) | 263 (7.6%) |
| 35 to 39 Years | 377 (11.7%) | 242 (7.0%) |
| 40 to 44 Years | 193 (6.0%) | 136 (3.9%) |
| 45 to 49 Years | 185 (5.7%) | 85 (2.5%) |
| 50 to 54 Years | 218 (6.8%) | 197 (5.7%) |
| 55 to 59 Years | 238 (7.4%) | 153 (4.4%) |
| 60 to 64 Years | 185 (5.7%) | 345 (10.0%) |
| 65 to 69 Years | 207 (6.4%) | 284 (8.2%) |
| 70 to 74 Years | 181 (5.6%) | 196 (5.7%) |
| 75 to 79 Years | 61 (1.9%) | 104 (3.0%) |
| 80 to 84 Years | 40 (1.2%) | 53 (1.5%) |
| 85 Years and over | 70 (2.2%) | 112 (3.2%) |
| Total | 3,221 (100.0%) | 3,459 (100.0%) |
Families and Households in Steilacoom
Median Family Size in Steilacoom
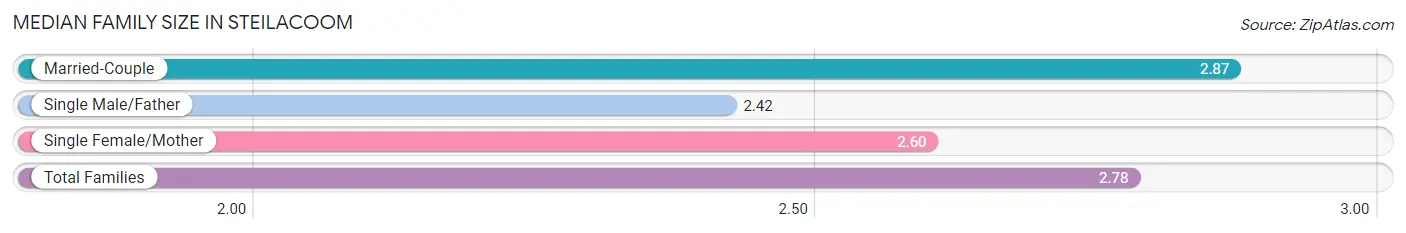
The median family size in Steilacoom is 2.78 persons per family, with married-couple families (1,435 | 74.7%) accounting for the largest median family size of 2.87 persons per family. On the other hand, single male/father families (208 | 10.8%) represent the smallest median family size with 2.42 persons per family.
| Family Type | # Families | Family Size |
| Married-Couple | 1,435 (74.7%) | 2.87 |
| Single Male/Father | 208 (10.8%) | 2.42 |
| Single Female/Mother | 279 (14.5%) | 2.60 |
| Total Families | 1,922 (100.0%) | 2.78 |
Median Household Size in Steilacoom
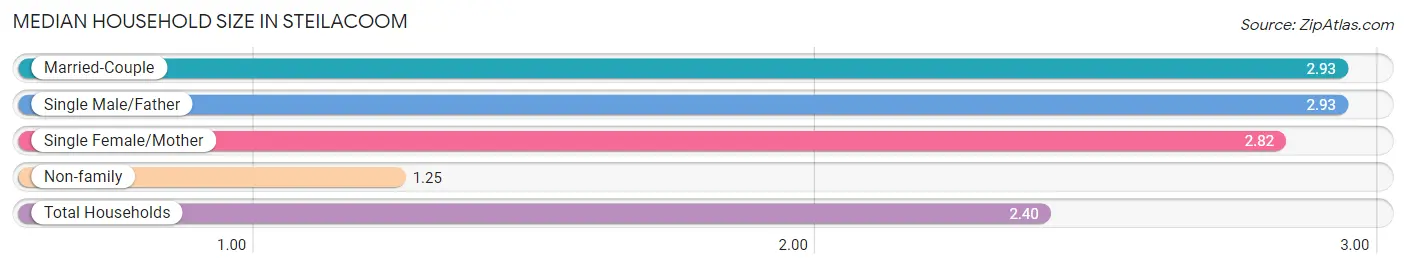
The median household size in Steilacoom is 2.40 persons per household, with married-couple households (1,435 | 51.7%) accounting for the largest median household size of 2.93 persons per household. non-family households (856 | 30.8%) represent the smallest median household size with 1.25 persons per household.
| Household Type | # Households | Household Size |
| Married-Couple | 1,435 (51.7%) | 2.93 |
| Single Male/Father | 208 (7.5%) | 2.93 |
| Single Female/Mother | 279 (10.0%) | 2.82 |
| Non-family | 856 (30.8%) | 1.25 |
| Total Households | 2,778 (100.0%) | 2.40 |
Household Size by Marriage Status in Steilacoom
Out of a total of 2,778 households in Steilacoom, 1,922 (69.2%) are family households, while 856 (30.8%) are nonfamily households. The most numerous type of family households are 2-person households, comprising 1,000, and the most common type of nonfamily households are 1-person households, comprising 705.
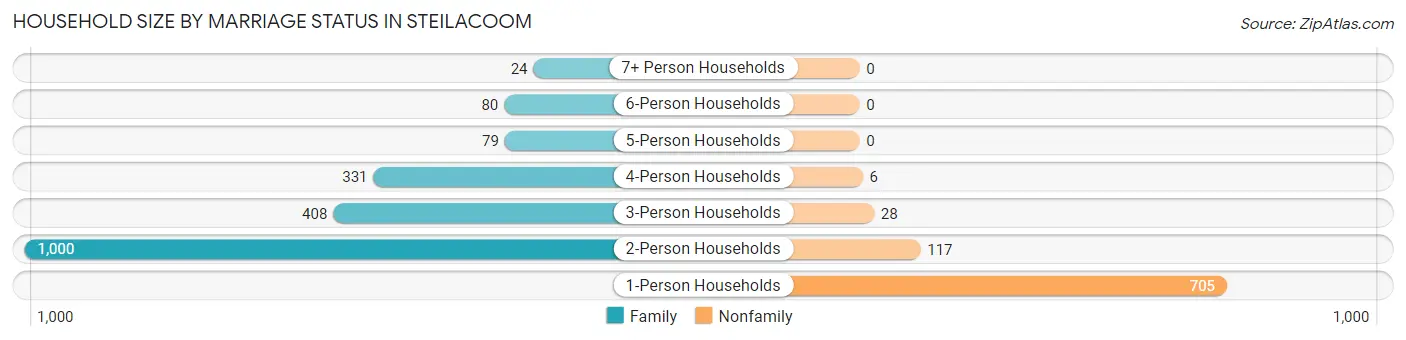
| Household Size | Family Households | Nonfamily Households |
| 1-Person Households | - | 705 (25.4%) |
| 2-Person Households | 1,000 (36.0%) | 117 (4.2%) |
| 3-Person Households | 408 (14.7%) | 28 (1.0%) |
| 4-Person Households | 331 (11.9%) | 6 (0.2%) |
| 5-Person Households | 79 (2.8%) | 0 (0.0%) |
| 6-Person Households | 80 (2.9%) | 0 (0.0%) |
| 7+ Person Households | 24 (0.9%) | 0 (0.0%) |
| Total | 1,922 (69.2%) | 856 (30.8%) |
Female Fertility in Steilacoom
Fertility by Age in Steilacoom
Average fertility rate in Steilacoom is 121.0 births per 1,000 women. Women in the age bracket of 20 to 34 years have the highest fertility rate with 221.0 births per 1,000 women. Women in the age bracket of 20 to 34 years acount for 90.8% of all women with births.
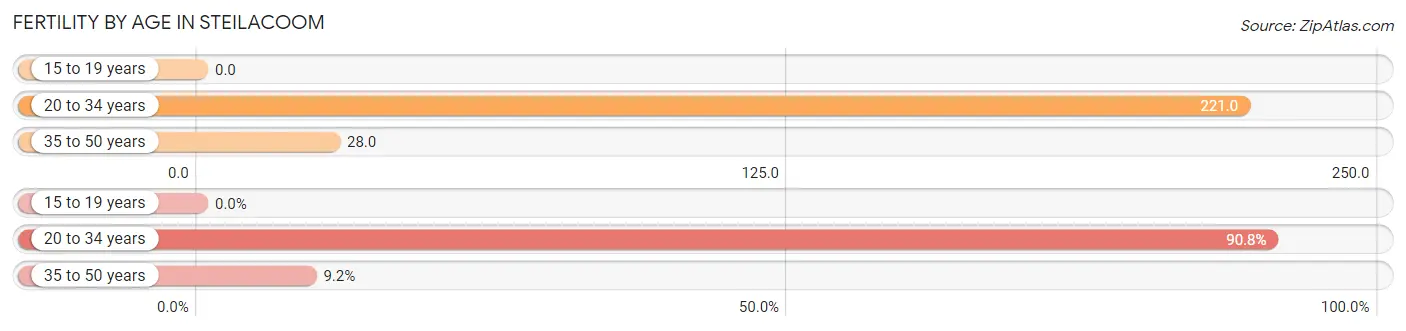
| Age Bracket | Women with Births | Births / 1,000 Women |
| 15 to 19 years | 0 (0.0%) | 0.0 |
| 20 to 34 years | 158 (90.8%) | 221.0 |
| 35 to 50 years | 16 (9.2%) | 28.0 |
| Total | 174 (100.0%) | 121.0 |
Fertility by Age by Marriage Status in Steilacoom
87.9% of women with births (174) in Steilacoom are married. The highest percentage of unmarried women with births falls into 20 to 34 years age bracket with 13.3% of them unmarried at the time of birth, while the lowest percentage of unmarried women with births belong to 35 to 50 years age bracket with 0.0% of them unmarried.
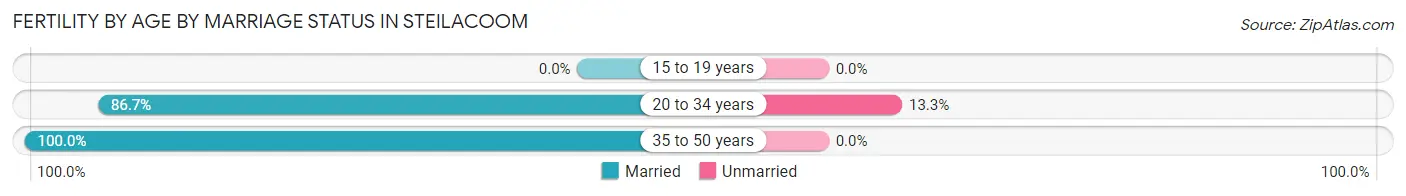
| Age Bracket | Married | Unmarried |
| 15 to 19 years | 0 (0.0%) | 0 (0.0%) |
| 20 to 34 years | 137 (86.7%) | 21 (13.3%) |
| 35 to 50 years | 16 (100.0%) | 0 (0.0%) |
| Total | 153 (87.9%) | 21 (12.1%) |
Fertility by Education in Steilacoom
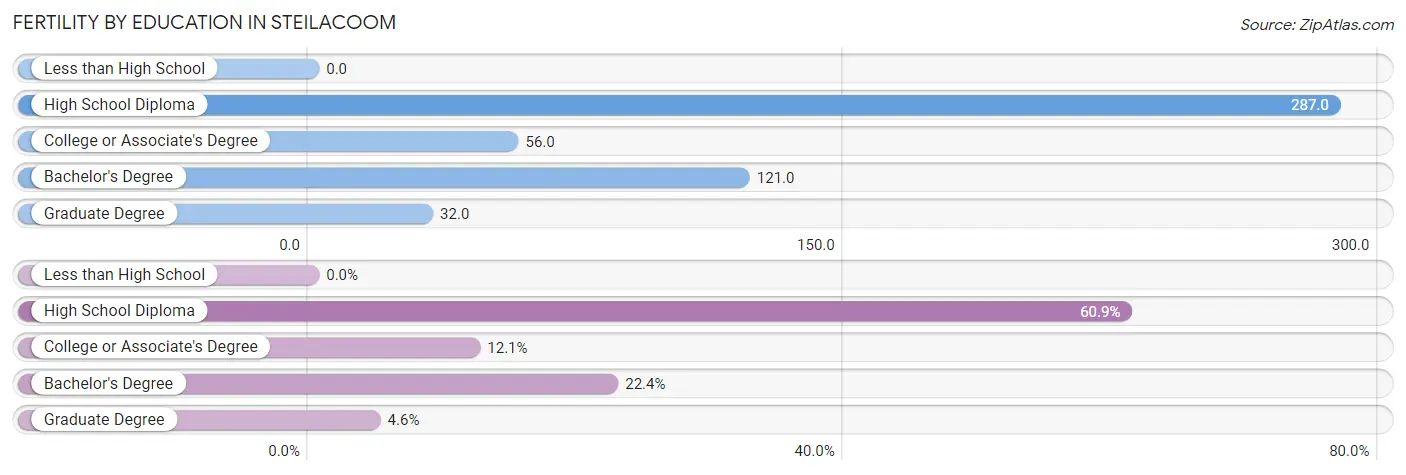
| Educational Attainment | Women with Births | Births / 1,000 Women |
| Less than High School | 0 (0.0%) | 0.0 |
| High School Diploma | 106 (60.9%) | 287.0 |
| College or Associate's Degree | 21 (12.1%) | 56.0 |
| Bachelor's Degree | 39 (22.4%) | 121.0 |
| Graduate Degree | 8 (4.6%) | 32.0 |
| Total | 174 (100.0%) | 121.0 |
Fertility by Education by Marriage Status in Steilacoom
12.1% of women with births in Steilacoom are unmarried. Women with the educational attainment of bachelor's degree are most likely to be married with 100.0% of them married at childbirth, while women with the educational attainment of college or associate's degree are least likely to be married with 61.9% of them unmarried at childbirth.
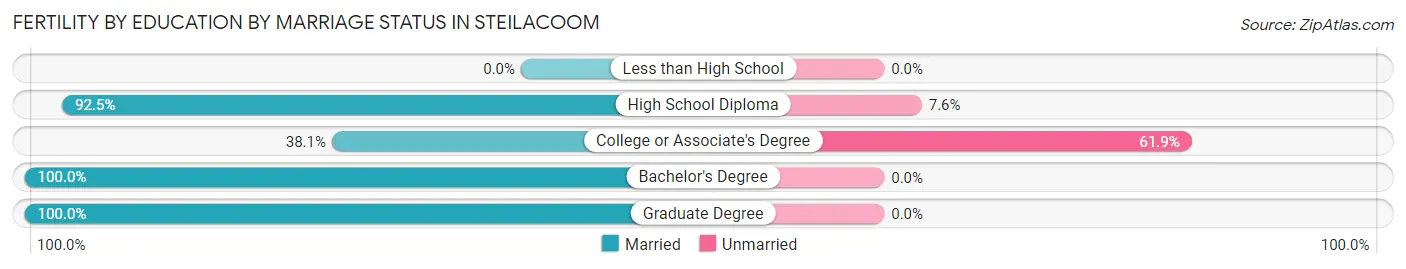
| Educational Attainment | Married | Unmarried |
| Less than High School | 0 (0.0%) | 0 (0.0%) |
| High School Diploma | 98 (92.4%) | 8 (7.5%) |
| College or Associate's Degree | 8 (38.1%) | 13 (61.9%) |
| Bachelor's Degree | 39 (100.0%) | 0 (0.0%) |
| Graduate Degree | 8 (100.0%) | 0 (0.0%) |
| Total | 153 (87.9%) | 21 (12.1%) |
Employment Characteristics in Steilacoom
Employment by Class of Employer in Steilacoom
Among the 3,158 employed individuals in Steilacoom, private company employees (1,602 | 50.7%), federal government employees (463 | 14.7%), and state government employees (335 | 10.6%) make up the most common classes of employment.
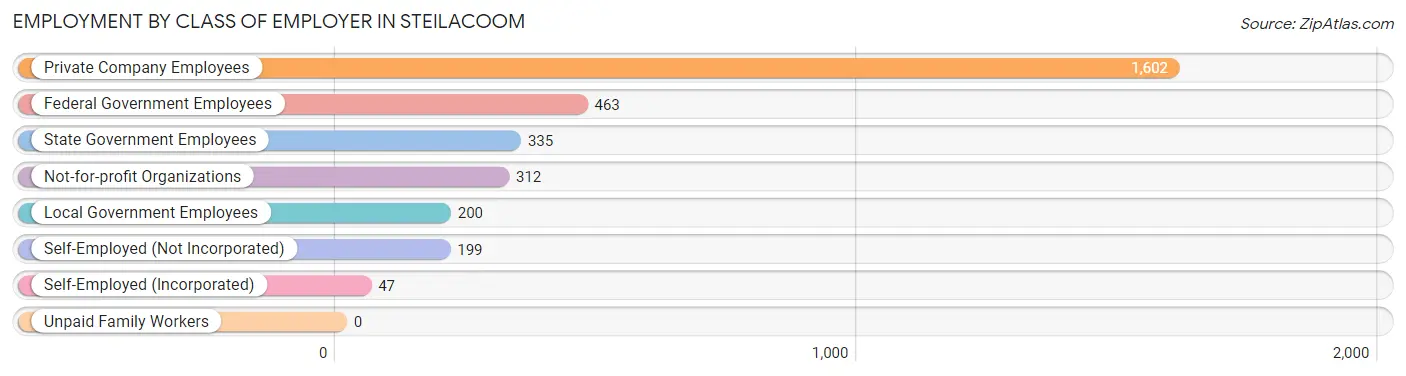
| Employer Class | # Employees | % Employees |
| Private Company Employees | 1,602 | 50.7% |
| Self-Employed (Incorporated) | 47 | 1.5% |
| Self-Employed (Not Incorporated) | 199 | 6.3% |
| Not-for-profit Organizations | 312 | 9.9% |
| Local Government Employees | 200 | 6.3% |
| State Government Employees | 335 | 10.6% |
| Federal Government Employees | 463 | 14.7% |
| Unpaid Family Workers | 0 | 0.0% |
| Total | 3,158 | 100.0% |
Employment Status by Age in Steilacoom
According to the labor force statistics for Steilacoom, out of the total population over 16 years of age (5,464), 61.5% or 3,360 individuals are in the labor force, with 3.3% or 111 of them unemployed. The age group with the highest labor force participation rate is 45 to 54 years, with 89.3% or 612 individuals in the labor force. Within the labor force, the 16 to 19 years age range has the highest percentage of unemployed individuals, with 26.7% or 24 of them being unemployed.
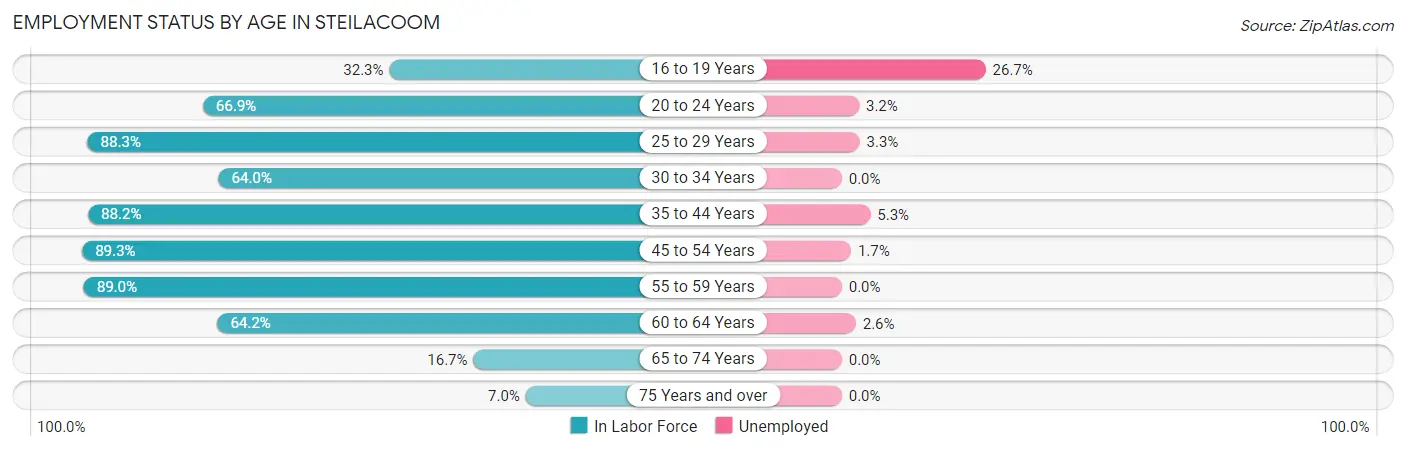
| Age Bracket | In Labor Force | Unemployed |
| 16 to 19 Years | 90 (32.3%) | 24 (26.7%) |
| 20 to 24 Years | 311 (66.9%) | 10 (3.2%) |
| 25 to 29 Years | 355 (88.3%) | 12 (3.3%) |
| 30 to 34 Years | 292 (64.0%) | 0 (0.0%) |
| 35 to 44 Years | 836 (88.2%) | 44 (5.3%) |
| 45 to 54 Years | 612 (89.3%) | 10 (1.7%) |
| 55 to 59 Years | 348 (89.0%) | 0 (0.0%) |
| 60 to 64 Years | 340 (64.2%) | 9 (2.6%) |
| 65 to 74 Years | 145 (16.7%) | 0 (0.0%) |
| 75 Years and over | 31 (7.0%) | 0 (0.0%) |
| Total | 3,360 (61.5%) | 111 (3.3%) |
Employment Status by Educational Attainment in Steilacoom
According to labor force statistics for Steilacoom, 81.6% of individuals (2,784) out of the total population between 25 and 64 years of age (3,412) are in the labor force, with 2.7% or 75 of them being unemployed. The group with the highest labor force participation rate are those with the educational attainment of college / associate degree, with 87.5% or 1,070 individuals in the labor force. Within the labor force, individuals with high school diploma education have the highest percentage of unemployment, with 9.5% or 36 of them being unemployed.
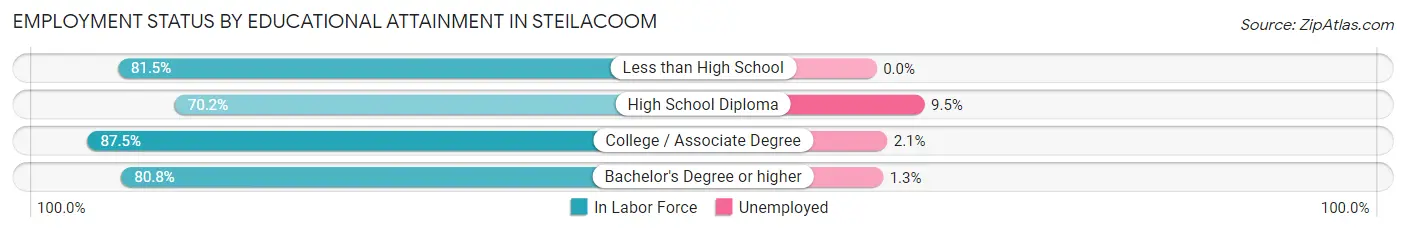
| Educational Attainment | In Labor Force | Unemployed |
| Less than High School | 106 (81.5%) | 0 (0.0%) |
| High School Diploma | 375 (70.2%) | 51 (9.5%) |
| College / Associate Degree | 1,070 (87.5%) | 26 (2.1%) |
| Bachelor's Degree or higher | 1,232 (80.8%) | 20 (1.3%) |
| Total | 2,784 (81.6%) | 92 (2.7%) |
Employment Occupations by Sex in Steilacoom
Management, Business, Science and Arts Occupations
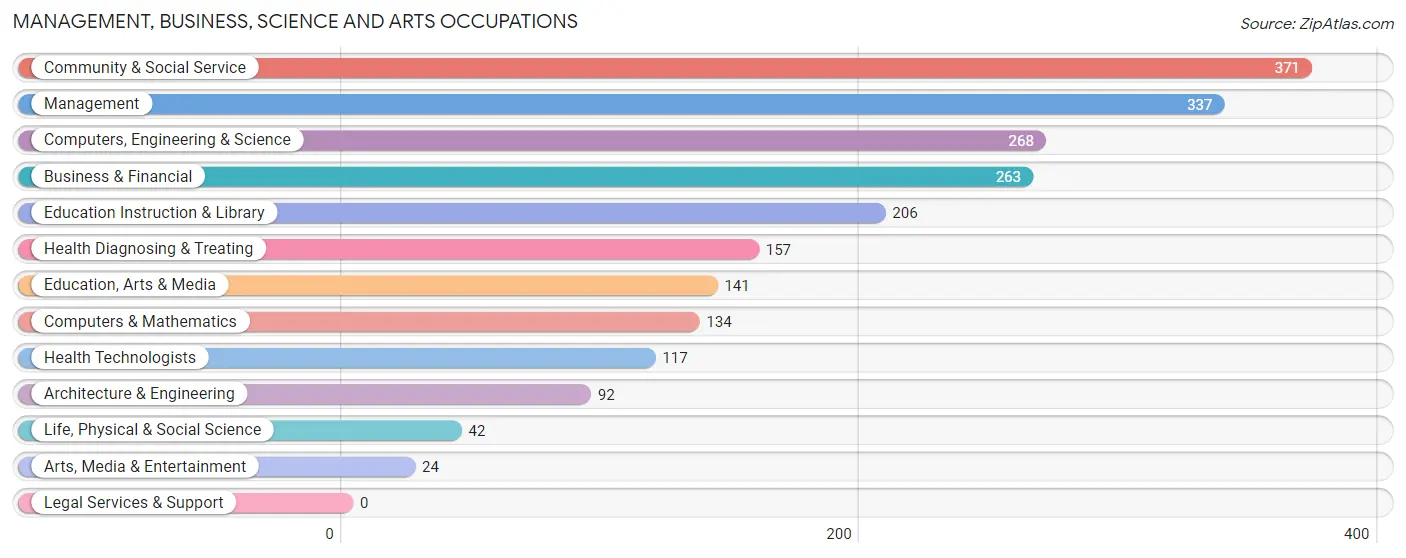
The most common Management, Business, Science and Arts occupations in Steilacoom are Community & Social Service (371 | 12.2%), Management (337 | 11.1%), Computers, Engineering & Science (268 | 8.8%), Business & Financial (263 | 8.7%), and Education Instruction & Library (206 | 6.8%).
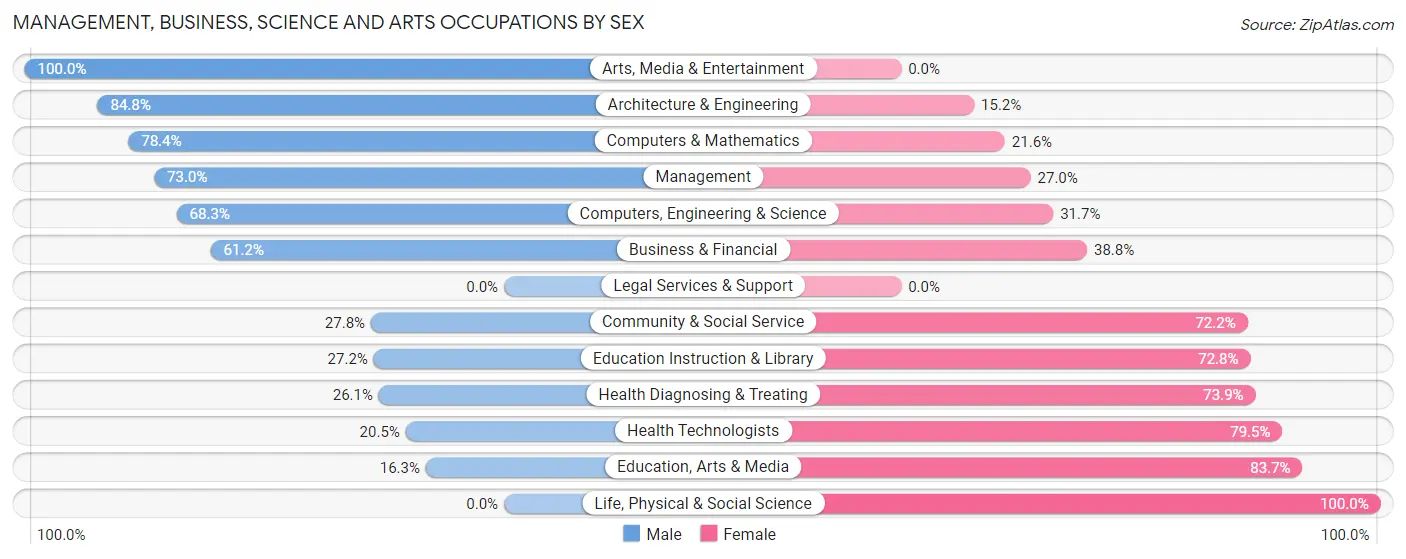
Management, Business, Science and Arts Occupations by Sex
Within the Management, Business, Science and Arts occupations in Steilacoom, the most male-oriented occupations are Arts, Media & Entertainment (100.0%), Architecture & Engineering (84.8%), and Computers & Mathematics (78.4%), while the most female-oriented occupations are Life, Physical & Social Science (100.0%), Education, Arts & Media (83.7%), and Health Technologists (79.5%).
| Occupation | Male | Female |
| Management | 246 (73.0%) | 91 (27.0%) |
| Business & Financial | 161 (61.2%) | 102 (38.8%) |
| Computers, Engineering & Science | 183 (68.3%) | 85 (31.7%) |
| Computers & Mathematics | 105 (78.4%) | 29 (21.6%) |
| Architecture & Engineering | 78 (84.8%) | 14 (15.2%) |
| Life, Physical & Social Science | 0 (0.0%) | 42 (100.0%) |
| Community & Social Service | 103 (27.8%) | 268 (72.2%) |
| Education, Arts & Media | 23 (16.3%) | 118 (83.7%) |
| Legal Services & Support | 0 (0.0%) | 0 (0.0%) |
| Education Instruction & Library | 56 (27.2%) | 150 (72.8%) |
| Arts, Media & Entertainment | 24 (100.0%) | 0 (0.0%) |
| Health Diagnosing & Treating | 41 (26.1%) | 116 (73.9%) |
| Health Technologists | 24 (20.5%) | 93 (79.5%) |
| Total (Category) | 734 (52.6%) | 662 (47.4%) |
| Total (Overall) | 1,730 (57.1%) | 1,299 (42.9%) |
Services Occupations
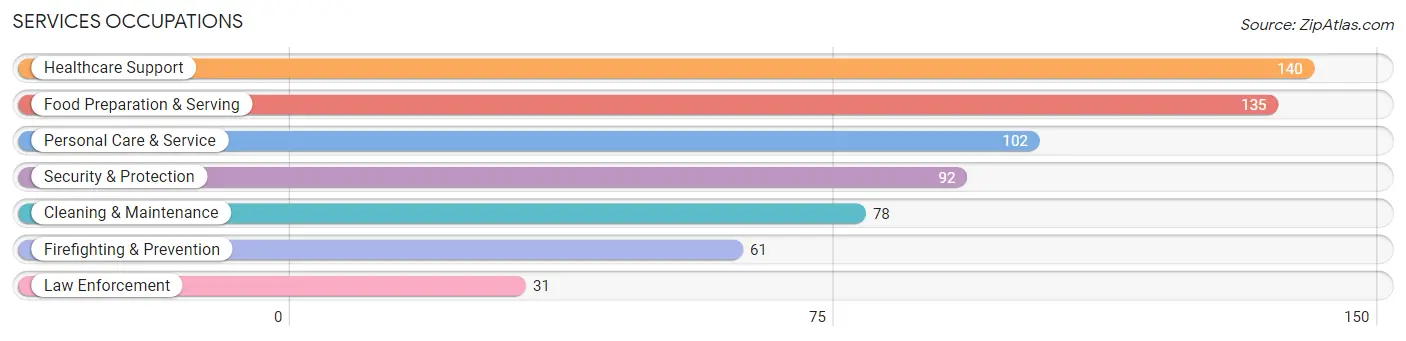
The most common Services occupations in Steilacoom are Healthcare Support (140 | 4.6%), Food Preparation & Serving (135 | 4.5%), Personal Care & Service (102 | 3.4%), Security & Protection (92 | 3.0%), and Cleaning & Maintenance (78 | 2.6%).
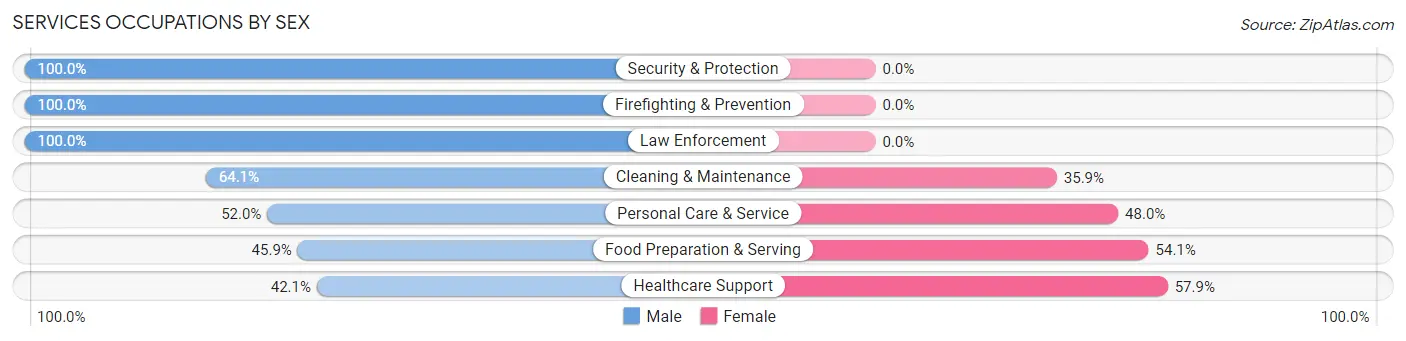
Services Occupations by Sex
Within the Services occupations in Steilacoom, the most male-oriented occupations are Security & Protection (100.0%), Firefighting & Prevention (100.0%), and Law Enforcement (100.0%), while the most female-oriented occupations are Healthcare Support (57.9%), Food Preparation & Serving (54.1%), and Personal Care & Service (48.0%).
| Occupation | Male | Female |
| Healthcare Support | 59 (42.1%) | 81 (57.9%) |
| Security & Protection | 92 (100.0%) | 0 (0.0%) |
| Firefighting & Prevention | 61 (100.0%) | 0 (0.0%) |
| Law Enforcement | 31 (100.0%) | 0 (0.0%) |
| Food Preparation & Serving | 62 (45.9%) | 73 (54.1%) |
| Cleaning & Maintenance | 50 (64.1%) | 28 (35.9%) |
| Personal Care & Service | 53 (52.0%) | 49 (48.0%) |
| Total (Category) | 316 (57.8%) | 231 (42.2%) |
| Total (Overall) | 1,730 (57.1%) | 1,299 (42.9%) |
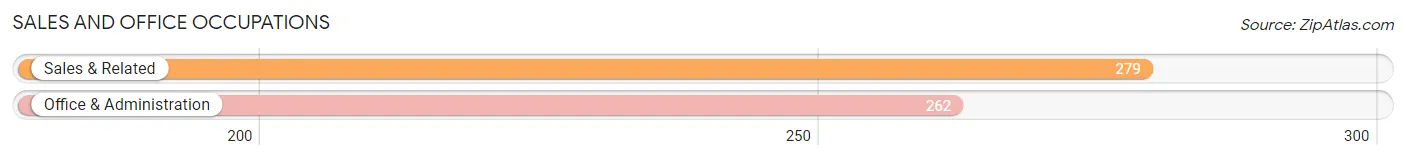
Sales and Office Occupations
The most common Sales and Office occupations in Steilacoom are Sales & Related (279 | 9.2%), and Office & Administration (262 | 8.6%).
Sales and Office Occupations by Sex
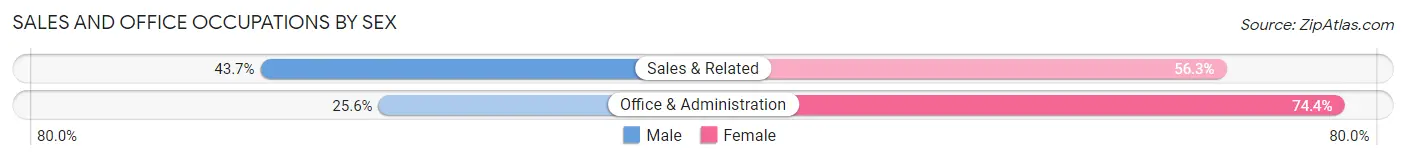
| Occupation | Male | Female |
| Sales & Related | 122 (43.7%) | 157 (56.3%) |
| Office & Administration | 67 (25.6%) | 195 (74.4%) |
| Total (Category) | 189 (34.9%) | 352 (65.1%) |
| Total (Overall) | 1,730 (57.1%) | 1,299 (42.9%) |
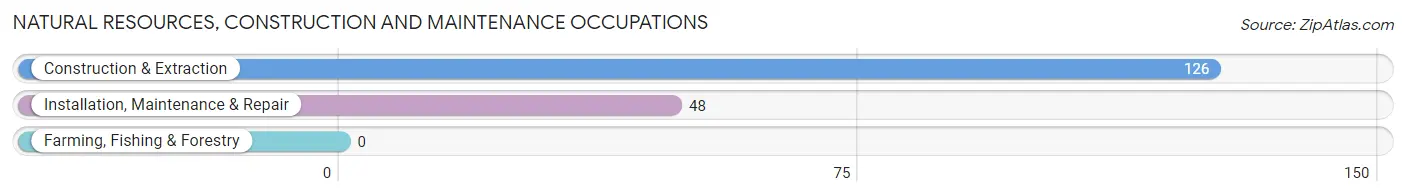
Natural Resources, Construction and Maintenance Occupations
The most common Natural Resources, Construction and Maintenance occupations in Steilacoom are Construction & Extraction (126 | 4.2%), and Installation, Maintenance & Repair (48 | 1.6%).
Natural Resources, Construction and Maintenance Occupations by Sex
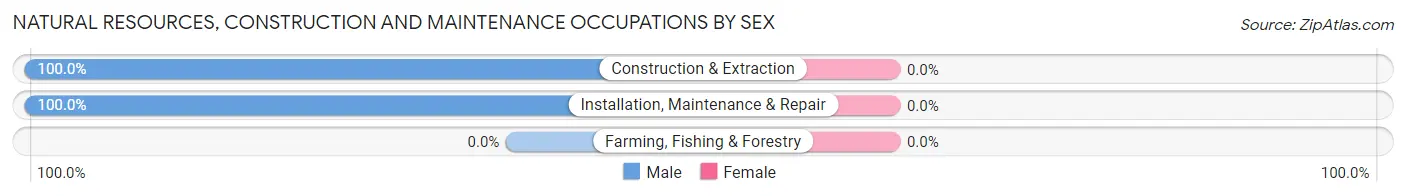
| Occupation | Male | Female |
| Farming, Fishing & Forestry | 0 (0.0%) | 0 (0.0%) |
| Construction & Extraction | 126 (100.0%) | 0 (0.0%) |
| Installation, Maintenance & Repair | 48 (100.0%) | 0 (0.0%) |
| Total (Category) | 174 (100.0%) | 0 (0.0%) |
| Total (Overall) | 1,730 (57.1%) | 1,299 (42.9%) |
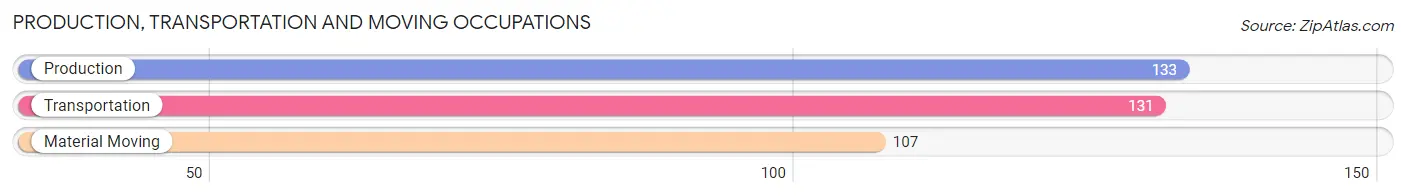
Production, Transportation and Moving Occupations
The most common Production, Transportation and Moving occupations in Steilacoom are Production (133 | 4.4%), Transportation (131 | 4.3%), and Material Moving (107 | 3.5%).
Production, Transportation and Moving Occupations by Sex
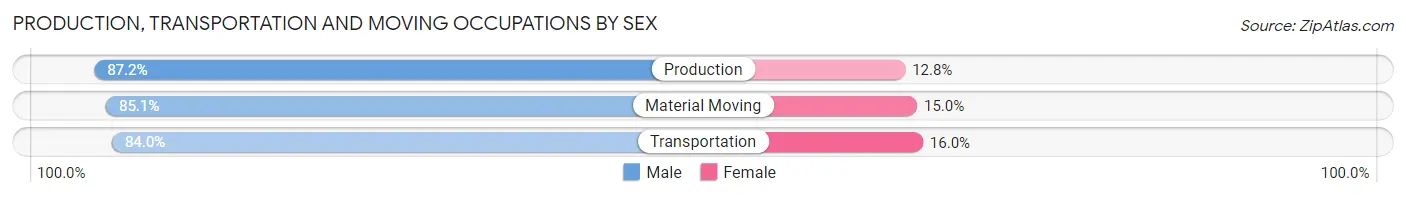
| Occupation | Male | Female |
| Production | 116 (87.2%) | 17 (12.8%) |
| Transportation | 110 (84.0%) | 21 (16.0%) |
| Material Moving | 91 (85.1%) | 16 (14.9%) |
| Total (Category) | 317 (85.4%) | 54 (14.6%) |
| Total (Overall) | 1,730 (57.1%) | 1,299 (42.9%) |
Employment Industries by Sex in Steilacoom
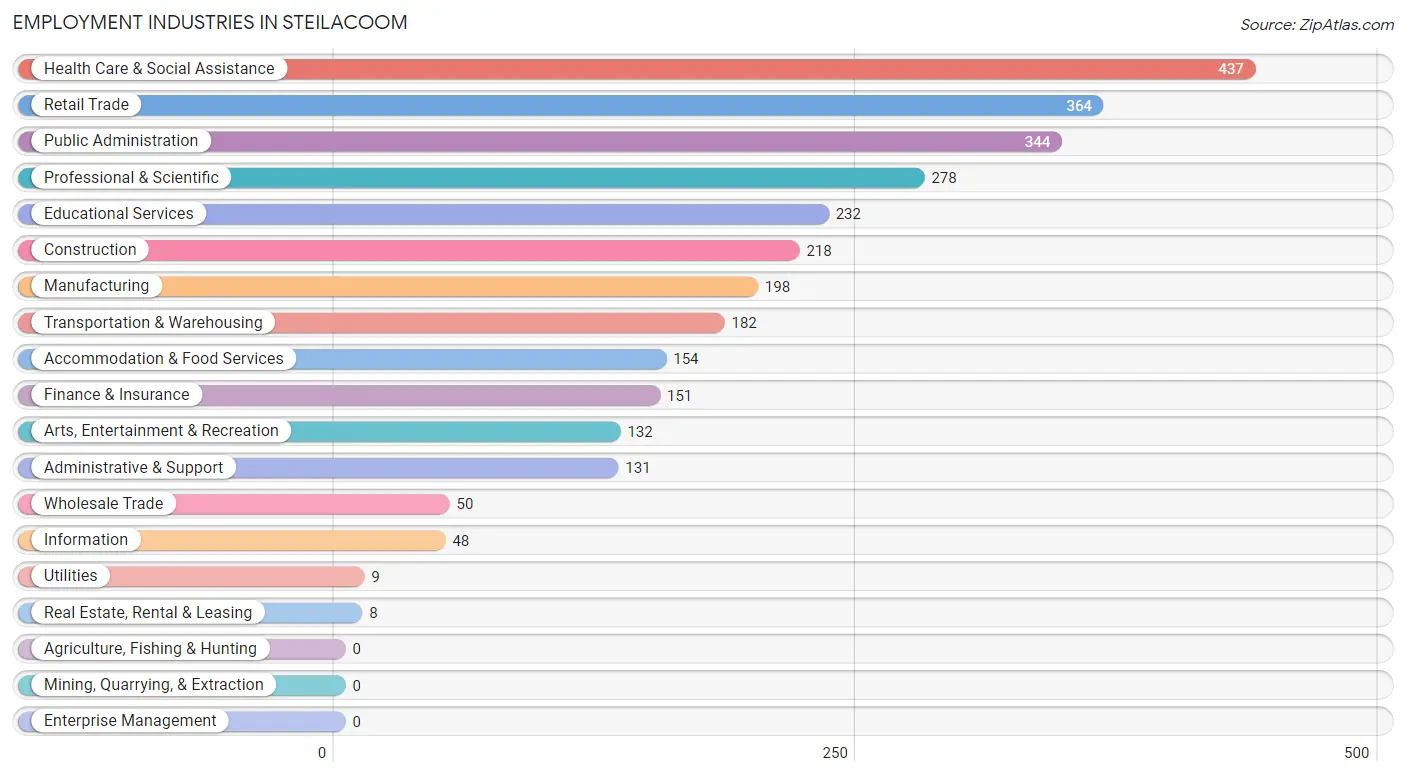
Employment Industries in Steilacoom
The major employment industries in Steilacoom include Health Care & Social Assistance (437 | 14.4%), Retail Trade (364 | 12.0%), Public Administration (344 | 11.4%), Professional & Scientific (278 | 9.2%), and Educational Services (232 | 7.7%).
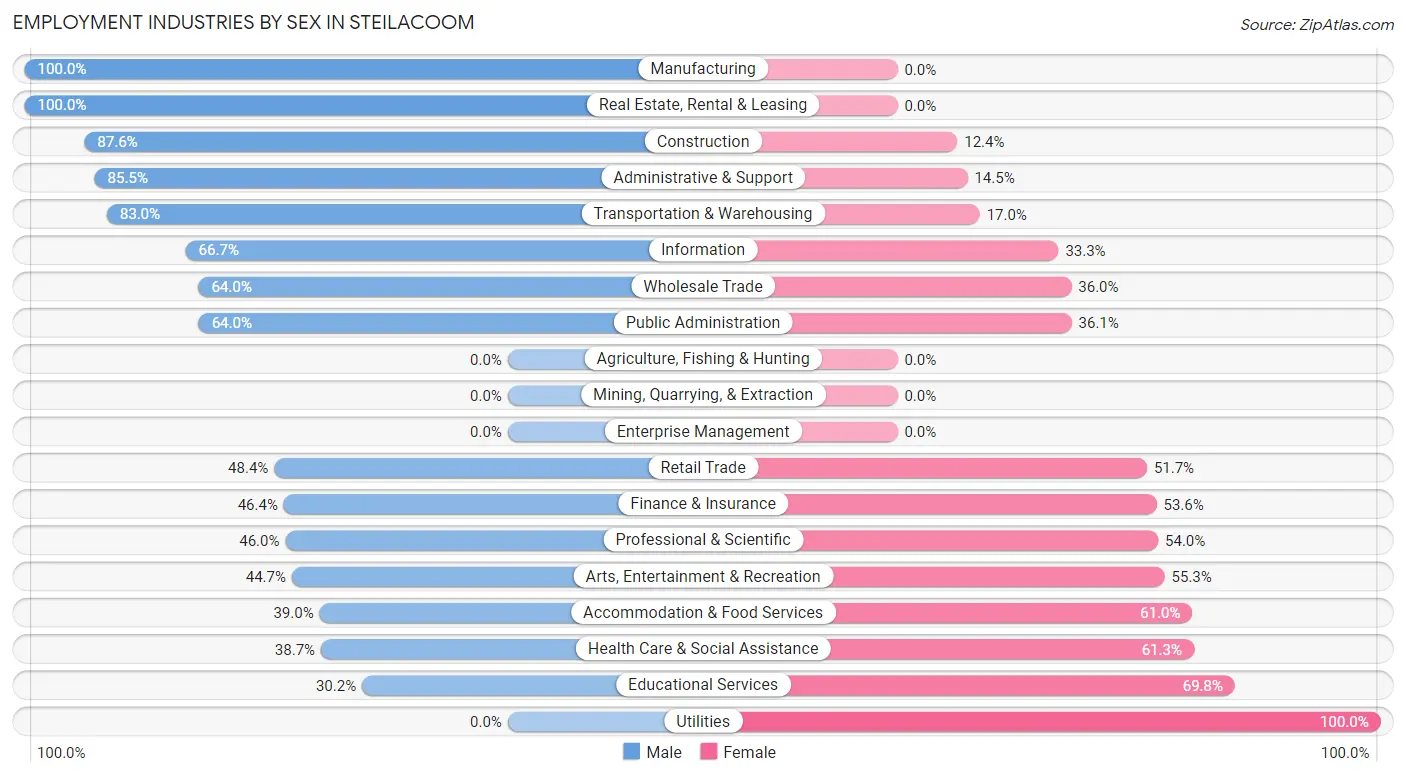
Employment Industries by Sex in Steilacoom
The Steilacoom industries that see more men than women are Manufacturing (100.0%), Real Estate, Rental & Leasing (100.0%), and Construction (87.6%), whereas the industries that tend to have a higher number of women are Utilities (100.0%), Educational Services (69.8%), and Health Care & Social Assistance (61.3%).
| Industry | Male | Female |
| Agriculture, Fishing & Hunting | 0 (0.0%) | 0 (0.0%) |
| Mining, Quarrying, & Extraction | 0 (0.0%) | 0 (0.0%) |
| Construction | 191 (87.6%) | 27 (12.4%) |
| Manufacturing | 198 (100.0%) | 0 (0.0%) |
| Wholesale Trade | 32 (64.0%) | 18 (36.0%) |
| Retail Trade | 176 (48.3%) | 188 (51.6%) |
| Transportation & Warehousing | 151 (83.0%) | 31 (17.0%) |
| Utilities | 0 (0.0%) | 9 (100.0%) |
| Information | 32 (66.7%) | 16 (33.3%) |
| Finance & Insurance | 70 (46.4%) | 81 (53.6%) |
| Real Estate, Rental & Leasing | 8 (100.0%) | 0 (0.0%) |
| Professional & Scientific | 128 (46.0%) | 150 (54.0%) |
| Enterprise Management | 0 (0.0%) | 0 (0.0%) |
| Administrative & Support | 112 (85.5%) | 19 (14.5%) |
| Educational Services | 70 (30.2%) | 162 (69.8%) |
| Health Care & Social Assistance | 169 (38.7%) | 268 (61.3%) |
| Arts, Entertainment & Recreation | 59 (44.7%) | 73 (55.3%) |
| Accommodation & Food Services | 60 (39.0%) | 94 (61.0%) |
| Public Administration | 220 (63.9%) | 124 (36.0%) |
| Total | 1,730 (57.1%) | 1,299 (42.9%) |
Education in Steilacoom
School Enrollment in Steilacoom
The most common levels of schooling among the 1,264 students in Steilacoom are elementary school (399 | 31.6%), college / undergraduate (264 | 20.9%), and high school (250 | 19.8%).
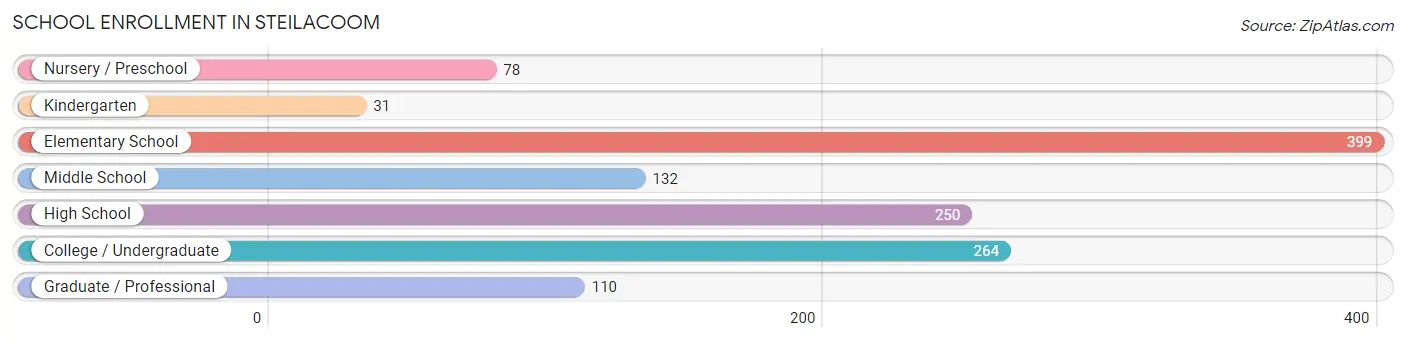
| School Level | # Students | % Students |
| Nursery / Preschool | 78 | 6.2% |
| Kindergarten | 31 | 2.5% |
| Elementary School | 399 | 31.6% |
| Middle School | 132 | 10.4% |
| High School | 250 | 19.8% |
| College / Undergraduate | 264 | 20.9% |
| Graduate / Professional | 110 | 8.7% |
| Total | 1,264 | 100.0% |
School Enrollment by Age by Funding Source in Steilacoom
Out of a total of 1,264 students who are enrolled in schools in Steilacoom, 259 (20.5%) attend a private institution, while the remaining 1,005 (79.5%) are enrolled in public schools. The age group of 35 years and over has the highest likelihood of being enrolled in private schools, with 52 (30.6% in the age bracket) enrolled. Conversely, the age group of 3 to 4 year olds has the lowest likelihood of being enrolled in a private school, with 32 (100.0% in the age bracket) attending a public institution.
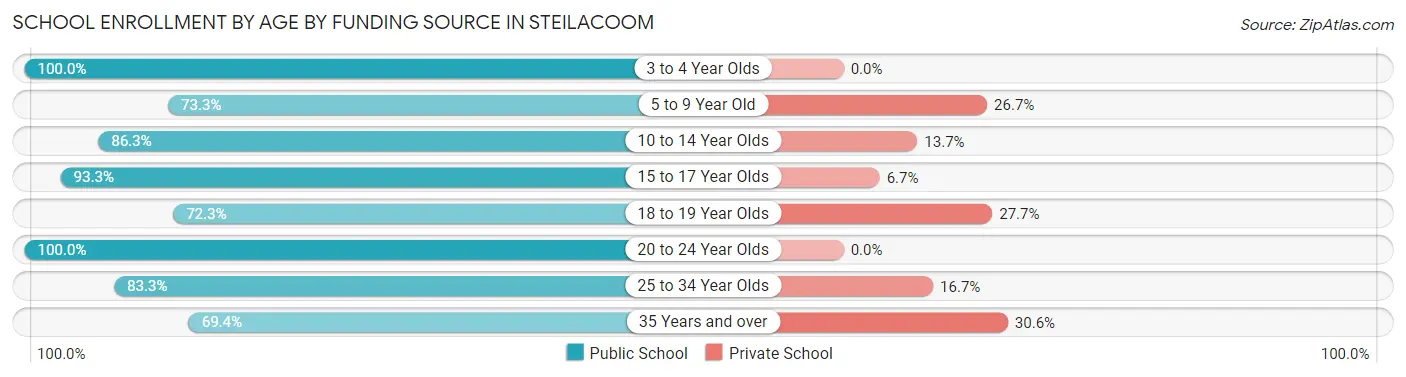
| Age Bracket | Public School | Private School |
| 3 to 4 Year Olds | 32 (100.0%) | 0 (0.0%) |
| 5 to 9 Year Old | 307 (73.3%) | 112 (26.7%) |
| 10 to 14 Year Olds | 201 (86.3%) | 32 (13.7%) |
| 15 to 17 Year Olds | 111 (93.3%) | 8 (6.7%) |
| 18 to 19 Year Olds | 94 (72.3%) | 36 (27.7%) |
| 20 to 24 Year Olds | 47 (100.0%) | 0 (0.0%) |
| 25 to 34 Year Olds | 95 (83.3%) | 19 (16.7%) |
| 35 Years and over | 118 (69.4%) | 52 (30.6%) |
| Total | 1,005 (79.5%) | 259 (20.5%) |
Educational Attainment by Field of Study in Steilacoom
Business (360 | 15.5%), education (283 | 12.2%), science & technology (262 | 11.3%), bio, nature & agricultural (227 | 9.8%), and liberal arts & history (208 | 8.9%) are the most common fields of study among 2,328 individuals in Steilacoom who have obtained a bachelor's degree or higher.
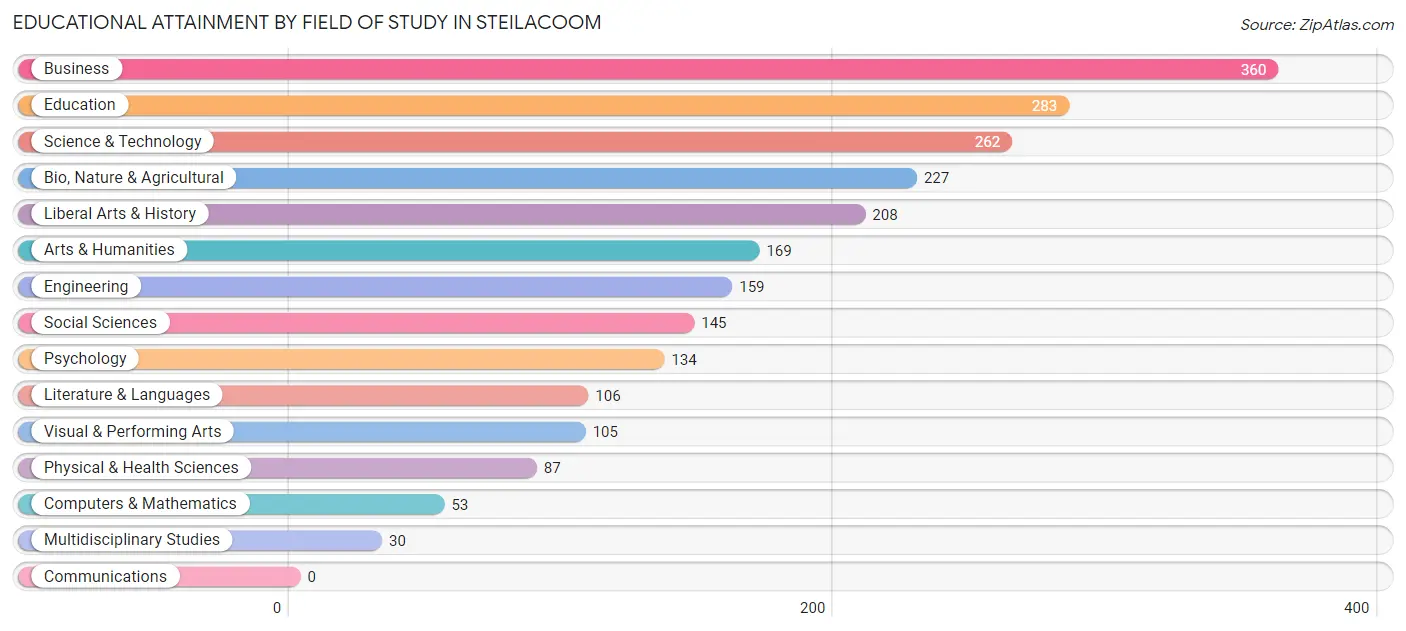
| Field of Study | # Graduates | % Graduates |
| Computers & Mathematics | 53 | 2.3% |
| Bio, Nature & Agricultural | 227 | 9.8% |
| Physical & Health Sciences | 87 | 3.7% |
| Psychology | 134 | 5.8% |
| Social Sciences | 145 | 6.2% |
| Engineering | 159 | 6.8% |
| Multidisciplinary Studies | 30 | 1.3% |
| Science & Technology | 262 | 11.3% |
| Business | 360 | 15.5% |
| Education | 283 | 12.2% |
| Literature & Languages | 106 | 4.5% |
| Liberal Arts & History | 208 | 8.9% |
| Visual & Performing Arts | 105 | 4.5% |
| Communications | 0 | 0.0% |
| Arts & Humanities | 169 | 7.3% |
| Total | 2,328 | 100.0% |
Transportation & Commute in Steilacoom
Vehicle Availability by Sex in Steilacoom
The most prevalent vehicle ownership categories in Steilacoom are males with 2 vehicles (825, accounting for 44.0%) and females with 2 vehicles (539, making up 64.5%).
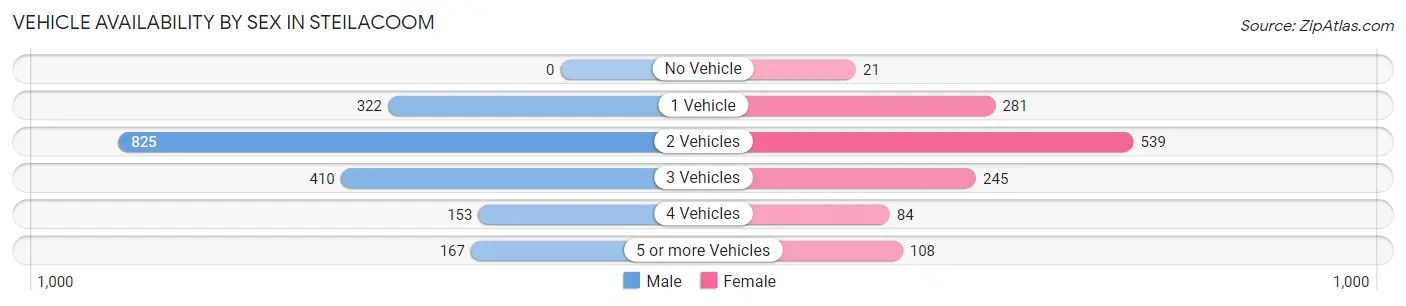
| Vehicles Available | Male | Female |
| No Vehicle | 0 (0.0%) | 21 (1.6%) |
| 1 Vehicle | 322 (17.2%) | 281 (22.0%) |
| 2 Vehicles | 825 (44.0%) | 539 (42.2%) |
| 3 Vehicles | 410 (21.8%) | 245 (19.2%) |
| 4 Vehicles | 153 (8.2%) | 84 (6.6%) |
| 5 or more Vehicles | 167 (8.9%) | 108 (8.5%) |
| Total | 1,877 (100.0%) | 1,278 (100.0%) |
Commute Time in Steilacoom
The most frequently occuring commute durations in Steilacoom are 20 to 24 minutes (447 commuters, 17.3%), 15 to 19 minutes (383 commuters, 14.8%), and 30 to 34 minutes (342 commuters, 13.2%).
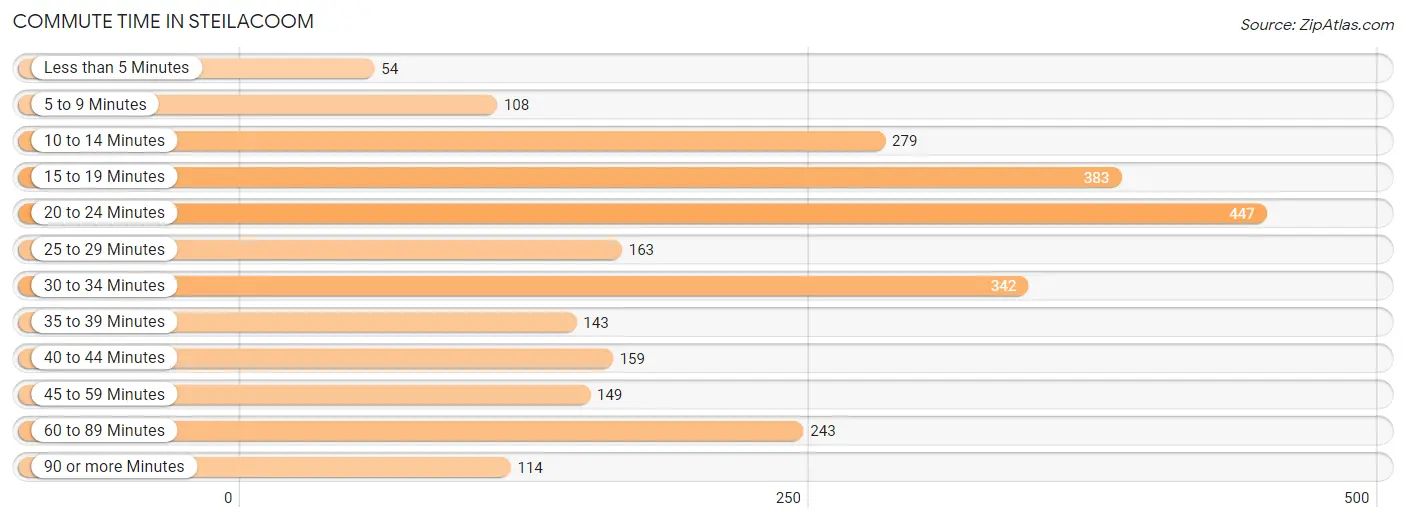
| Commute Time | # Commuters | % Commuters |
| Less than 5 Minutes | 54 | 2.1% |
| 5 to 9 Minutes | 108 | 4.2% |
| 10 to 14 Minutes | 279 | 10.8% |
| 15 to 19 Minutes | 383 | 14.8% |
| 20 to 24 Minutes | 447 | 17.3% |
| 25 to 29 Minutes | 163 | 6.3% |
| 30 to 34 Minutes | 342 | 13.2% |
| 35 to 39 Minutes | 143 | 5.5% |
| 40 to 44 Minutes | 159 | 6.1% |
| 45 to 59 Minutes | 149 | 5.8% |
| 60 to 89 Minutes | 243 | 9.4% |
| 90 or more Minutes | 114 | 4.4% |
Commute Time by Sex in Steilacoom
The most common commute times in Steilacoom are 20 to 24 minutes (292 commuters, 18.3%) for males and 30 to 34 minutes (175 commuters, 17.7%) for females.
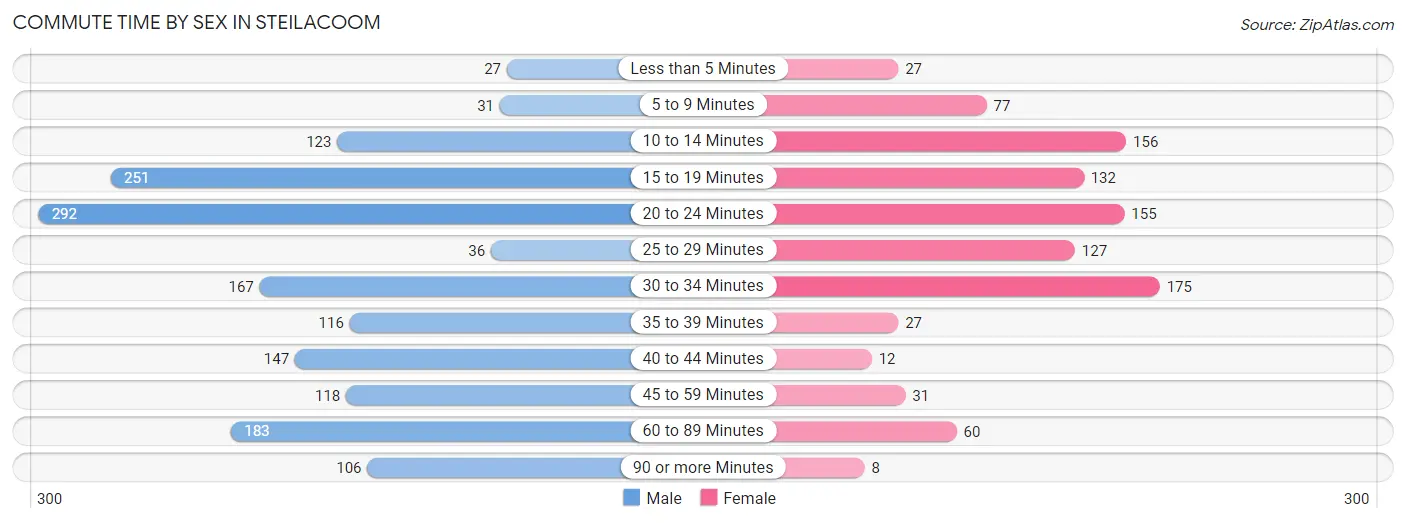
| Commute Time | Male | Female |
| Less than 5 Minutes | 27 (1.7%) | 27 (2.7%) |
| 5 to 9 Minutes | 31 (1.9%) | 77 (7.8%) |
| 10 to 14 Minutes | 123 (7.7%) | 156 (15.8%) |
| 15 to 19 Minutes | 251 (15.7%) | 132 (13.4%) |
| 20 to 24 Minutes | 292 (18.3%) | 155 (15.7%) |
| 25 to 29 Minutes | 36 (2.2%) | 127 (12.9%) |
| 30 to 34 Minutes | 167 (10.5%) | 175 (17.7%) |
| 35 to 39 Minutes | 116 (7.3%) | 27 (2.7%) |
| 40 to 44 Minutes | 147 (9.2%) | 12 (1.2%) |
| 45 to 59 Minutes | 118 (7.4%) | 31 (3.1%) |
| 60 to 89 Minutes | 183 (11.5%) | 60 (6.1%) |
| 90 or more Minutes | 106 (6.6%) | 8 (0.8%) |
Time of Departure to Work by Sex in Steilacoom
The most frequent times of departure to work in Steilacoom are 7:30 AM to 7:59 AM (251, 15.7%) for males and 7:00 AM to 7:29 AM (177, 17.9%) for females.
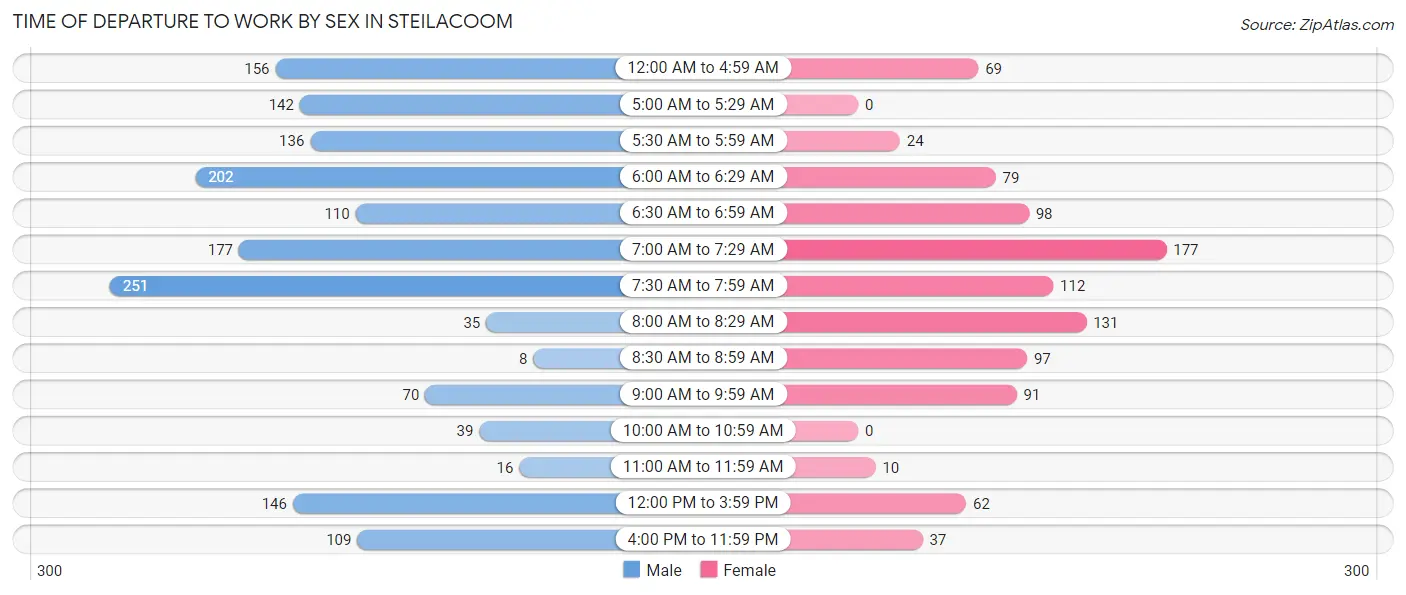
| Time of Departure | Male | Female |
| 12:00 AM to 4:59 AM | 156 (9.8%) | 69 (7.0%) |
| 5:00 AM to 5:29 AM | 142 (8.9%) | 0 (0.0%) |
| 5:30 AM to 5:59 AM | 136 (8.5%) | 24 (2.4%) |
| 6:00 AM to 6:29 AM | 202 (12.7%) | 79 (8.0%) |
| 6:30 AM to 6:59 AM | 110 (6.9%) | 98 (9.9%) |
| 7:00 AM to 7:29 AM | 177 (11.1%) | 177 (17.9%) |
| 7:30 AM to 7:59 AM | 251 (15.7%) | 112 (11.4%) |
| 8:00 AM to 8:29 AM | 35 (2.2%) | 131 (13.3%) |
| 8:30 AM to 8:59 AM | 8 (0.5%) | 97 (9.8%) |
| 9:00 AM to 9:59 AM | 70 (4.4%) | 91 (9.2%) |
| 10:00 AM to 10:59 AM | 39 (2.4%) | 0 (0.0%) |
| 11:00 AM to 11:59 AM | 16 (1.0%) | 10 (1.0%) |
| 12:00 PM to 3:59 PM | 146 (9.1%) | 62 (6.3%) |
| 4:00 PM to 11:59 PM | 109 (6.8%) | 37 (3.7%) |
| Total | 1,597 (100.0%) | 987 (100.0%) |
Housing Occupancy in Steilacoom
Occupancy by Ownership in Steilacoom
Of the total 2,778 dwellings in Steilacoom, owner-occupied units account for 1,812 (65.2%), while renter-occupied units make up 966 (34.8%).
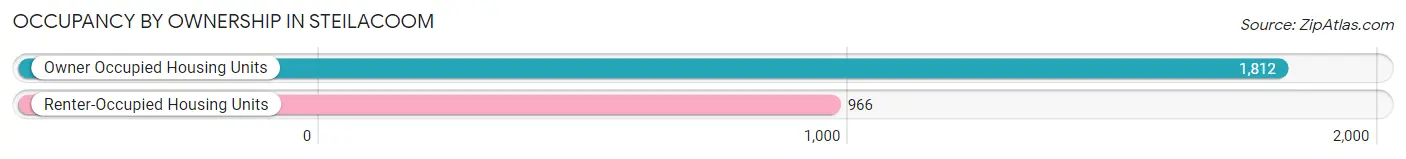
| Occupancy | # Housing Units | % Housing Units |
| Owner Occupied Housing Units | 1,812 | 65.2% |
| Renter-Occupied Housing Units | 966 | 34.8% |
| Total Occupied Housing Units | 2,778 | 100.0% |
Occupancy by Household Size in Steilacoom
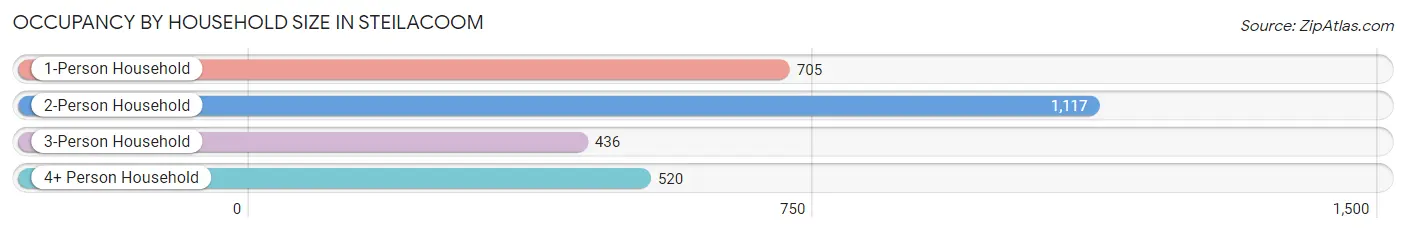
| Household Size | # Housing Units | % Housing Units |
| 1-Person Household | 705 | 25.4% |
| 2-Person Household | 1,117 | 40.2% |
| 3-Person Household | 436 | 15.7% |
| 4+ Person Household | 520 | 18.7% |
| Total Housing Units | 2,778 | 100.0% |
Occupancy by Ownership by Household Size in Steilacoom
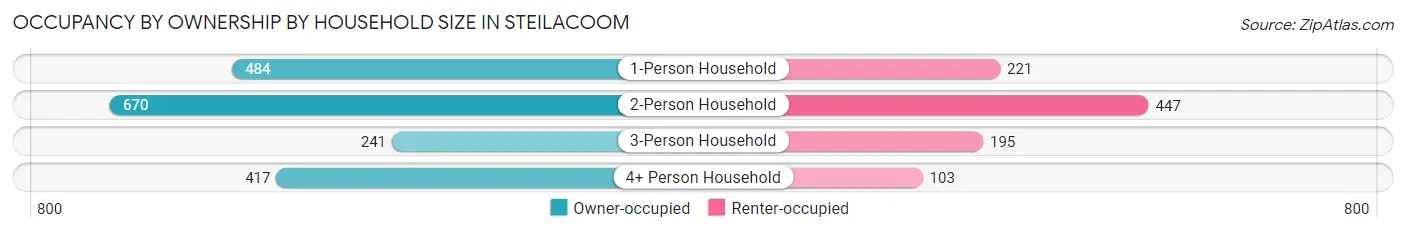
| Household Size | Owner-occupied | Renter-occupied |
| 1-Person Household | 484 (68.6%) | 221 (31.4%) |
| 2-Person Household | 670 (60.0%) | 447 (40.0%) |
| 3-Person Household | 241 (55.3%) | 195 (44.7%) |
| 4+ Person Household | 417 (80.2%) | 103 (19.8%) |
| Total Housing Units | 1,812 (65.2%) | 966 (34.8%) |
Occupancy by Educational Attainment in Steilacoom
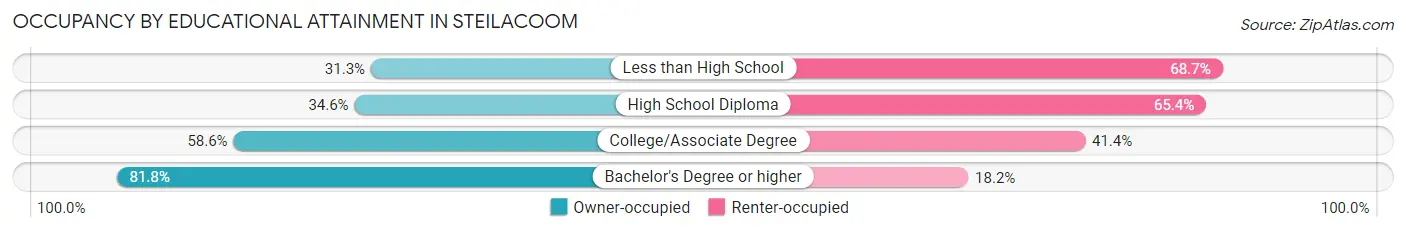
| Household Size | Owner-occupied | Renter-occupied |
| Less than High School | 21 (31.3%) | 46 (68.7%) |
| High School Diploma | 155 (34.6%) | 293 (65.4%) |
| College/Associate Degree | 542 (58.6%) | 383 (41.4%) |
| Bachelor's Degree or higher | 1,094 (81.8%) | 244 (18.2%) |
Occupancy by Age of Householder in Steilacoom
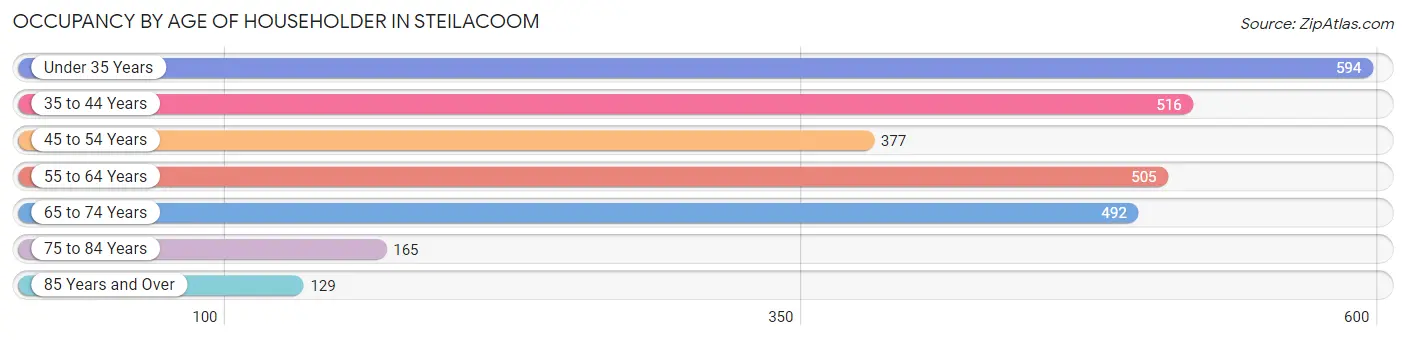
| Age Bracket | # Households | % Households |
| Under 35 Years | 594 | 21.4% |
| 35 to 44 Years | 516 | 18.6% |
| 45 to 54 Years | 377 | 13.6% |
| 55 to 64 Years | 505 | 18.2% |
| 65 to 74 Years | 492 | 17.7% |
| 75 to 84 Years | 165 | 5.9% |
| 85 Years and Over | 129 | 4.6% |
| Total | 2,778 | 100.0% |
Housing Finances in Steilacoom
Median Income by Occupancy in Steilacoom
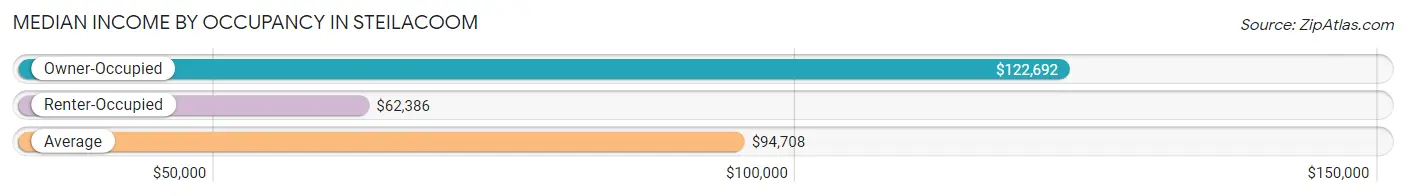
| Occupancy Type | # Households | Median Income |
| Owner-Occupied | 1,812 (65.2%) | $122,692 |
| Renter-Occupied | 966 (34.8%) | $62,386 |
| Average | 2,778 (100.0%) | $94,708 |
Occupancy by Householder Income Bracket in Steilacoom
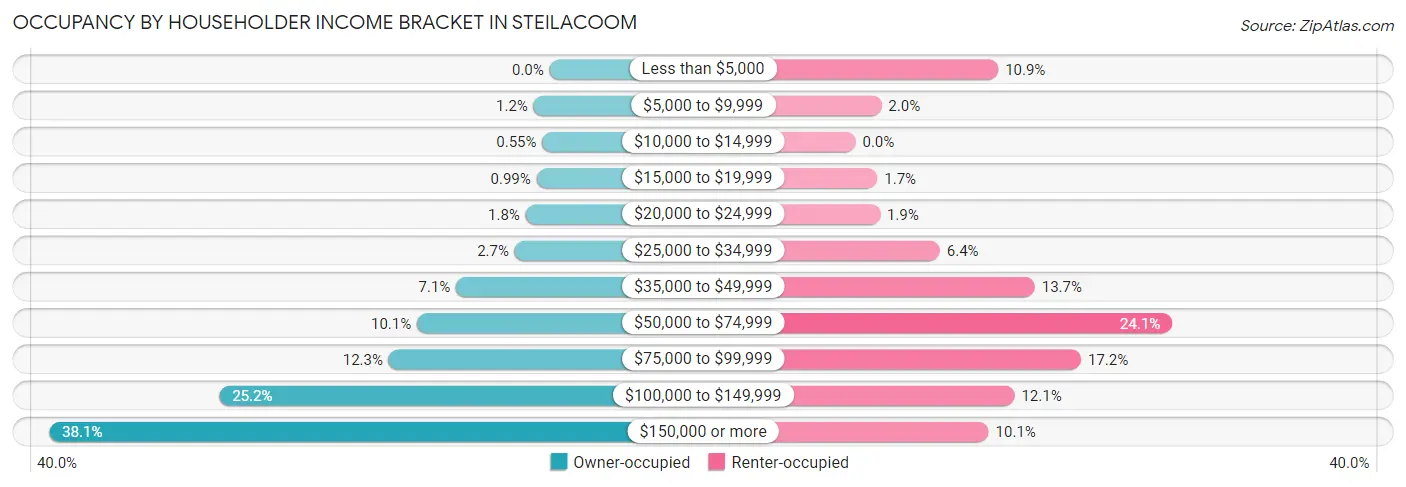
| Income Bracket | Owner-occupied | Renter-occupied |
| Less than $5,000 | 0 (0.0%) | 105 (10.9%) |
| $5,000 to $9,999 | 22 (1.2%) | 19 (2.0%) |
| $10,000 to $14,999 | 10 (0.5%) | 0 (0.0%) |
| $15,000 to $19,999 | 18 (1.0%) | 16 (1.7%) |
| $20,000 to $24,999 | 33 (1.8%) | 18 (1.9%) |
| $25,000 to $34,999 | 48 (2.6%) | 62 (6.4%) |
| $35,000 to $49,999 | 129 (7.1%) | 132 (13.7%) |
| $50,000 to $74,999 | 183 (10.1%) | 233 (24.1%) |
| $75,000 to $99,999 | 222 (12.2%) | 166 (17.2%) |
| $100,000 to $149,999 | 456 (25.2%) | 117 (12.1%) |
| $150,000 or more | 691 (38.1%) | 98 (10.1%) |
| Total | 1,812 (100.0%) | 966 (100.0%) |
Monthly Housing Cost Tiers in Steilacoom
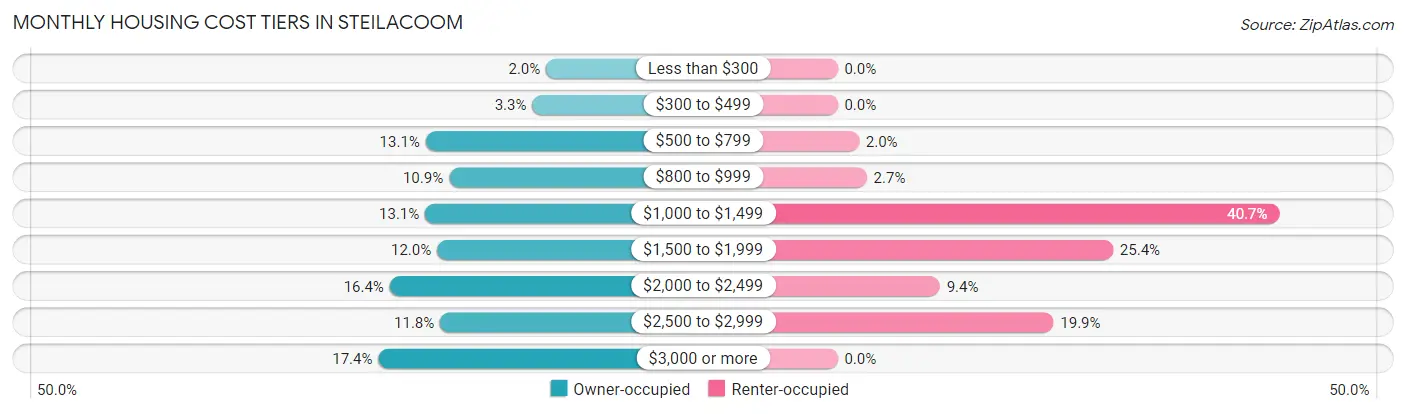
| Monthly Cost | Owner-occupied | Renter-occupied |
| Less than $300 | 36 (2.0%) | 0 (0.0%) |
| $300 to $499 | 59 (3.3%) | 0 (0.0%) |
| $500 to $799 | 237 (13.1%) | 19 (2.0%) |
| $800 to $999 | 198 (10.9%) | 26 (2.7%) |
| $1,000 to $1,499 | 238 (13.1%) | 393 (40.7%) |
| $1,500 to $1,999 | 218 (12.0%) | 245 (25.4%) |
| $2,000 to $2,499 | 297 (16.4%) | 91 (9.4%) |
| $2,500 to $2,999 | 213 (11.7%) | 192 (19.9%) |
| $3,000 or more | 316 (17.4%) | 0 (0.0%) |
| Total | 1,812 (100.0%) | 966 (100.0%) |
Physical Housing Characteristics in Steilacoom
Housing Structures in Steilacoom
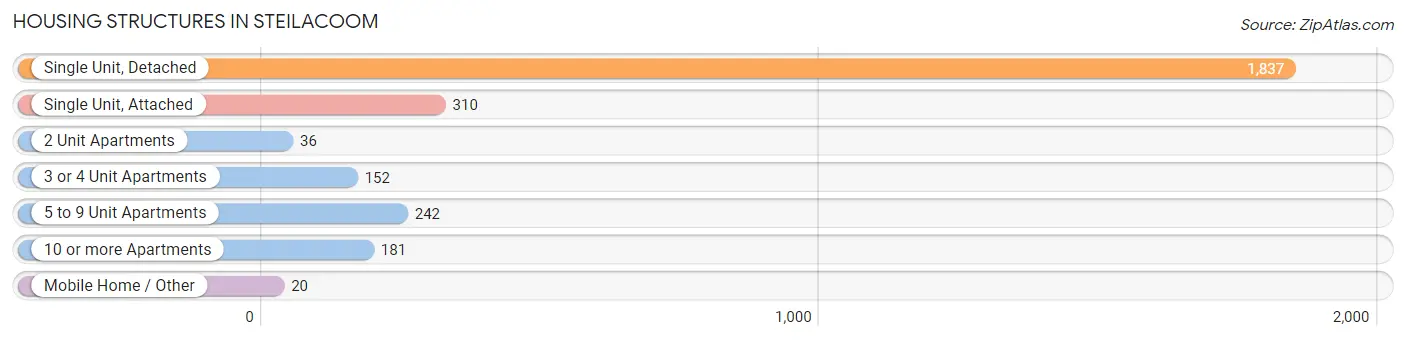
| Structure Type | # Housing Units | % Housing Units |
| Single Unit, Detached | 1,837 | 66.1% |
| Single Unit, Attached | 310 | 11.2% |
| 2 Unit Apartments | 36 | 1.3% |
| 3 or 4 Unit Apartments | 152 | 5.5% |
| 5 to 9 Unit Apartments | 242 | 8.7% |
| 10 or more Apartments | 181 | 6.5% |
| Mobile Home / Other | 20 | 0.7% |
| Total | 2,778 | 100.0% |
Housing Structures by Occupancy in Steilacoom
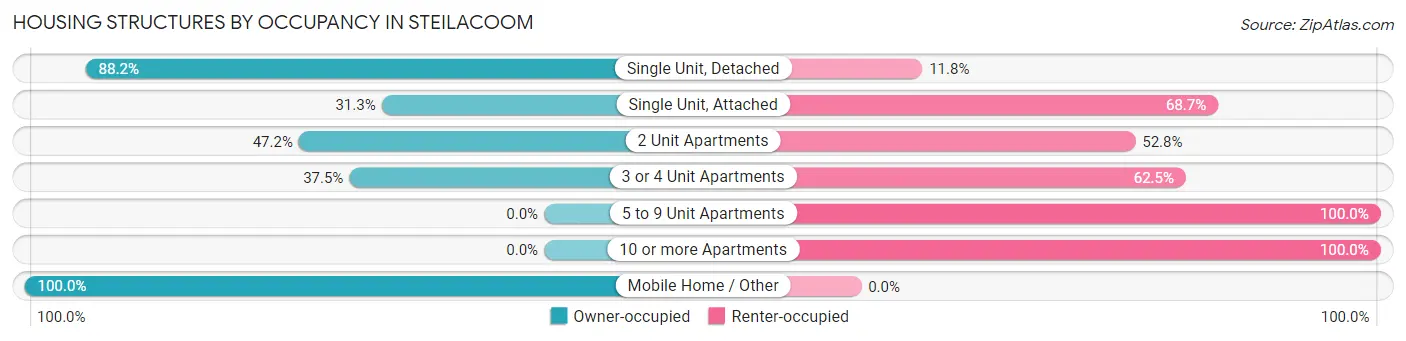
| Structure Type | Owner-occupied | Renter-occupied |
| Single Unit, Detached | 1,621 (88.2%) | 216 (11.8%) |
| Single Unit, Attached | 97 (31.3%) | 213 (68.7%) |
| 2 Unit Apartments | 17 (47.2%) | 19 (52.8%) |
| 3 or 4 Unit Apartments | 57 (37.5%) | 95 (62.5%) |
| 5 to 9 Unit Apartments | 0 (0.0%) | 242 (100.0%) |
| 10 or more Apartments | 0 (0.0%) | 181 (100.0%) |
| Mobile Home / Other | 20 (100.0%) | 0 (0.0%) |
| Total | 1,812 (65.2%) | 966 (34.8%) |
Housing Structures by Number of Rooms in Steilacoom
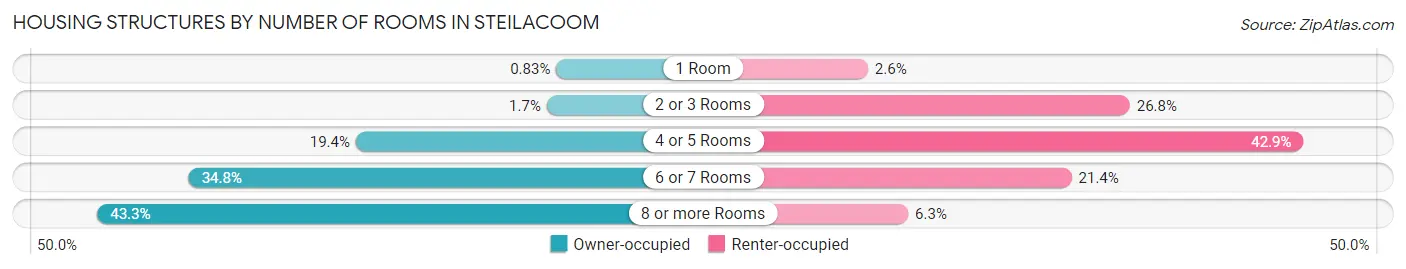
| Number of Rooms | Owner-occupied | Renter-occupied |
| 1 Room | 15 (0.8%) | 25 (2.6%) |
| 2 or 3 Rooms | 31 (1.7%) | 259 (26.8%) |
| 4 or 5 Rooms | 351 (19.4%) | 414 (42.9%) |
| 6 or 7 Rooms | 631 (34.8%) | 207 (21.4%) |
| 8 or more Rooms | 784 (43.3%) | 61 (6.3%) |
| Total | 1,812 (100.0%) | 966 (100.0%) |
Housing Structure by Heating Type in Steilacoom
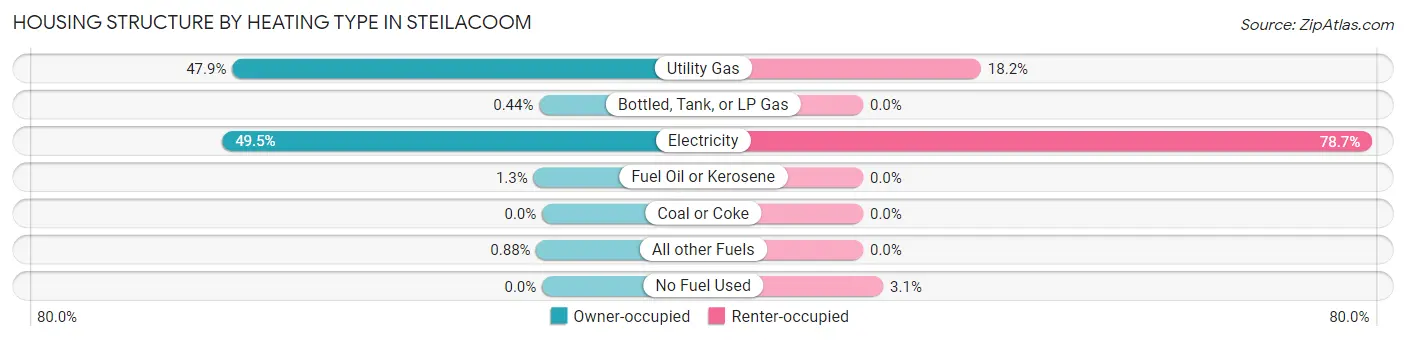
| Heating Type | Owner-occupied | Renter-occupied |
| Utility Gas | 868 (47.9%) | 176 (18.2%) |
| Bottled, Tank, or LP Gas | 8 (0.4%) | 0 (0.0%) |
| Electricity | 896 (49.4%) | 760 (78.7%) |
| Fuel Oil or Kerosene | 24 (1.3%) | 0 (0.0%) |
| Coal or Coke | 0 (0.0%) | 0 (0.0%) |
| All other Fuels | 16 (0.9%) | 0 (0.0%) |
| No Fuel Used | 0 (0.0%) | 30 (3.1%) |
| Total | 1,812 (100.0%) | 966 (100.0%) |
Household Vehicle Usage in Steilacoom
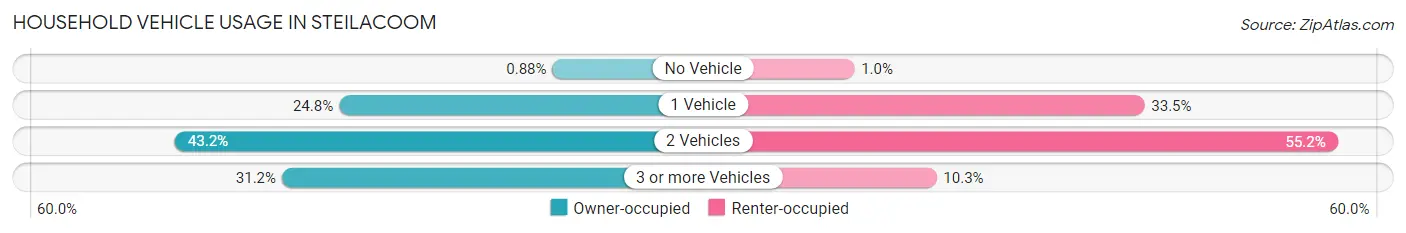
| Vehicles per Household | Owner-occupied | Renter-occupied |
| No Vehicle | 16 (0.9%) | 10 (1.0%) |
| 1 Vehicle | 449 (24.8%) | 324 (33.5%) |
| 2 Vehicles | 782 (43.2%) | 533 (55.2%) |
| 3 or more Vehicles | 565 (31.2%) | 99 (10.2%) |
| Total | 1,812 (100.0%) | 966 (100.0%) |
Real Estate & Mortgages in Steilacoom
Real Estate and Mortgage Overview in Steilacoom
| Characteristic | Without Mortgage | With Mortgage |
| Housing Units | 639 | 1,173 |
| Median Property Value | $543,000 | $555,000 |
| Median Household Income | $103,630 | $495 |
| Monthly Housing Costs | $790 | $316 |
| Real Estate Taxes | $4,835 | $0 |
Property Value by Mortgage Status in Steilacoom
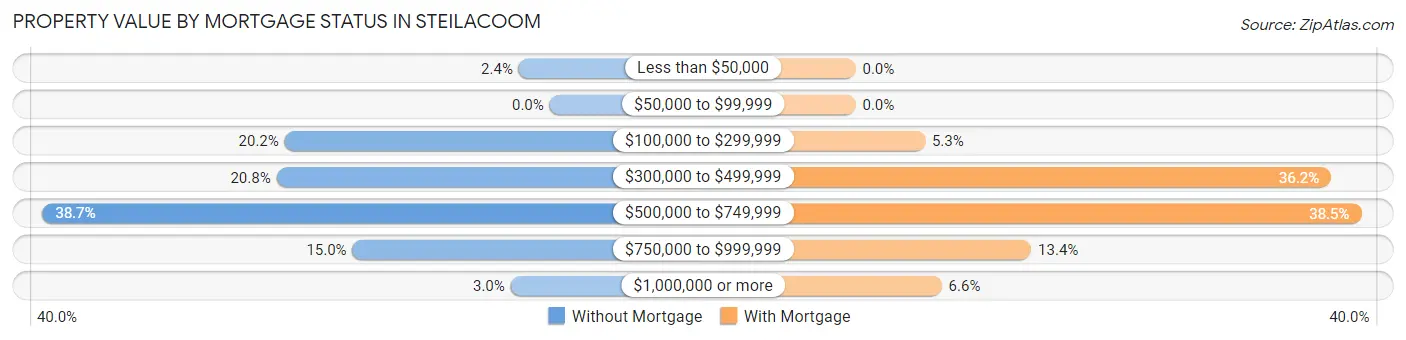
| Property Value | Without Mortgage | With Mortgage |
| Less than $50,000 | 15 (2.4%) | 0 (0.0%) |
| $50,000 to $99,999 | 0 (0.0%) | 0 (0.0%) |
| $100,000 to $299,999 | 129 (20.2%) | 62 (5.3%) |
| $300,000 to $499,999 | 133 (20.8%) | 425 (36.2%) |
| $500,000 to $749,999 | 247 (38.7%) | 452 (38.5%) |
| $750,000 to $999,999 | 96 (15.0%) | 157 (13.4%) |
| $1,000,000 or more | 19 (3.0%) | 77 (6.6%) |
| Total | 639 (100.0%) | 1,173 (100.0%) |
Household Income by Mortgage Status in Steilacoom
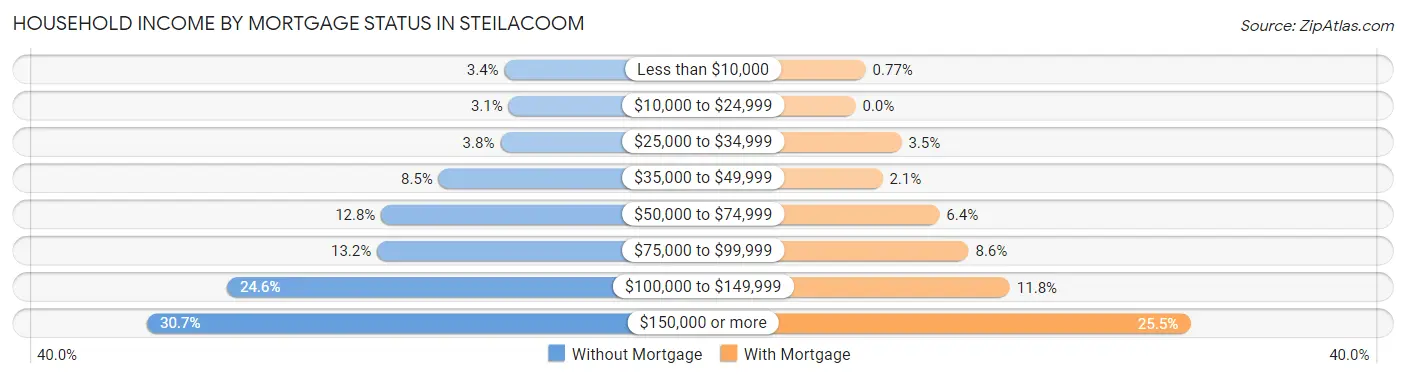
| Household Income | Without Mortgage | With Mortgage |
| Less than $10,000 | 22 (3.4%) | 9 (0.8%) |
| $10,000 to $24,999 | 20 (3.1%) | 0 (0.0%) |
| $25,000 to $34,999 | 24 (3.8%) | 41 (3.5%) |
| $35,000 to $49,999 | 54 (8.5%) | 24 (2.1%) |
| $50,000 to $74,999 | 82 (12.8%) | 75 (6.4%) |
| $75,000 to $99,999 | 84 (13.2%) | 101 (8.6%) |
| $100,000 to $149,999 | 157 (24.6%) | 138 (11.8%) |
| $150,000 or more | 196 (30.7%) | 299 (25.5%) |
| Total | 639 (100.0%) | 1,173 (100.0%) |
Property Value to Household Income Ratio in Steilacoom
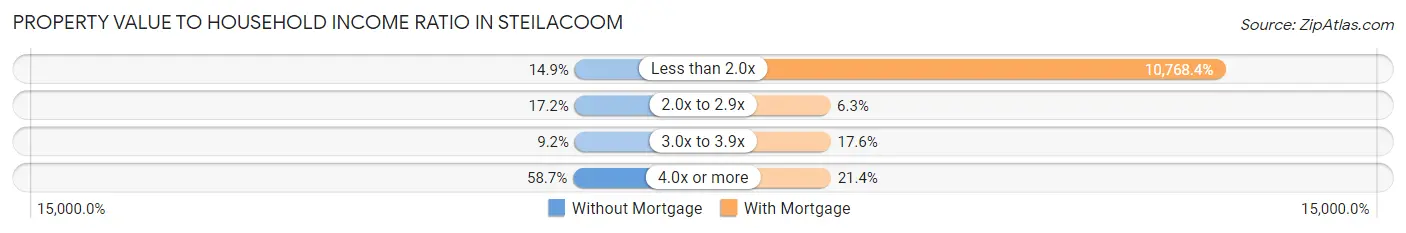
| Value-to-Income Ratio | Without Mortgage | With Mortgage |
| Less than 2.0x | 95 (14.9%) | 126,313 (10,768.4%) |
| 2.0x to 2.9x | 110 (17.2%) | 74 (6.3%) |
| 3.0x to 3.9x | 59 (9.2%) | 206 (17.6%) |
| 4.0x or more | 375 (58.7%) | 251 (21.4%) |
| Total | 639 (100.0%) | 1,173 (100.0%) |
Real Estate Taxes by Mortgage Status in Steilacoom
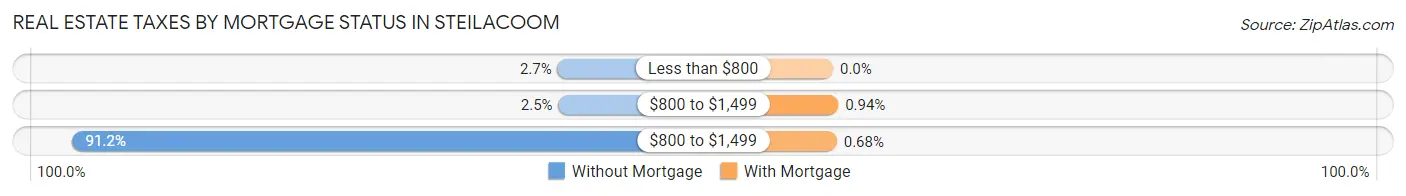
| Property Taxes | Without Mortgage | With Mortgage |
| Less than $800 | 17 (2.7%) | 0 (0.0%) |
| $800 to $1,499 | 16 (2.5%) | 11 (0.9%) |
| $800 to $1,499 | 583 (91.2%) | 8 (0.7%) |
| Total | 639 (100.0%) | 1,173 (100.0%) |
Health & Disability in Steilacoom
Health Insurance Coverage by Age in Steilacoom
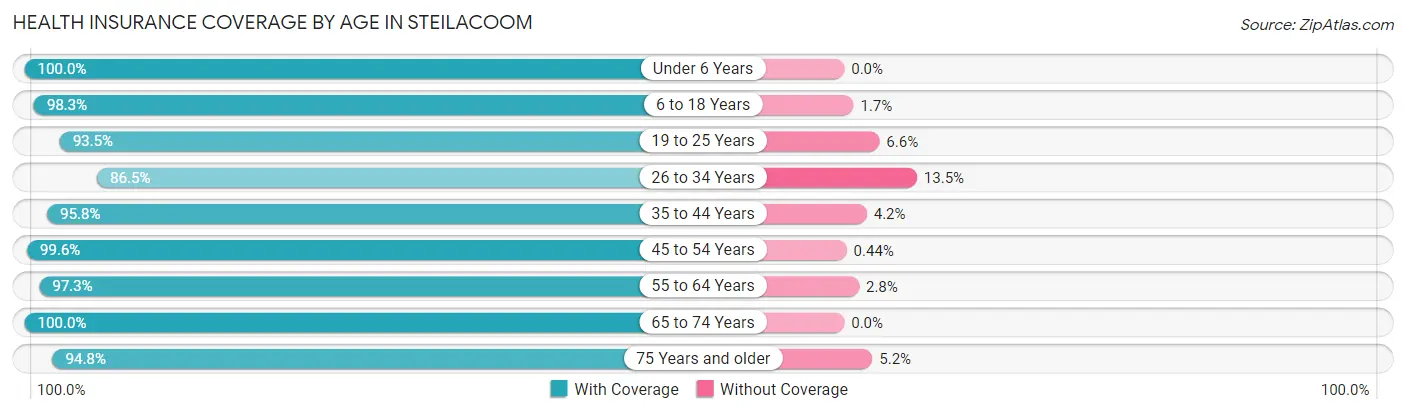
| Age Bracket | With Coverage | Without Coverage |
| Under 6 Years | 556 (100.0%) | 0 (0.0%) |
| 6 to 18 Years | 856 (98.3%) | 15 (1.7%) |
| 19 to 25 Years | 571 (93.4%) | 40 (6.6%) |
| 26 to 34 Years | 549 (86.5%) | 86 (13.5%) |
| 35 to 44 Years | 847 (95.8%) | 37 (4.2%) |
| 45 to 54 Years | 674 (99.6%) | 3 (0.4%) |
| 55 to 64 Years | 885 (97.3%) | 25 (2.8%) |
| 65 to 74 Years | 868 (100.0%) | 0 (0.0%) |
| 75 Years and older | 417 (94.8%) | 23 (5.2%) |
| Total | 6,223 (96.5%) | 229 (3.5%) |
Health Insurance Coverage by Citizenship Status in Steilacoom
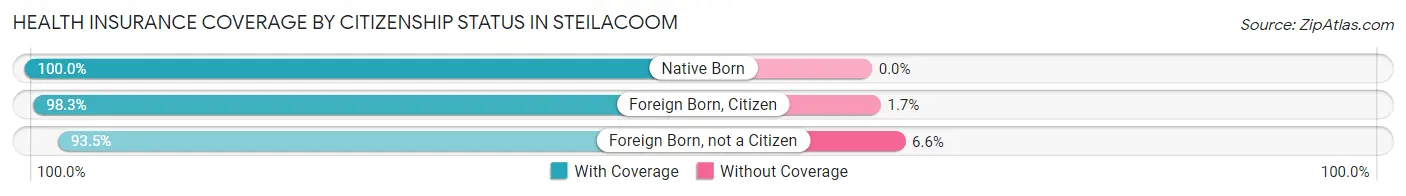
| Citizenship Status | With Coverage | Without Coverage |
| Native Born | 556 (100.0%) | 0 (0.0%) |
| Foreign Born, Citizen | 856 (98.3%) | 15 (1.7%) |
| Foreign Born, not a Citizen | 571 (93.4%) | 40 (6.6%) |
Health Insurance Coverage by Household Income in Steilacoom
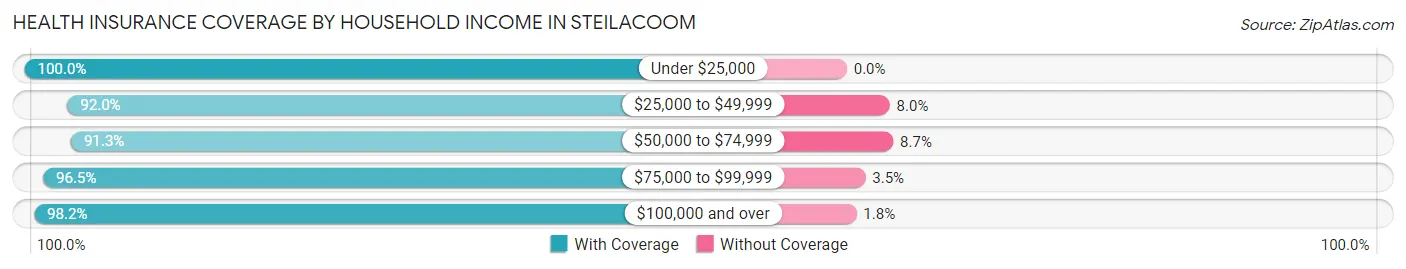
| Household Income | With Coverage | Without Coverage |
| Under $25,000 | 361 (100.0%) | 0 (0.0%) |
| $25,000 to $49,999 | 653 (92.0%) | 57 (8.0%) |
| $50,000 to $74,999 | 799 (91.3%) | 76 (8.7%) |
| $75,000 to $99,999 | 752 (96.5%) | 27 (3.5%) |
| $100,000 and over | 3,648 (98.2%) | 67 (1.8%) |
Public vs Private Health Insurance Coverage by Age in Steilacoom
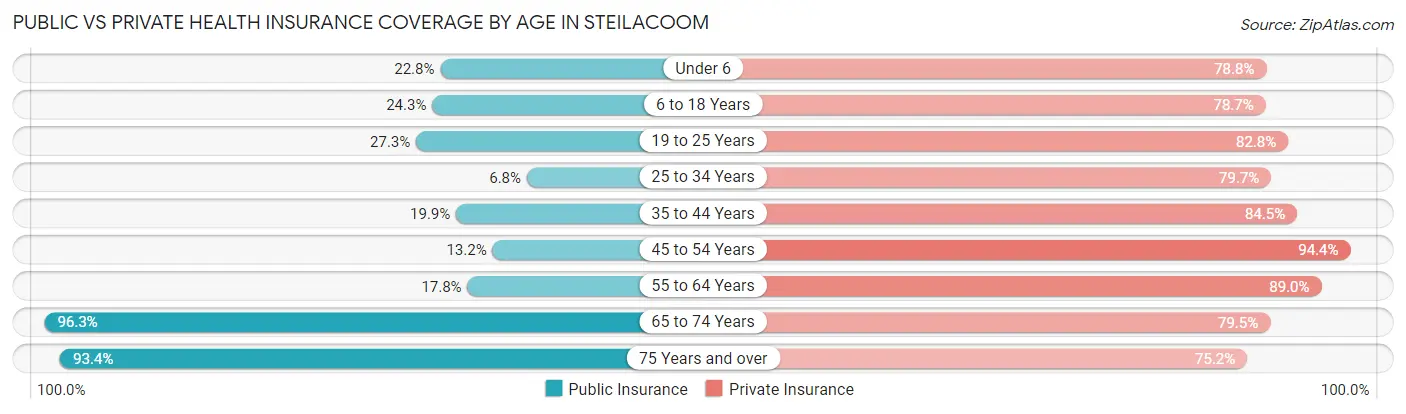
| Age Bracket | Public Insurance | Private Insurance |
| Under 6 | 127 (22.8%) | 438 (78.8%) |
| 6 to 18 Years | 212 (24.3%) | 685 (78.6%) |
| 19 to 25 Years | 167 (27.3%) | 506 (82.8%) |
| 25 to 34 Years | 43 (6.8%) | 506 (79.7%) |
| 35 to 44 Years | 176 (19.9%) | 747 (84.5%) |
| 45 to 54 Years | 89 (13.2%) | 639 (94.4%) |
| 55 to 64 Years | 162 (17.8%) | 810 (89.0%) |
| 65 to 74 Years | 836 (96.3%) | 690 (79.5%) |
| 75 Years and over | 411 (93.4%) | 331 (75.2%) |
| Total | 2,223 (34.4%) | 5,352 (83.0%) |
Disability Status by Sex by Age in Steilacoom
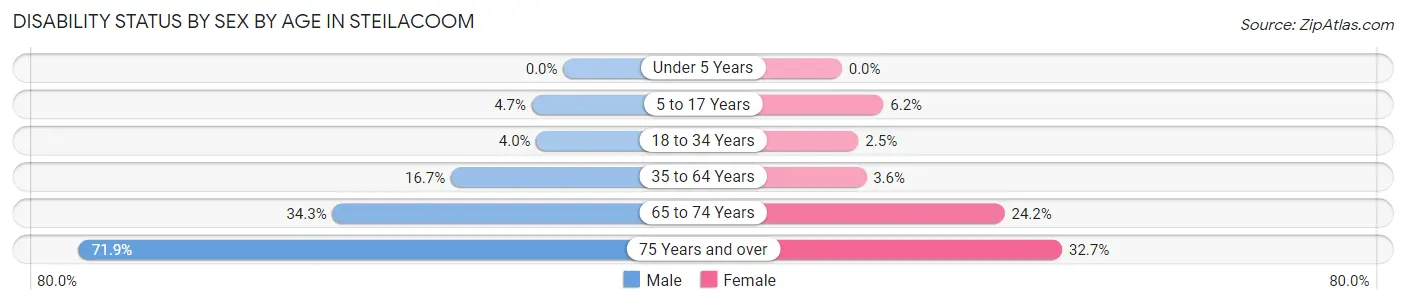
| Age Bracket | Male | Female |
| Under 5 Years | 0 (0.0%) | 0 (0.0%) |
| 5 to 17 Years | 17 (4.7%) | 29 (6.2%) |
| 18 to 34 Years | 24 (4.0%) | 19 (2.5%) |
| 35 to 64 Years | 219 (16.7%) | 42 (3.6%) |
| 65 to 74 Years | 133 (34.3%) | 116 (24.2%) |
| 75 Years and over | 123 (71.9%) | 88 (32.7%) |
Disability Class by Sex by Age in Steilacoom
Disability Class: Hearing Difficulty
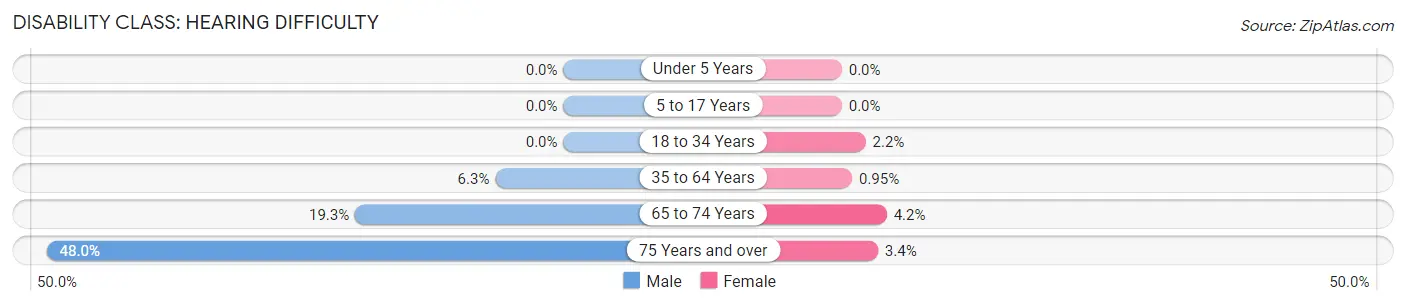
| Age Bracket | Male | Female |
| Under 5 Years | 0 (0.0%) | 0 (0.0%) |
| 5 to 17 Years | 0 (0.0%) | 0 (0.0%) |
| 18 to 34 Years | 0 (0.0%) | 17 (2.2%) |
| 35 to 64 Years | 83 (6.3%) | 11 (0.9%) |
| 65 to 74 Years | 75 (19.3%) | 20 (4.2%) |
| 75 Years and over | 82 (47.9%) | 9 (3.4%) |
Disability Class: Vision Difficulty
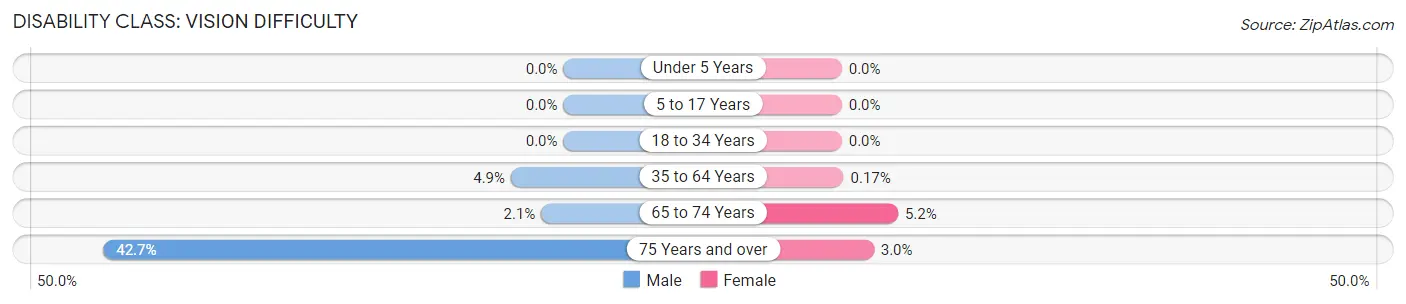
| Age Bracket | Male | Female |
| Under 5 Years | 0 (0.0%) | 0 (0.0%) |
| 5 to 17 Years | 0 (0.0%) | 0 (0.0%) |
| 18 to 34 Years | 0 (0.0%) | 0 (0.0%) |
| 35 to 64 Years | 64 (4.9%) | 2 (0.2%) |
| 65 to 74 Years | 8 (2.1%) | 25 (5.2%) |
| 75 Years and over | 73 (42.7%) | 8 (3.0%) |
Disability Class: Cognitive Difficulty
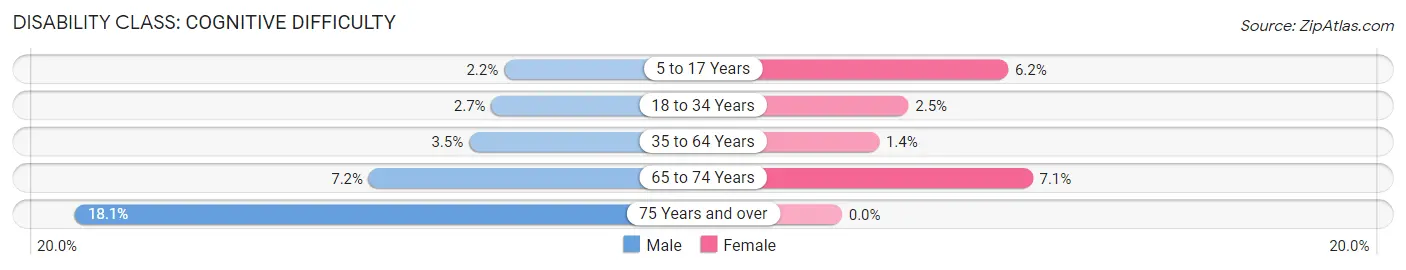
| Age Bracket | Male | Female |
| 5 to 17 Years | 8 (2.2%) | 29 (6.2%) |
| 18 to 34 Years | 16 (2.7%) | 19 (2.5%) |
| 35 to 64 Years | 46 (3.5%) | 16 (1.4%) |
| 65 to 74 Years | 28 (7.2%) | 34 (7.1%) |
| 75 Years and over | 31 (18.1%) | 0 (0.0%) |
Disability Class: Ambulatory Difficulty
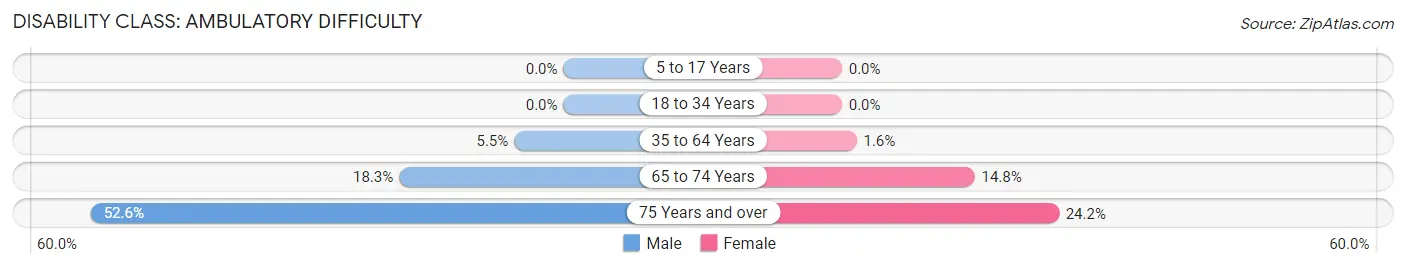
| Age Bracket | Male | Female |
| 5 to 17 Years | 0 (0.0%) | 0 (0.0%) |
| 18 to 34 Years | 0 (0.0%) | 0 (0.0%) |
| 35 to 64 Years | 72 (5.5%) | 19 (1.6%) |
| 65 to 74 Years | 71 (18.3%) | 71 (14.8%) |
| 75 Years and over | 90 (52.6%) | 65 (24.2%) |
Disability Class: Self-Care Difficulty
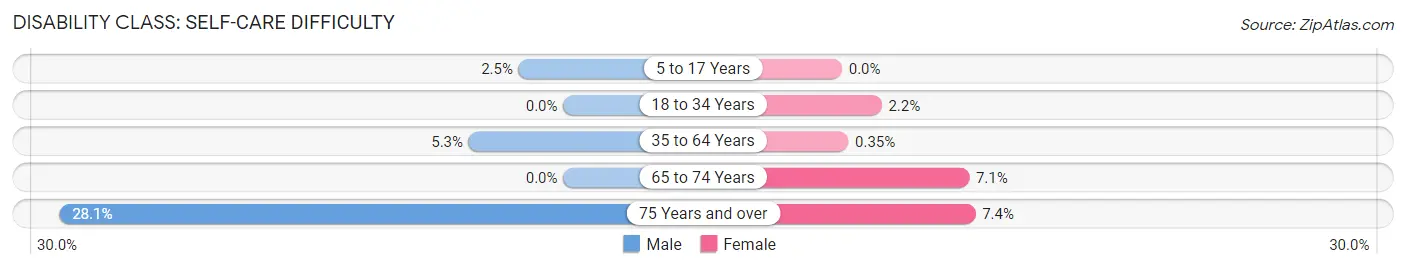
| Age Bracket | Male | Female |
| 5 to 17 Years | 9 (2.5%) | 0 (0.0%) |
| 18 to 34 Years | 0 (0.0%) | 17 (2.2%) |
| 35 to 64 Years | 69 (5.3%) | 4 (0.4%) |
| 65 to 74 Years | 0 (0.0%) | 34 (7.1%) |
| 75 Years and over | 48 (28.1%) | 20 (7.4%) |
Technology Access in Steilacoom
Computing Device Access in Steilacoom
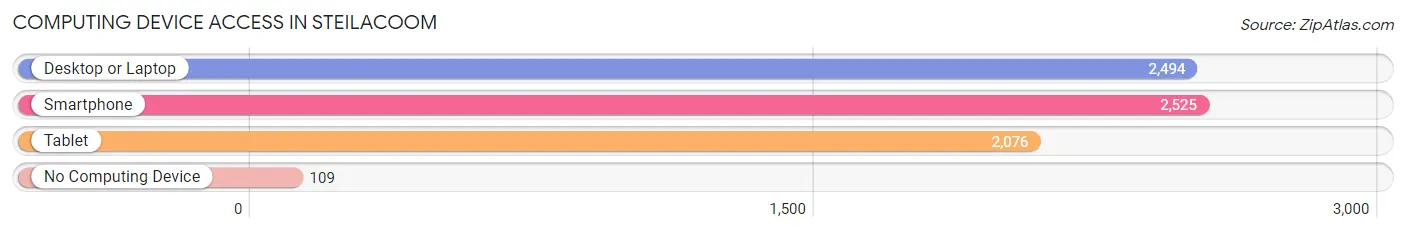
| Device Type | # Households | % Households |
| Desktop or Laptop | 2,494 | 89.8% |
| Smartphone | 2,525 | 90.9% |
| Tablet | 2,076 | 74.7% |
| No Computing Device | 109 | 3.9% |
| Total | 2,778 | 100.0% |
Internet Access in Steilacoom
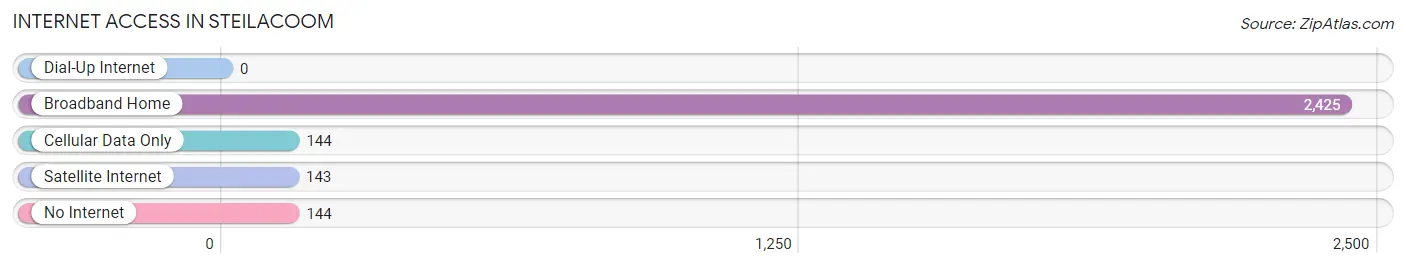
| Internet Type | # Households | % Households |
| Dial-Up Internet | 0 | 0.0% |
| Broadband Home | 2,425 | 87.3% |
| Cellular Data Only | 144 | 5.2% |
| Satellite Internet | 143 | 5.1% |
| No Internet | 144 | 5.2% |
| Total | 2,778 | 100.0% |
Steilacoom Summary
Steilacoom, Washington is a small town located in Pierce County, Washington, United States. It is situated on the shores of Puget Sound, just south of Tacoma. The town was founded in 1854 and is the oldest incorporated town in Washington State. Steilacoom has a population of 6,719 as of the 2010 census.
History
The area that is now Steilacoom was first inhabited by the Nisqually and Puyallup tribes. The first European settlers arrived in the area in 1841, led by Lafayette Balch. Balch established a trading post and a ferry service across the sound. In 1854, the town was officially incorporated and named Steilacoom, after the nearby Steilacoom tribe.
The town quickly grew and became a major port for the region. It was the first town in Washington to have a post office and a school. In 1858, the first newspaper in the state was published in Steilacoom. The town was also the first to have a public library and a fire department.
During the Civil War, Steilacoom was a major supply center for the Union Army. The town was also the site of the first military prison in the state. After the war, the town continued to grow and prosper. In the late 19th century, the town was a popular tourist destination, with many visitors coming to enjoy the beaches and the nearby mountains.
Geography
Steilacoom is located in Pierce County, Washington, on the shores of Puget Sound. The town is situated on a peninsula, with the town of Anderson Island to the south and the town of Lakewood to the east. The town is bordered by the Chambers Bay Golf Course to the north and the Nisqually River to the west.
The town has a total area of 4.2 square miles, all of which is land. The town has a mild climate, with temperatures ranging from the mid-30s in the winter to the mid-70s in the summer.
Economy
The economy of Steilacoom is largely based on tourism and services. The town is home to several restaurants, shops, and other businesses. The town is also home to a number of government offices, including the Pierce County Courthouse and the Steilacoom Historical Museum.
The town is also home to a number of military installations, including Joint Base Lewis-McChord and the Naval Magazine Indian Island. These installations provide a significant number of jobs to the local economy.
Demographics
As of the 2010 census, Steilacoom had a population of 6,719. The racial makeup of the town was 87.3% White, 4.2% African American, 1.2% Native American, 2.2% Asian, 0.3% Pacific Islander, and 4.0% from other races. Hispanic or Latino of any race were 6.2% of the population.
The median income for a household in the town was $50,945, and the median income for a family was $60,945. The per capita income for the town was $25,945. About 8.2% of families and 10.2% of the population were below the poverty line, including 14.2% of those under age 18 and 6.2% of those age 65 or over.
Steilacoom is a small town with a rich history and a vibrant economy. The town is home to a diverse population and is a popular tourist destination. The town is also home to a number of military installations, providing a significant number of jobs to the local economy.
Common Questions
What is Per Capita Income in Steilacoom?
Per Capita income in Steilacoom is $48,678.
What is the Median Family Income in Steilacoom?
Median Family Income in Steilacoom is $119,514.
What is the Median Household income in Steilacoom?
Median Household Income in Steilacoom is $94,708.
What is Income or Wage Gap in Steilacoom?
Income or Wage Gap in Steilacoom is 20.6%.
Women in Steilacoom earn 79.4 cents for every dollar earned by a man.
What is Inequality or Gini Index in Steilacoom?
Inequality or Gini Index in Steilacoom is 0.40.
What is the Total Population of Steilacoom?
Total Population of Steilacoom is 6,680.
What is the Total Male Population of Steilacoom?
Total Male Population of Steilacoom is 3,221.
What is the Total Female Population of Steilacoom?
Total Female Population of Steilacoom is 3,459.
What is the Ratio of Males per 100 Females in Steilacoom?
There are 93.12 Males per 100 Females in Steilacoom.
What is the Ratio of Females per 100 Males in Steilacoom?
There are 107.39 Females per 100 Males in Steilacoom.
What is the Median Population Age in Steilacoom?
Median Population Age in Steilacoom is 38.4 Years.
What is the Average Family Size in Steilacoom
Average Family Size in Steilacoom is 2.8 People.
What is the Average Household Size in Steilacoom
Average Household Size in Steilacoom is 2.4 People.
How Large is the Labor Force in Steilacoom?
There are 3,360 People in the Labor Forcein in Steilacoom.
What is the Percentage of People in the Labor Force in Steilacoom?
61.5% of People are in the Labor Force in Steilacoom.
What is the Unemployment Rate in Steilacoom?
Unemployment Rate in Steilacoom is 3.3%.