Prairie Ridge, WA Map & Demographics
Prairie Ridge Map
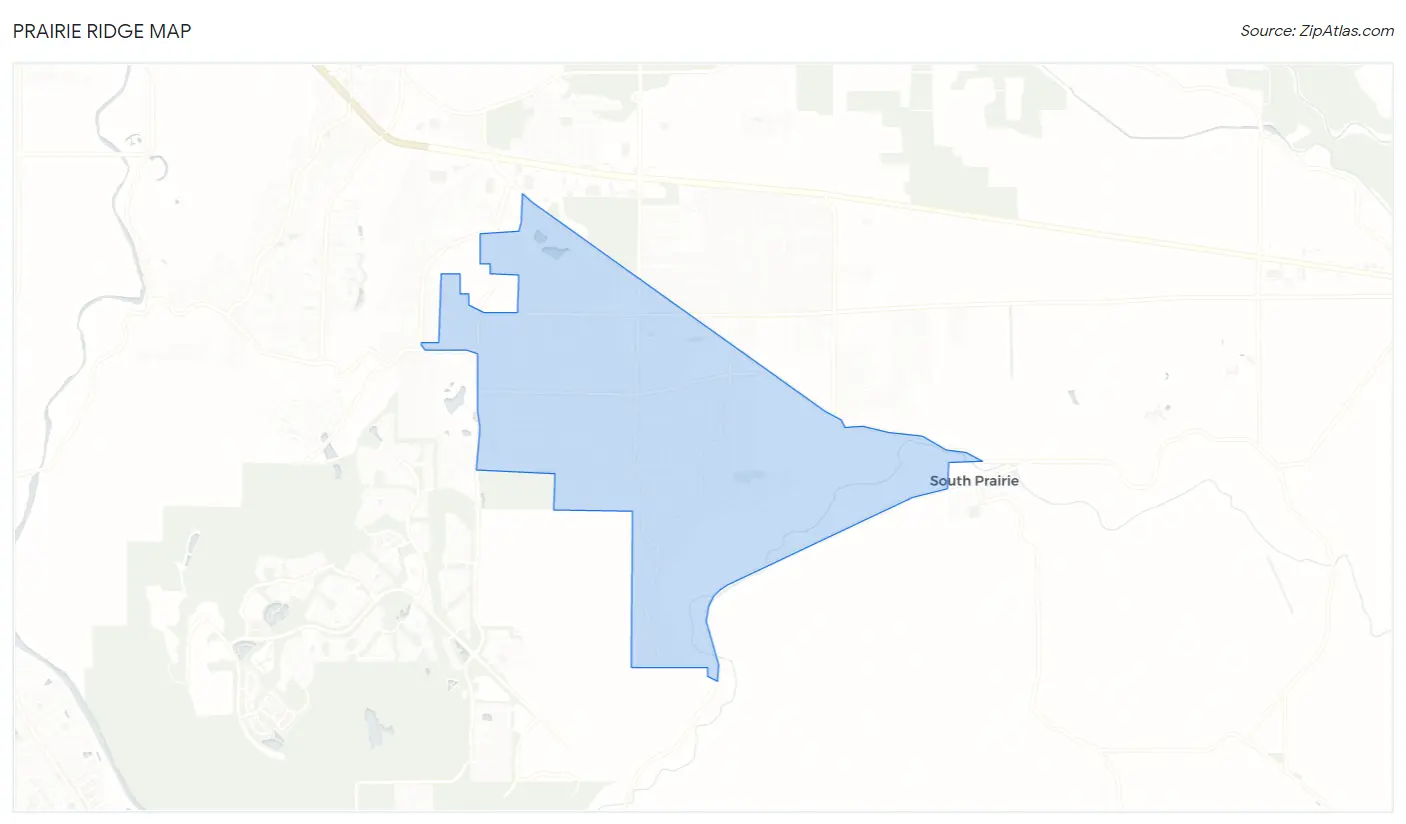
Prairie Ridge Overview
$42,581
PER CAPITA INCOME
$105,821
AVG FAMILY INCOME
$102,801
AVG HOUSEHOLD INCOME
24.7%
WAGE / INCOME GAP [ % ]
75.3¢/ $1
WAGE / INCOME GAP [ $ ]
0.38
INEQUALITY / GINI INDEX
12,444
TOTAL POPULATION
6,402
MALE POPULATION
6,042
FEMALE POPULATION
105.96
MALES / 100 FEMALES
94.38
FEMALES / 100 MALES
36.3
MEDIAN AGE
3.2
AVG FAMILY SIZE
2.9
AVG HOUSEHOLD SIZE
6,685
LABOR FORCE [ PEOPLE ]
71.1%
PERCENT IN LABOR FORCE
7.0%
UNEMPLOYMENT RATE
Income in Prairie Ridge
Income Overview in Prairie Ridge
Per Capita Income in Prairie Ridge is $42,581, while median incomes of families and households are $105,821 and $102,801 respectively.
| Characteristic | Number | Measure |
| Per Capita Income | 12,444 | $42,581 |
| Median Family Income | 3,418 | $105,821 |
| Mean Family Income | 3,418 | $127,643 |
| Median Household Income | 4,292 | $102,801 |
| Mean Household Income | 4,292 | $121,772 |
| Income Deficit | 3,418 | $0 |
| Wage / Income Gap (%) | 12,444 | 24.71% |
| Wage / Income Gap ($) | 12,444 | 75.29¢ per $1 |
| Gini / Inequality Index | 12,444 | 0.38 |
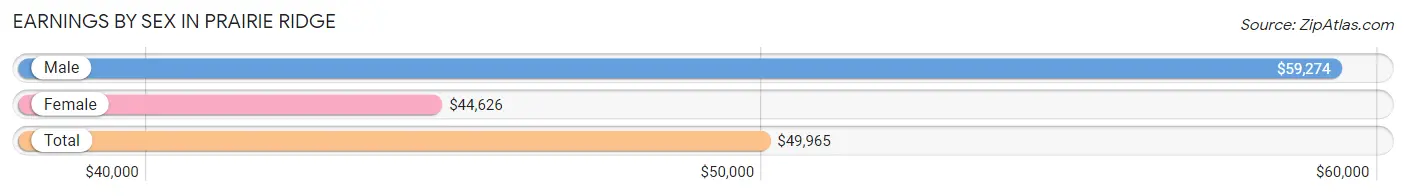
Earnings by Sex in Prairie Ridge
Average Earnings in Prairie Ridge are $49,965, $59,274 for men and $44,626 for women, a difference of 24.7%.
| Sex | Number | Average Earnings |
| Male | 3,789 (55.0%) | $59,274 |
| Female | 3,101 (45.0%) | $44,626 |
| Total | 6,890 (100.0%) | $49,965 |
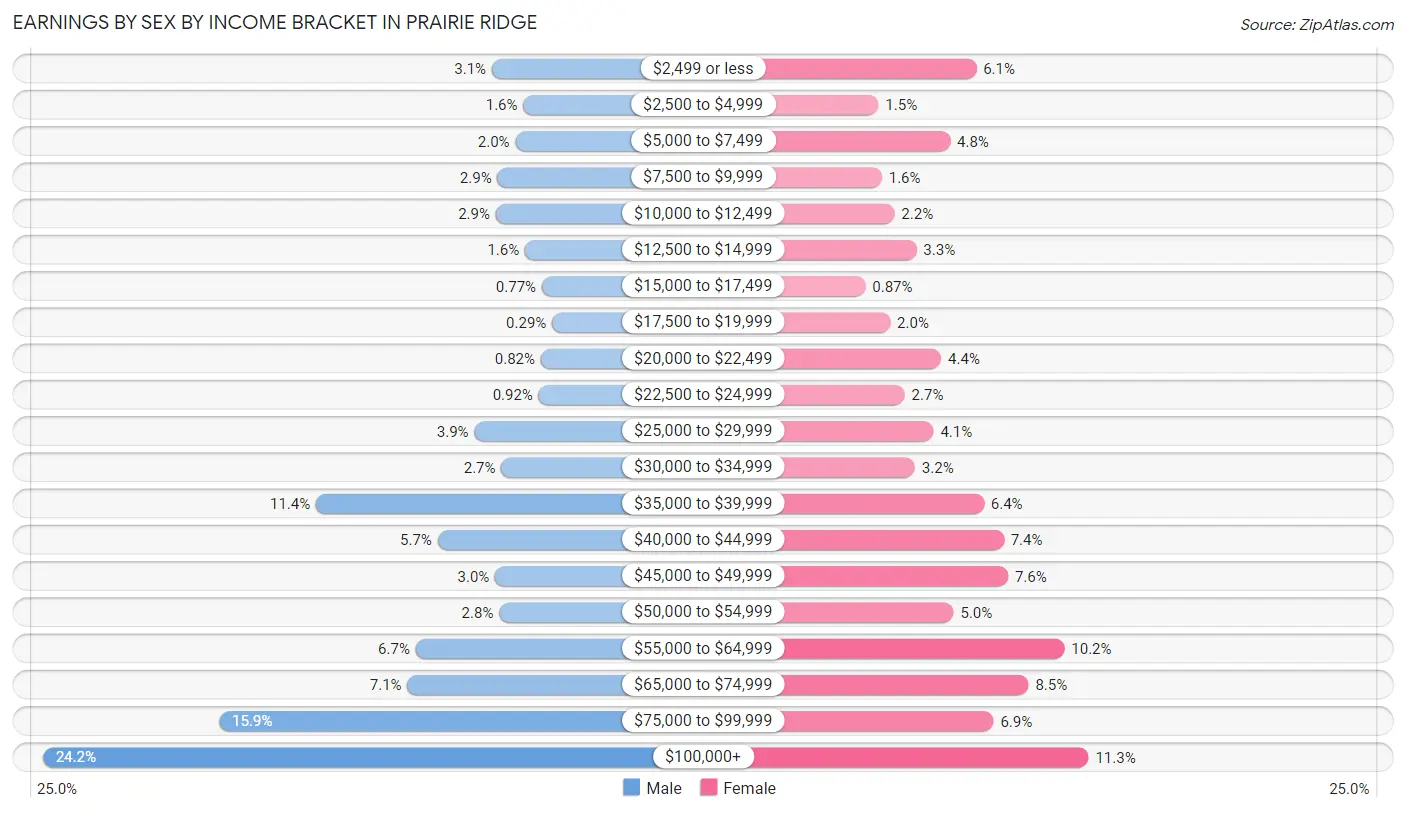
Earnings by Sex by Income Bracket in Prairie Ridge
The most common earnings brackets in Prairie Ridge are $100,000+ for men (915 | 24.1%) and $100,000+ for women (351 | 11.3%).
| Income | Male | Female |
| $2,499 or less | 118 (3.1%) | 188 (6.1%) |
| $2,500 to $4,999 | 62 (1.6%) | 46 (1.5%) |
| $5,000 to $7,499 | 76 (2.0%) | 150 (4.8%) |
| $7,500 to $9,999 | 108 (2.9%) | 51 (1.6%) |
| $10,000 to $12,499 | 111 (2.9%) | 69 (2.2%) |
| $12,500 to $14,999 | 59 (1.6%) | 101 (3.3%) |
| $15,000 to $17,499 | 29 (0.8%) | 27 (0.9%) |
| $17,500 to $19,999 | 11 (0.3%) | 63 (2.0%) |
| $20,000 to $22,499 | 31 (0.8%) | 137 (4.4%) |
| $22,500 to $24,999 | 35 (0.9%) | 84 (2.7%) |
| $25,000 to $29,999 | 149 (3.9%) | 126 (4.1%) |
| $30,000 to $34,999 | 101 (2.7%) | 99 (3.2%) |
| $35,000 to $39,999 | 430 (11.4%) | 199 (6.4%) |
| $40,000 to $44,999 | 214 (5.7%) | 228 (7.3%) |
| $45,000 to $49,999 | 112 (3.0%) | 234 (7.5%) |
| $50,000 to $54,999 | 105 (2.8%) | 155 (5.0%) |
| $55,000 to $64,999 | 253 (6.7%) | 316 (10.2%) |
| $65,000 to $74,999 | 268 (7.1%) | 264 (8.5%) |
| $75,000 to $99,999 | 602 (15.9%) | 213 (6.9%) |
| $100,000+ | 915 (24.1%) | 351 (11.3%) |
| Total | 3,789 (100.0%) | 3,101 (100.0%) |
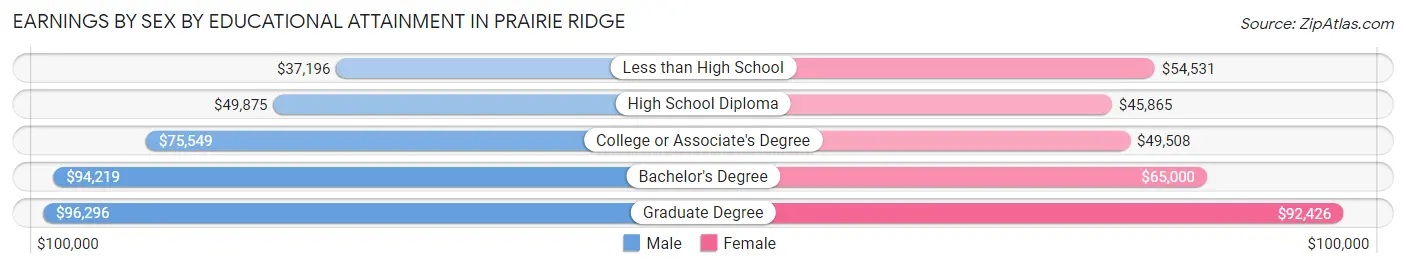
Earnings by Sex by Educational Attainment in Prairie Ridge
Average earnings in Prairie Ridge are $70,021 for men and $49,939 for women, a difference of 28.7%. Men with an educational attainment of graduate degree enjoy the highest average annual earnings of $96,296, while those with less than high school education earn the least with $37,196. Women with an educational attainment of graduate degree earn the most with the average annual earnings of $92,426, while those with high school diploma education have the smallest earnings of $45,865.
| Educational Attainment | Male Income | Female Income |
| Less than High School | $37,196 | $54,531 |
| High School Diploma | $49,875 | $45,865 |
| College or Associate's Degree | $75,549 | $49,508 |
| Bachelor's Degree | $94,219 | $65,000 |
| Graduate Degree | $96,296 | $92,426 |
| Total | $70,021 | $49,939 |
Family Income in Prairie Ridge
Family Income Brackets in Prairie Ridge
According to the Prairie Ridge family income data, there are 930 families falling into the $100,000 to $149,999 income range, which is the most common income bracket and makes up 27.2% of all families. Conversely, the $10,000 to $14,999 income bracket is the least frequent group with only 10 families (0.3%) belonging to this category.
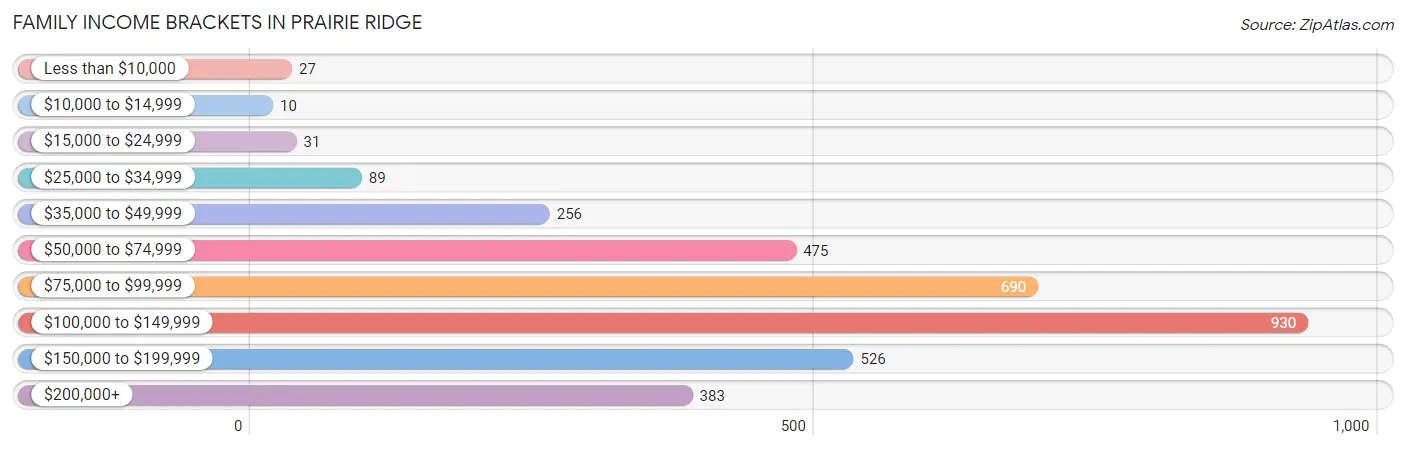
| Income Bracket | # Families | % Families |
| Less than $10,000 | 27 | 0.8% |
| $10,000 to $14,999 | 10 | 0.3% |
| $15,000 to $24,999 | 31 | 0.9% |
| $25,000 to $34,999 | 89 | 2.6% |
| $35,000 to $49,999 | 256 | 7.5% |
| $50,000 to $74,999 | 475 | 13.9% |
| $75,000 to $99,999 | 690 | 20.2% |
| $100,000 to $149,999 | 930 | 27.2% |
| $150,000 to $199,999 | 526 | 15.4% |
| $200,000+ | 383 | 11.2% |
Family Income by Famaliy Size in Prairie Ridge
3-person families (553 | 16.2%) account for the highest median family income in Prairie Ridge with $127,159 per family, while 2-person families (1,505 | 44.0%) have the highest median income of $47,754 per family member.
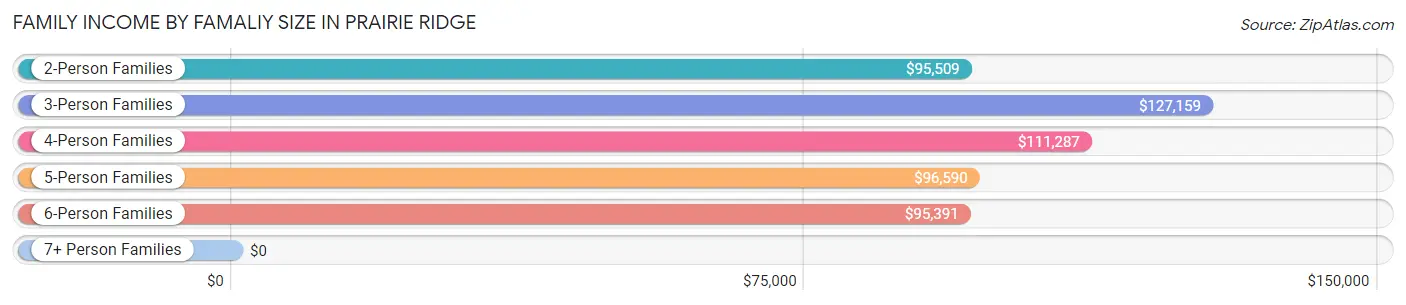
| Income Bracket | # Families | Median Income |
| 2-Person Families | 1,505 (44.0%) | $95,509 |
| 3-Person Families | 553 (16.2%) | $127,159 |
| 4-Person Families | 870 (25.5%) | $111,287 |
| 5-Person Families | 379 (11.1%) | $96,590 |
| 6-Person Families | 63 (1.8%) | $95,391 |
| 7+ Person Families | 48 (1.4%) | $0 |
| Total | 3,418 (100.0%) | $105,821 |
Family Income by Number of Earners in Prairie Ridge
The median family income in Prairie Ridge is $105,821, with families comprising 3+ earners (469) having the highest median family income of $157,083, while families with no earners (283) have the lowest median family income of $44,018, accounting for 13.7% and 8.3% of families, respectively.
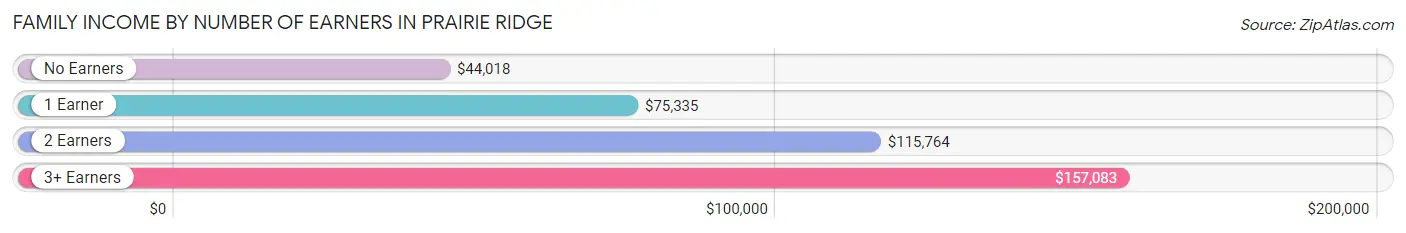
| Number of Earners | # Families | Median Income |
| No Earners | 283 (8.3%) | $44,018 |
| 1 Earner | 1,051 (30.7%) | $75,335 |
| 2 Earners | 1,615 (47.2%) | $115,764 |
| 3+ Earners | 469 (13.7%) | $157,083 |
| Total | 3,418 (100.0%) | $105,821 |
Household Income in Prairie Ridge
Household Income Brackets in Prairie Ridge
With 1,133 households falling in the category, the $100,000 to $149,999 income range is the most frequent in Prairie Ridge, accounting for 26.4% of all households. In contrast, only 9 households (0.2%) fall into the $10,000 to $14,999 income bracket, making it the least populous group.
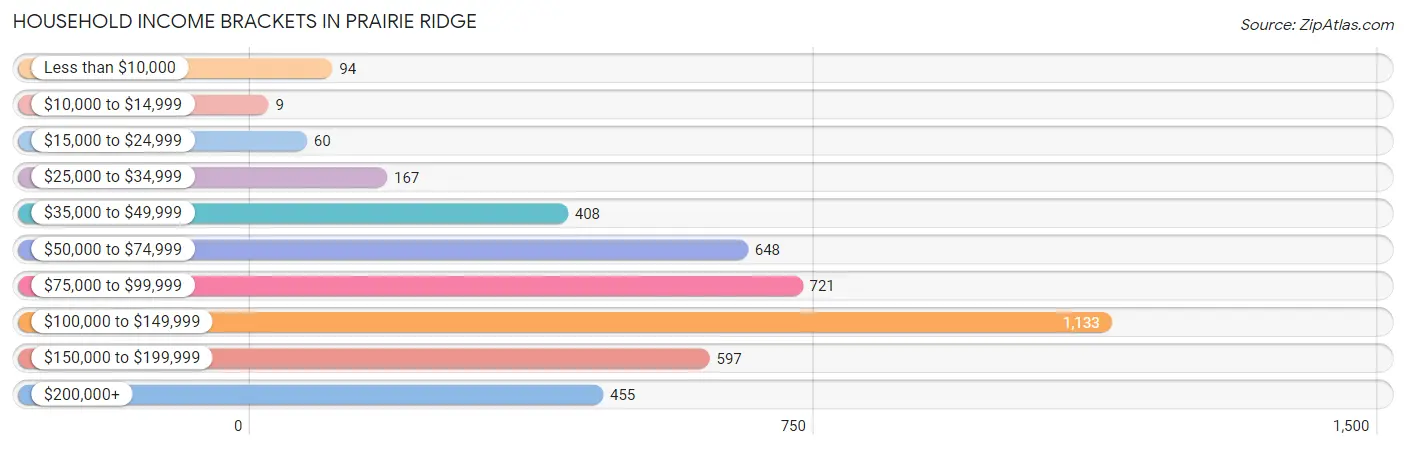
| Income Bracket | # Households | % Households |
| Less than $10,000 | 94 | 2.2% |
| $10,000 to $14,999 | 9 | 0.2% |
| $15,000 to $24,999 | 60 | 1.4% |
| $25,000 to $34,999 | 167 | 3.9% |
| $35,000 to $49,999 | 408 | 9.5% |
| $50,000 to $74,999 | 648 | 15.1% |
| $75,000 to $99,999 | 721 | 16.8% |
| $100,000 to $149,999 | 1,133 | 26.4% |
| $150,000 to $199,999 | 597 | 13.9% |
| $200,000+ | 455 | 10.6% |
Household Income by Householder Age in Prairie Ridge
The median household income in Prairie Ridge is $102,801, with the highest median household income of $110,485 found in the 25 to 44 years age bracket for the primary householder. A total of 1,462 households (34.1%) fall into this category. Meanwhile, the 15 to 24 years age bracket for the primary householder has the lowest median household income of $0, with 97 households (2.3%) in this group.
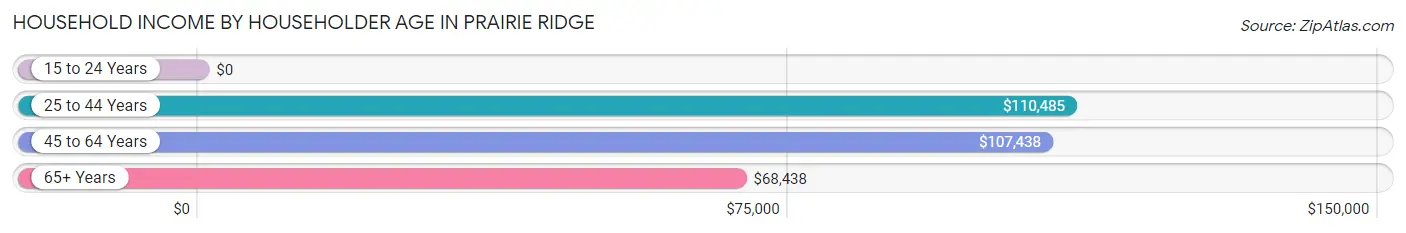
| Income Bracket | # Households | Median Income |
| 15 to 24 Years | 97 (2.3%) | $0 |
| 25 to 44 Years | 1,462 (34.1%) | $110,485 |
| 45 to 64 Years | 1,957 (45.6%) | $107,438 |
| 65+ Years | 776 (18.1%) | $68,438 |
| Total | 4,292 (100.0%) | $102,801 |
Poverty in Prairie Ridge
Income Below Poverty by Sex and Age in Prairie Ridge
With 2.6% poverty level for males and 2.7% for females among the residents of Prairie Ridge, 12 to 14 year old males and 35 to 44 year old females are the most vulnerable to poverty, with 31 males (10.6%) and 78 females (8.4%) in their respective age groups living below the poverty level.
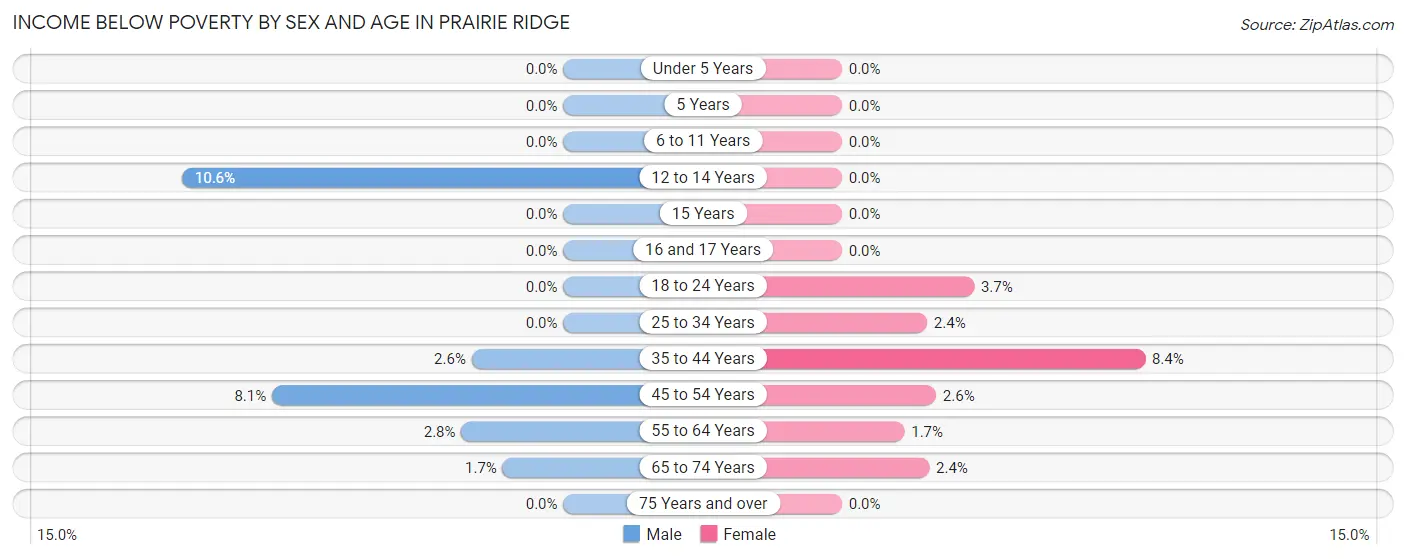
| Age Bracket | Male | Female |
| Under 5 Years | 0 (0.0%) | 0 (0.0%) |
| 5 Years | 0 (0.0%) | 0 (0.0%) |
| 6 to 11 Years | 0 (0.0%) | 0 (0.0%) |
| 12 to 14 Years | 31 (10.6%) | 0 (0.0%) |
| 15 Years | 0 (0.0%) | 0 (0.0%) |
| 16 and 17 Years | 0 (0.0%) | 0 (0.0%) |
| 18 to 24 Years | 0 (0.0%) | 21 (3.7%) |
| 25 to 34 Years | 0 (0.0%) | 18 (2.4%) |
| 35 to 44 Years | 22 (2.5%) | 78 (8.4%) |
| 45 to 54 Years | 85 (8.1%) | 20 (2.6%) |
| 55 to 64 Years | 21 (2.8%) | 15 (1.7%) |
| 65 to 74 Years | 8 (1.7%) | 9 (2.4%) |
| 75 Years and over | 0 (0.0%) | 0 (0.0%) |
| Total | 167 (2.6%) | 161 (2.7%) |
Income Above Poverty by Sex and Age in Prairie Ridge
According to the poverty statistics in Prairie Ridge, males aged under 5 years and females aged under 5 years are the age groups that are most secure financially, with 100.0% of males and 100.0% of females in these age groups living above the poverty line.
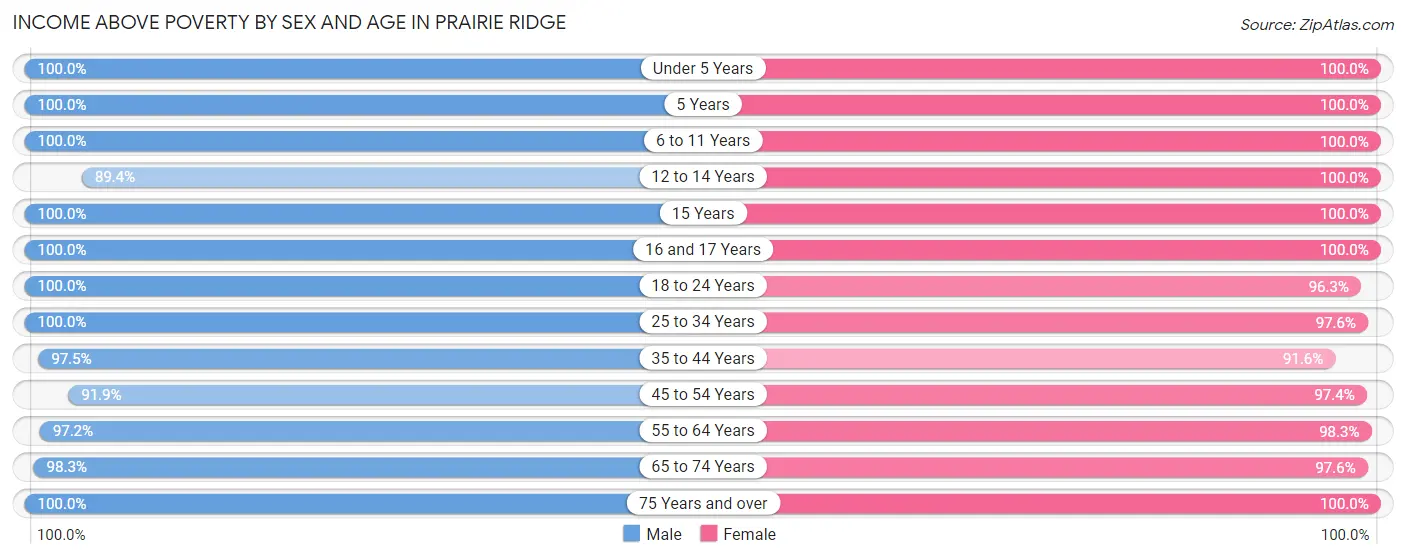
| Age Bracket | Male | Female |
| Under 5 Years | 324 (100.0%) | 374 (100.0%) |
| 5 Years | 135 (100.0%) | 65 (100.0%) |
| 6 to 11 Years | 805 (100.0%) | 622 (100.0%) |
| 12 to 14 Years | 261 (89.4%) | 192 (100.0%) |
| 15 Years | 25 (100.0%) | 118 (100.0%) |
| 16 and 17 Years | 100 (100.0%) | 127 (100.0%) |
| 18 to 24 Years | 520 (100.0%) | 549 (96.3%) |
| 25 to 34 Years | 855 (100.0%) | 743 (97.6%) |
| 35 to 44 Years | 840 (97.5%) | 846 (91.6%) |
| 45 to 54 Years | 963 (91.9%) | 743 (97.4%) |
| 55 to 64 Years | 718 (97.2%) | 847 (98.3%) |
| 65 to 74 Years | 465 (98.3%) | 361 (97.6%) |
| 75 Years and over | 190 (100.0%) | 238 (100.0%) |
| Total | 6,201 (97.4%) | 5,825 (97.3%) |
Income Below Poverty Among Married-Couple Families in Prairie Ridge
The poverty statistics for married-couple families in Prairie Ridge show that 0.4% or 9 of the total 2,558 families live below the poverty line. Families with no children have the highest poverty rate of 0.7%, comprising of 9 families. On the other hand, families with 1 or 2 children have the lowest poverty rate of 0.0%, which includes 0 families.
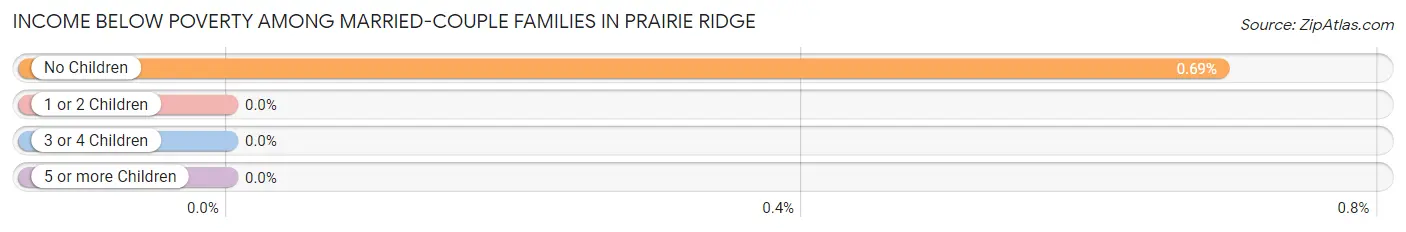
| Children | Above Poverty | Below Poverty |
| No Children | 1,296 (99.3%) | 9 (0.7%) |
| 1 or 2 Children | 1,006 (100.0%) | 0 (0.0%) |
| 3 or 4 Children | 228 (100.0%) | 0 (0.0%) |
| 5 or more Children | 19 (100.0%) | 0 (0.0%) |
| Total | 2,549 (99.7%) | 9 (0.4%) |
Income Below Poverty Among Single-Parent Households in Prairie Ridge
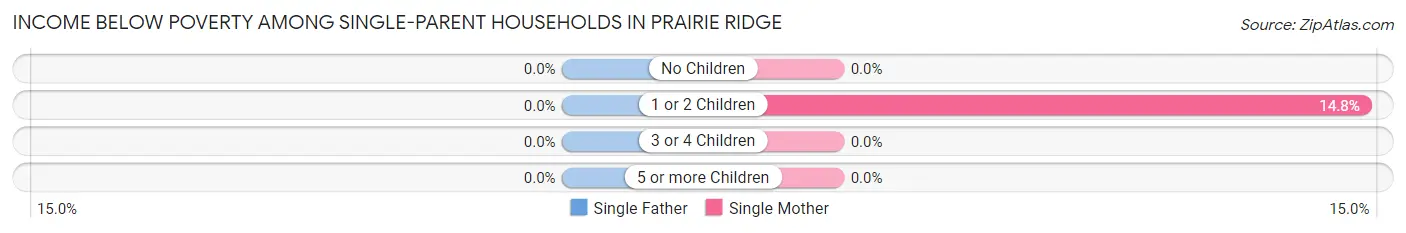
| Children | Single Father | Single Mother |
| No Children | 0 (0.0%) | 0 (0.0%) |
| 1 or 2 Children | 0 (0.0%) | 27 (14.7%) |
| 3 or 4 Children | 0 (0.0%) | 0 (0.0%) |
| 5 or more Children | 0 (0.0%) | 0 (0.0%) |
| Total | 0 (0.0%) | 27 (6.1%) |
Income Below Poverty Among Married-Couple vs Single-Parent Households in Prairie Ridge
The poverty data for Prairie Ridge shows that 9 of the married-couple family households (0.4%) and 27 of the single-parent households (3.1%) are living below the poverty level. Within the married-couple family households, those with no children have the highest poverty rate, with 9 households (0.7%) falling below the poverty line. Among the single-parent households, those with 1 or 2 children have the highest poverty rate, with 27 household (8.3%) living below poverty.
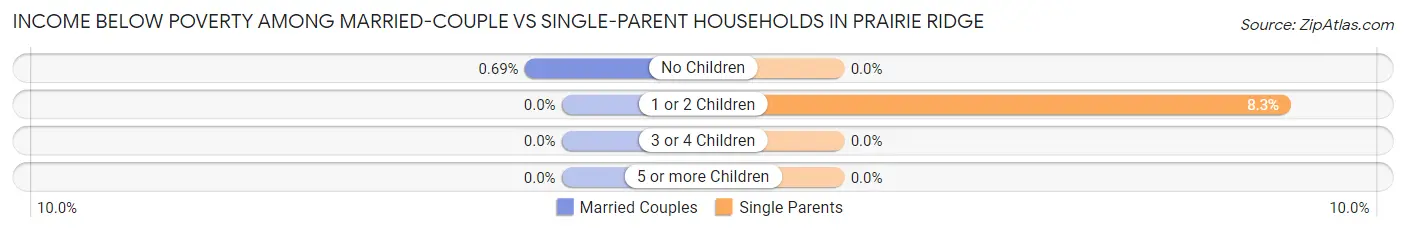
| Children | Married-Couple Families | Single-Parent Households |
| No Children | 9 (0.7%) | 0 (0.0%) |
| 1 or 2 Children | 0 (0.0%) | 27 (8.3%) |
| 3 or 4 Children | 0 (0.0%) | 0 (0.0%) |
| 5 or more Children | 0 (0.0%) | 0 (0.0%) |
| Total | 9 (0.4%) | 27 (3.1%) |
Race in Prairie Ridge
The most populous races in Prairie Ridge are White / Caucasian (10,957 | 88.0%), Hispanic or Latino (1,114 | 8.9%), and Two or more Races (646 | 5.2%).
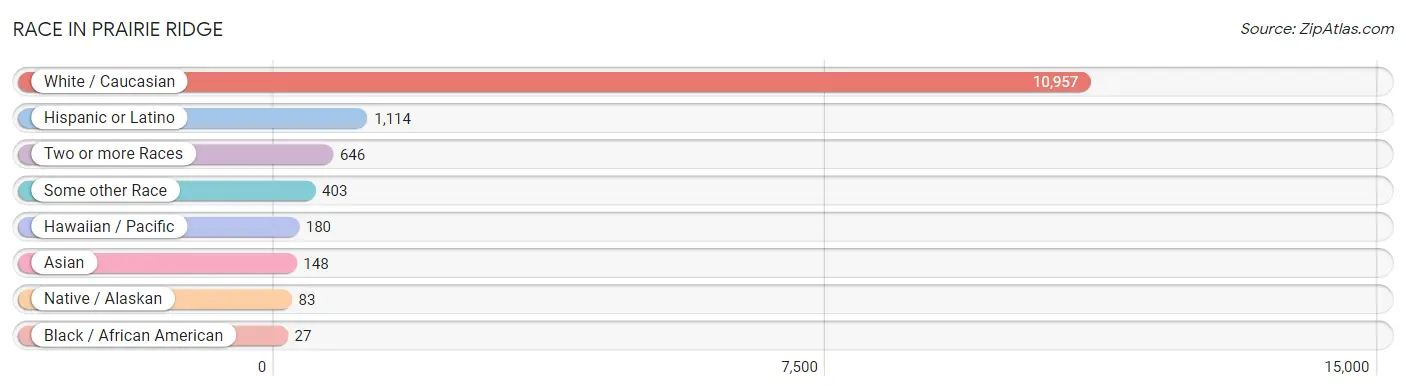
| Race | # Population | % Population |
| Asian | 148 | 1.2% |
| Black / African American | 27 | 0.2% |
| Hawaiian / Pacific | 180 | 1.5% |
| Hispanic or Latino | 1,114 | 8.9% |
| Native / Alaskan | 83 | 0.7% |
| White / Caucasian | 10,957 | 88.0% |
| Two or more Races | 646 | 5.2% |
| Some other Race | 403 | 3.2% |
| Total | 12,444 | 100.0% |
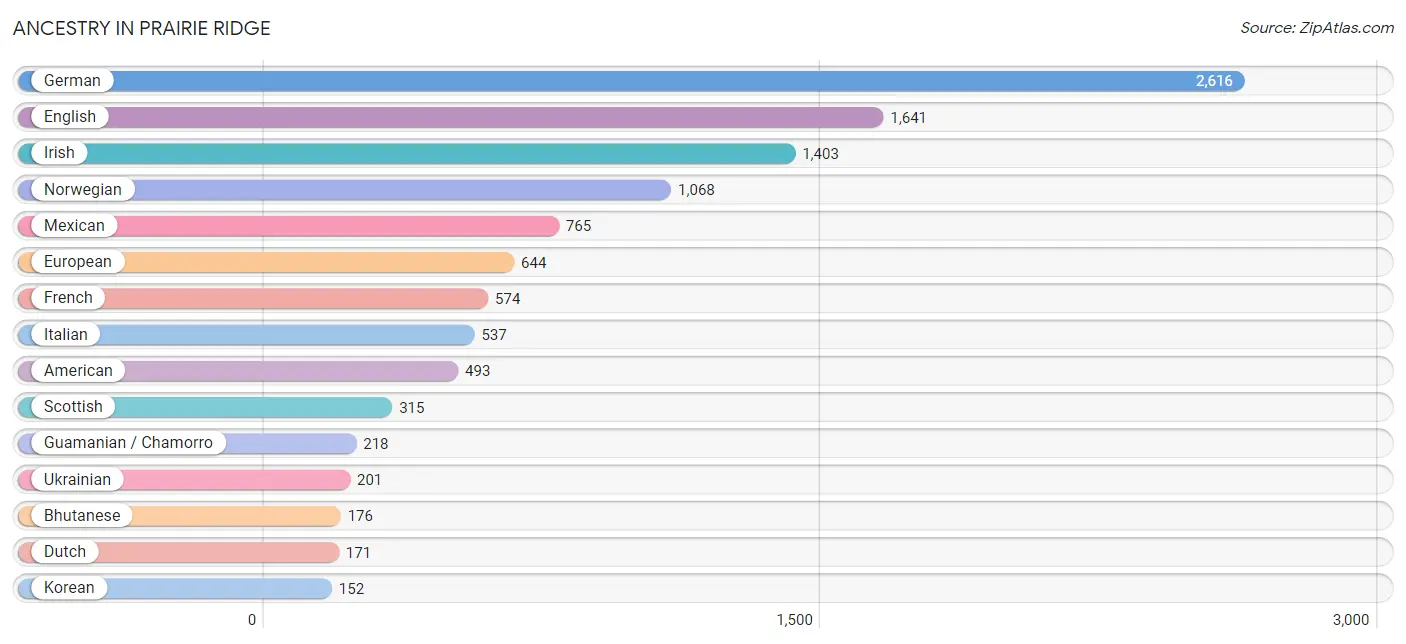
Ancestry in Prairie Ridge
The most populous ancestries reported in Prairie Ridge are German (2,616 | 21.0%), English (1,641 | 13.2%), Irish (1,403 | 11.3%), Norwegian (1,068 | 8.6%), and Mexican (765 | 6.1%), together accounting for 60.2% of all Prairie Ridge residents.
| Ancestry | # Population | % Population |
| American | 493 | 4.0% |
| Austrian | 36 | 0.3% |
| Bhutanese | 176 | 1.4% |
| Blackfeet | 113 | 0.9% |
| British | 135 | 1.1% |
| Burmese | 38 | 0.3% |
| Central American | 116 | 0.9% |
| Central American Indian | 10 | 0.1% |
| Cherokee | 76 | 0.6% |
| Chippewa | 26 | 0.2% |
| Cuban | 100 | 0.8% |
| Czech | 31 | 0.3% |
| Danish | 84 | 0.7% |
| Dutch | 171 | 1.4% |
| Eastern European | 90 | 0.7% |
| English | 1,641 | 13.2% |
| European | 644 | 5.2% |
| Finnish | 54 | 0.4% |
| French | 574 | 4.6% |
| French American Indian | 15 | 0.1% |
| French Canadian | 24 | 0.2% |
| German | 2,616 | 21.0% |
| Greek | 19 | 0.2% |
| Guamanian / Chamorro | 218 | 1.8% |
| Guatemalan | 58 | 0.5% |
| Honduran | 48 | 0.4% |
| Indian (Asian) | 63 | 0.5% |
| Irish | 1,403 | 11.3% |
| Italian | 537 | 4.3% |
| Korean | 152 | 1.2% |
| Lithuanian | 6 | 0.1% |
| Mexican | 765 | 6.1% |
| Native Hawaiian | 9 | 0.1% |
| Nicaraguan | 10 | 0.1% |
| Northern European | 16 | 0.1% |
| Norwegian | 1,068 | 8.6% |
| Polish | 139 | 1.1% |
| Portuguese | 18 | 0.1% |
| Puerto Rican | 80 | 0.6% |
| Romanian | 45 | 0.4% |
| Russian | 119 | 1.0% |
| Scandinavian | 136 | 1.1% |
| Scotch-Irish | 146 | 1.2% |
| Scottish | 315 | 2.5% |
| Sioux | 13 | 0.1% |
| Slavic | 20 | 0.2% |
| Slovak | 12 | 0.1% |
| Spaniard | 29 | 0.2% |
| Spanish | 24 | 0.2% |
| Swedish | 128 | 1.0% |
| Swiss | 31 | 0.3% |
| Tlingit-Haida | 27 | 0.2% |
| Ukrainian | 201 | 1.6% |
| Welsh | 47 | 0.4% |
| Yugoslavian | 11 | 0.1% | View All 55 Rows |
Immigrants in Prairie Ridge
The most numerous immigrant groups reported in Prairie Ridge came from Latin America (310 | 2.5%), Central America (300 | 2.4%), Europe (196 | 1.6%), Mexico (194 | 1.6%), and Eastern Europe (167 | 1.3%), together accounting for 9.4% of all Prairie Ridge residents.
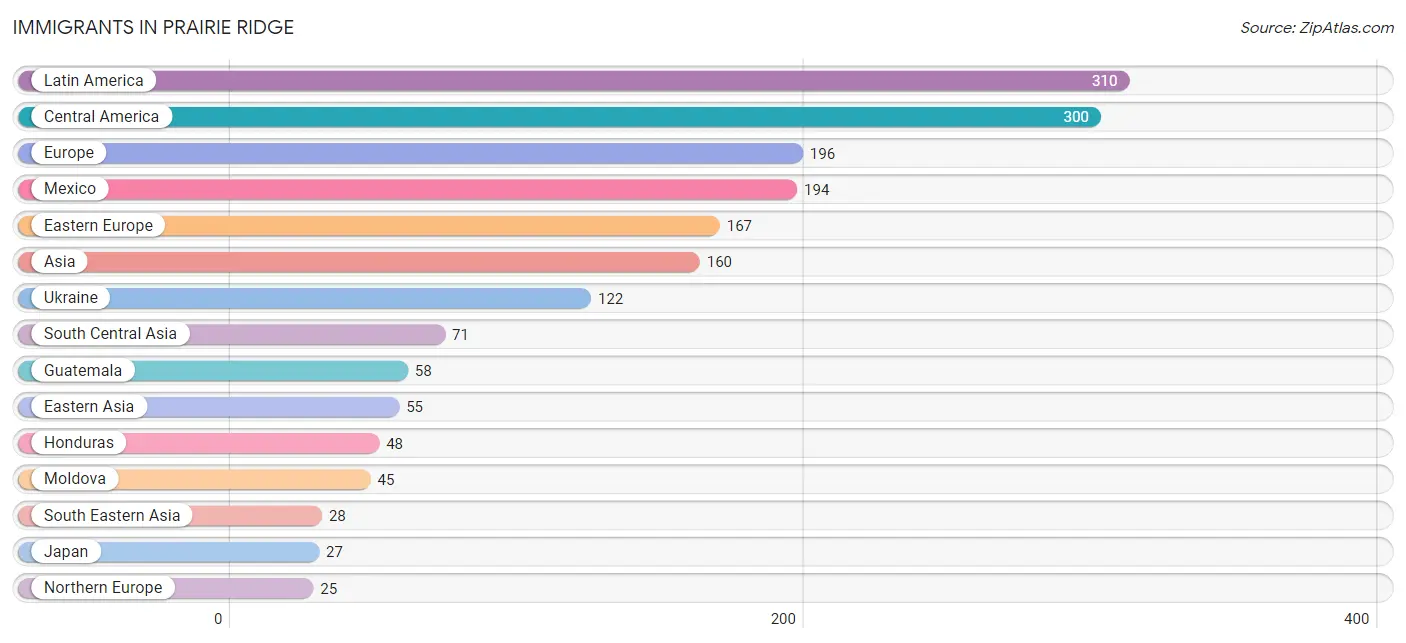
| Immigration Origin | # Population | % Population |
| Asia | 160 | 1.3% |
| Brazil | 10 | 0.1% |
| Central America | 300 | 2.4% |
| China | 11 | 0.1% |
| Eastern Asia | 55 | 0.4% |
| Eastern Europe | 167 | 1.3% |
| England | 15 | 0.1% |
| Europe | 196 | 1.6% |
| Germany | 4 | 0.0% |
| Guatemala | 58 | 0.5% |
| Honduras | 48 | 0.4% |
| Hong Kong | 11 | 0.1% |
| Japan | 27 | 0.2% |
| Korea | 17 | 0.1% |
| Latin America | 310 | 2.5% |
| Mexico | 194 | 1.6% |
| Moldova | 45 | 0.4% |
| Northern Europe | 25 | 0.2% |
| Philippines | 21 | 0.2% |
| Scotland | 10 | 0.1% |
| South America | 10 | 0.1% |
| South Central Asia | 71 | 0.6% |
| South Eastern Asia | 28 | 0.2% |
| Ukraine | 122 | 1.0% |
| Vietnam | 7 | 0.1% |
| Western Asia | 6 | 0.1% |
| Western Europe | 4 | 0.0% | View All 27 Rows |
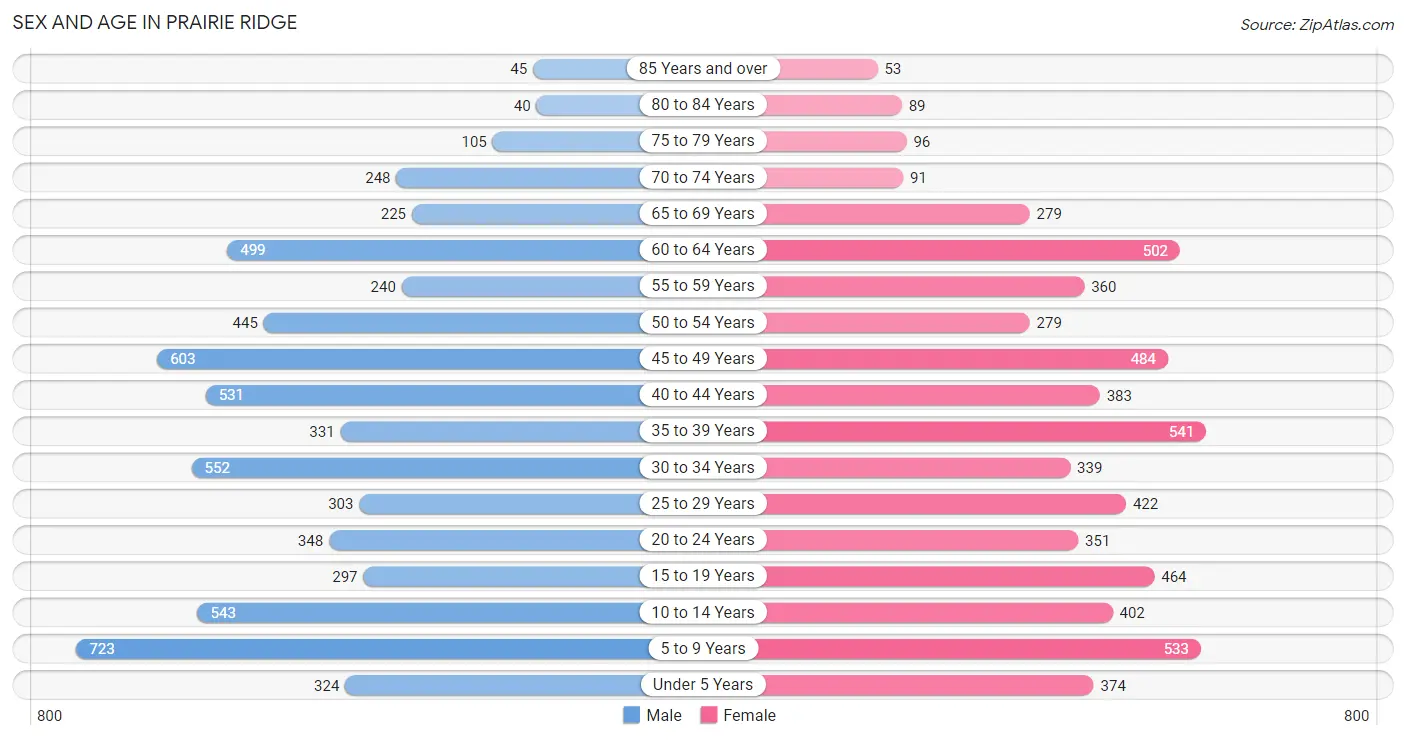
Sex and Age in Prairie Ridge
Sex and Age in Prairie Ridge
The most populous age groups in Prairie Ridge are 5 to 9 Years (723 | 11.3%) for men and 35 to 39 Years (541 | 8.9%) for women.
| Age Bracket | Male | Female |
| Under 5 Years | 324 (5.1%) | 374 (6.2%) |
| 5 to 9 Years | 723 (11.3%) | 533 (8.8%) |
| 10 to 14 Years | 543 (8.5%) | 402 (6.7%) |
| 15 to 19 Years | 297 (4.6%) | 464 (7.7%) |
| 20 to 24 Years | 348 (5.4%) | 351 (5.8%) |
| 25 to 29 Years | 303 (4.7%) | 422 (7.0%) |
| 30 to 34 Years | 552 (8.6%) | 339 (5.6%) |
| 35 to 39 Years | 331 (5.2%) | 541 (8.9%) |
| 40 to 44 Years | 531 (8.3%) | 383 (6.3%) |
| 45 to 49 Years | 603 (9.4%) | 484 (8.0%) |
| 50 to 54 Years | 445 (7.0%) | 279 (4.6%) |
| 55 to 59 Years | 240 (3.7%) | 360 (6.0%) |
| 60 to 64 Years | 499 (7.8%) | 502 (8.3%) |
| 65 to 69 Years | 225 (3.5%) | 279 (4.6%) |
| 70 to 74 Years | 248 (3.9%) | 91 (1.5%) |
| 75 to 79 Years | 105 (1.6%) | 96 (1.6%) |
| 80 to 84 Years | 40 (0.6%) | 89 (1.5%) |
| 85 Years and over | 45 (0.7%) | 53 (0.9%) |
| Total | 6,402 (100.0%) | 6,042 (100.0%) |
Families and Households in Prairie Ridge
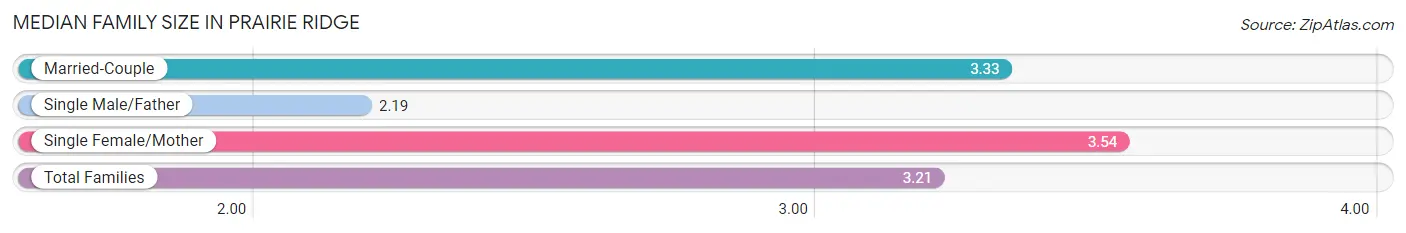
Median Family Size in Prairie Ridge
The median family size in Prairie Ridge is 3.21 persons per family, with single female/mother families (441 | 12.9%) accounting for the largest median family size of 3.54 persons per family. On the other hand, single male/father families (419 | 12.3%) represent the smallest median family size with 2.19 persons per family.
| Family Type | # Families | Family Size |
| Married-Couple | 2,558 (74.8%) | 3.33 |
| Single Male/Father | 419 (12.3%) | 2.19 |
| Single Female/Mother | 441 (12.9%) | 3.54 |
| Total Families | 3,418 (100.0%) | 3.21 |
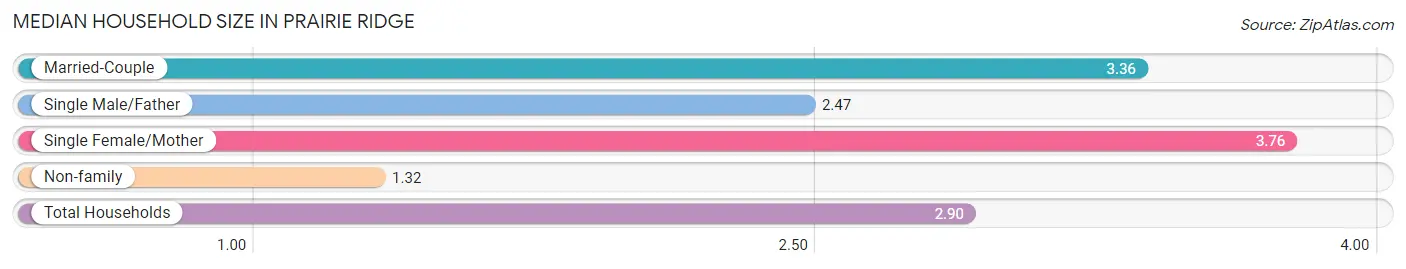
Median Household Size in Prairie Ridge
The median household size in Prairie Ridge is 2.90 persons per household, with single female/mother households (441 | 10.3%) accounting for the largest median household size of 3.76 persons per household. non-family households (874 | 20.4%) represent the smallest median household size with 1.32 persons per household.
| Household Type | # Households | Household Size |
| Married-Couple | 2,558 (59.6%) | 3.36 |
| Single Male/Father | 419 (9.8%) | 2.47 |
| Single Female/Mother | 441 (10.3%) | 3.76 |
| Non-family | 874 (20.4%) | 1.32 |
| Total Households | 4,292 (100.0%) | 2.90 |
Household Size by Marriage Status in Prairie Ridge
Out of a total of 4,292 households in Prairie Ridge, 3,418 (79.6%) are family households, while 874 (20.4%) are nonfamily households. The most numerous type of family households are 2-person households, comprising 1,374, and the most common type of nonfamily households are 1-person households, comprising 680.
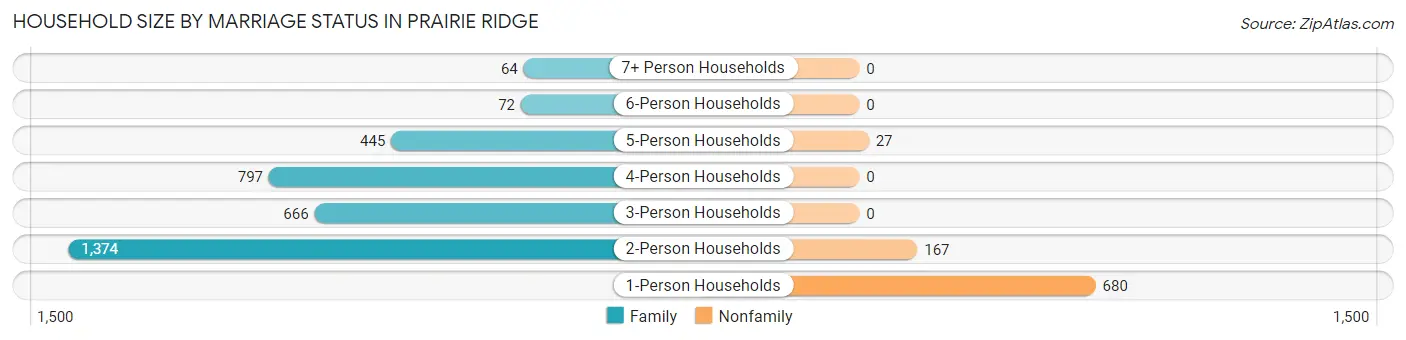
| Household Size | Family Households | Nonfamily Households |
| 1-Person Households | - | 680 (15.8%) |
| 2-Person Households | 1,374 (32.0%) | 167 (3.9%) |
| 3-Person Households | 666 (15.5%) | 0 (0.0%) |
| 4-Person Households | 797 (18.6%) | 0 (0.0%) |
| 5-Person Households | 445 (10.4%) | 27 (0.6%) |
| 6-Person Households | 72 (1.7%) | 0 (0.0%) |
| 7+ Person Households | 64 (1.5%) | 0 (0.0%) |
| Total | 3,418 (79.6%) | 874 (20.4%) |
Female Fertility in Prairie Ridge
Fertility by Age in Prairie Ridge
Average fertility rate in Prairie Ridge is 30.0 births per 1,000 women. Women in the age bracket of 35 to 50 years have the highest fertility rate with 35.0 births per 1,000 women. Women in the age bracket of 35 to 50 years acount for 57.3% of all women with births.
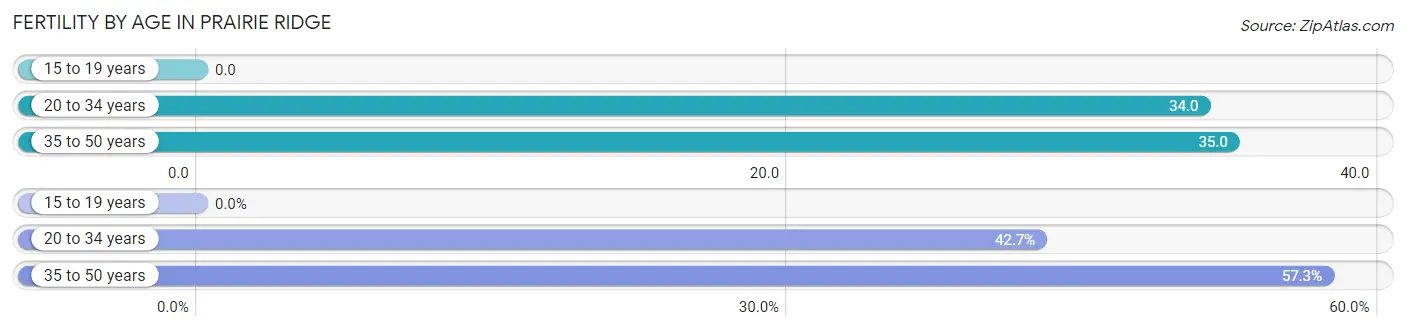
| Age Bracket | Women with Births | Births / 1,000 Women |
| 15 to 19 years | 0 (0.0%) | 0.0 |
| 20 to 34 years | 38 (42.7%) | 34.0 |
| 35 to 50 years | 51 (57.3%) | 35.0 |
| Total | 89 (100.0%) | 30.0 |
Fertility by Age by Marriage Status in Prairie Ridge
93.3% of women with births (89) in Prairie Ridge are married. The highest percentage of unmarried women with births falls into 20 to 34 years age bracket with 15.8% of them unmarried at the time of birth, while the lowest percentage of unmarried women with births belong to 35 to 50 years age bracket with 0.0% of them unmarried.
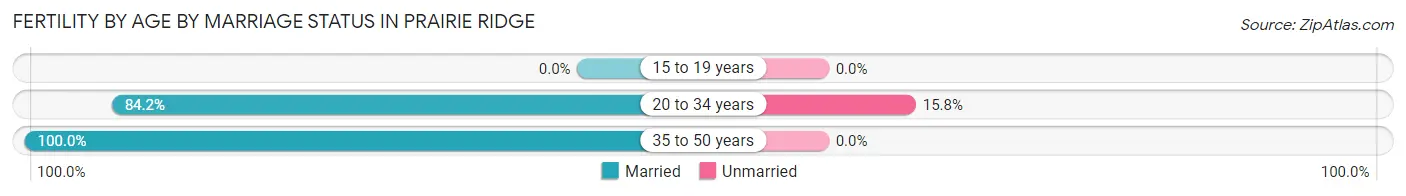
| Age Bracket | Married | Unmarried |
| 15 to 19 years | 0 (0.0%) | 0 (0.0%) |
| 20 to 34 years | 32 (84.2%) | 6 (15.8%) |
| 35 to 50 years | 51 (100.0%) | 0 (0.0%) |
| Total | 83 (93.3%) | 6 (6.7%) |
Fertility by Education in Prairie Ridge
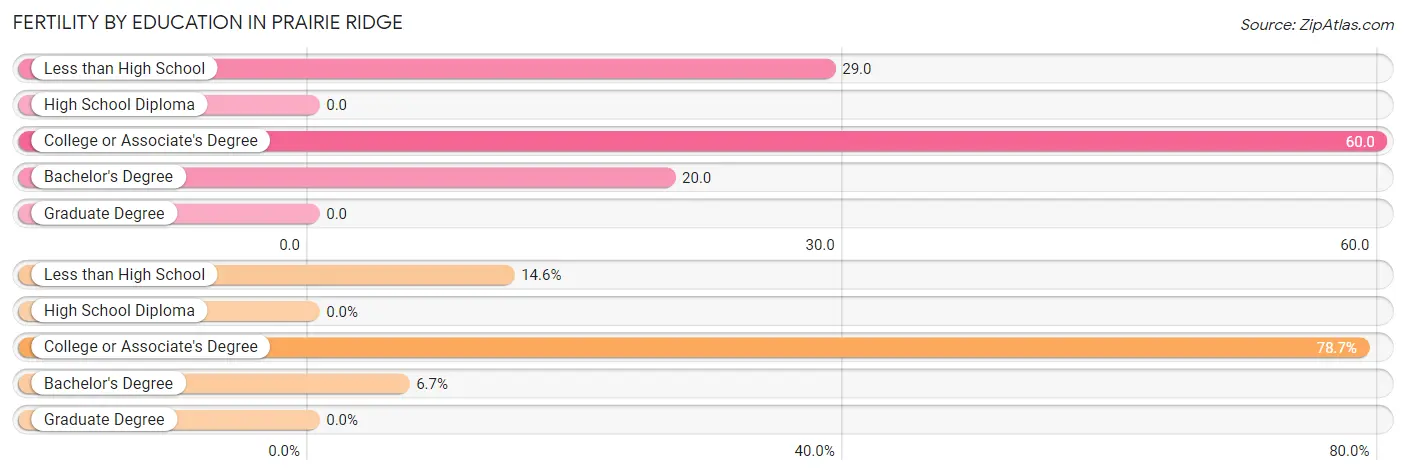
| Educational Attainment | Women with Births | Births / 1,000 Women |
| Less than High School | 13 (14.6%) | 29.0 |
| High School Diploma | 0 (0.0%) | 0.0 |
| College or Associate's Degree | 70 (78.6%) | 60.0 |
| Bachelor's Degree | 6 (6.7%) | 20.0 |
| Graduate Degree | 0 (0.0%) | 0.0 |
| Total | 89 (100.0%) | 30.0 |
Fertility by Education by Marriage Status in Prairie Ridge
6.7% of women with births in Prairie Ridge are unmarried. Women with the educational attainment of less than high school are most likely to be married with 100.0% of them married at childbirth, while women with the educational attainment of college or associate's degree are least likely to be married with 8.6% of them unmarried at childbirth.
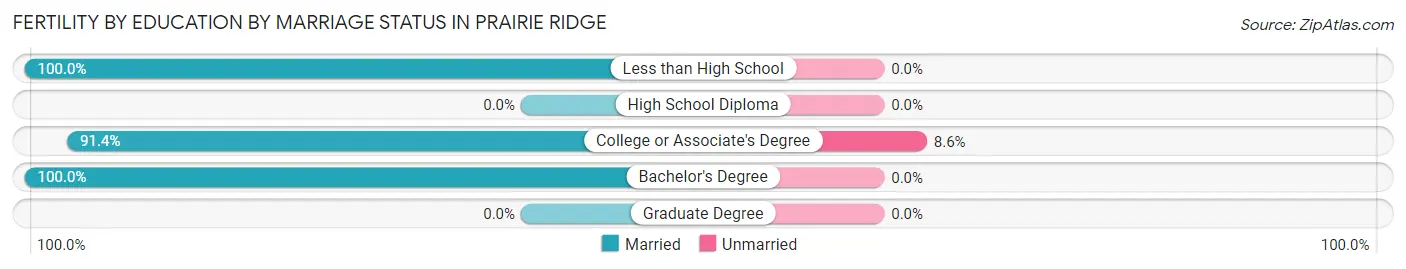
| Educational Attainment | Married | Unmarried |
| Less than High School | 13 (100.0%) | 0 (0.0%) |
| High School Diploma | 0 (0.0%) | 0 (0.0%) |
| College or Associate's Degree | 64 (91.4%) | 6 (8.6%) |
| Bachelor's Degree | 6 (100.0%) | 0 (0.0%) |
| Graduate Degree | 0 (0.0%) | 0 (0.0%) |
| Total | 83 (93.3%) | 6 (6.7%) |
Employment Characteristics in Prairie Ridge
Employment by Class of Employer in Prairie Ridge
Among the 6,049 employed individuals in Prairie Ridge, private company employees (4,397 | 72.7%), local government employees (607 | 10.0%), and not-for-profit organizations (267 | 4.4%) make up the most common classes of employment.
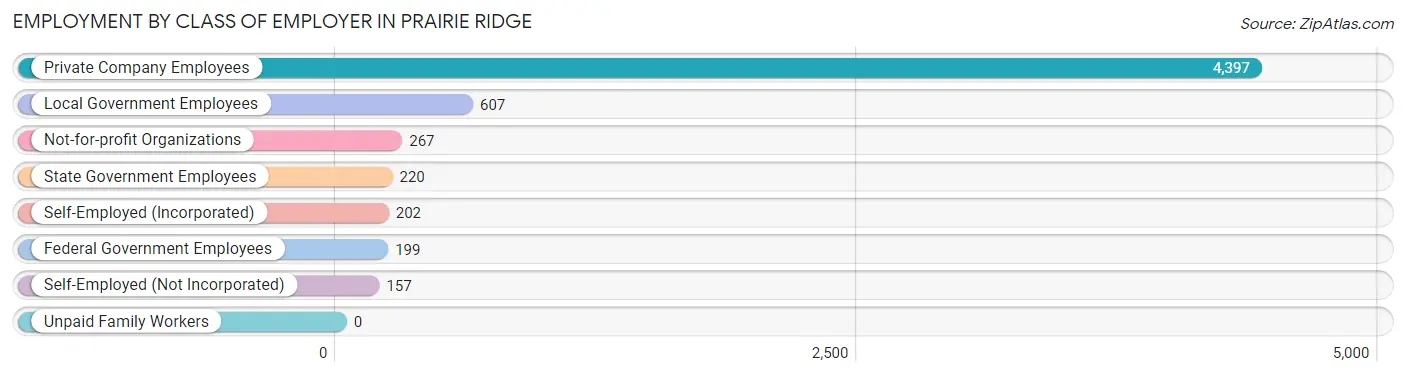
| Employer Class | # Employees | % Employees |
| Private Company Employees | 4,397 | 72.7% |
| Self-Employed (Incorporated) | 202 | 3.3% |
| Self-Employed (Not Incorporated) | 157 | 2.6% |
| Not-for-profit Organizations | 267 | 4.4% |
| Local Government Employees | 607 | 10.0% |
| State Government Employees | 220 | 3.6% |
| Federal Government Employees | 199 | 3.3% |
| Unpaid Family Workers | 0 | 0.0% |
| Total | 6,049 | 100.0% |
Employment Status by Age in Prairie Ridge
According to the labor force statistics for Prairie Ridge, out of the total population over 16 years of age (9,402), 71.1% or 6,685 individuals are in the labor force, with 7.0% or 468 of them unemployed. The age group with the highest labor force participation rate is 35 to 44 years, with 87.9% or 1,570 individuals in the labor force. Within the labor force, the 55 to 59 years age range has the highest percentage of unemployed individuals, with 13.3% or 60 of them being unemployed.
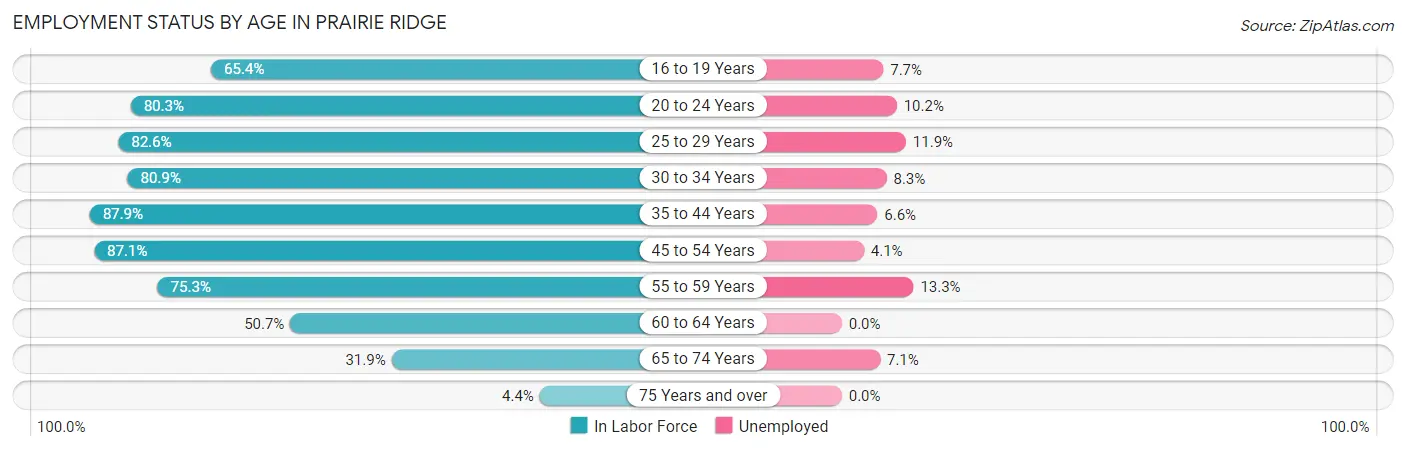
| Age Bracket | In Labor Force | Unemployed |
| 16 to 19 Years | 404 (65.4%) | 31 (7.7%) |
| 20 to 24 Years | 561 (80.3%) | 57 (10.2%) |
| 25 to 29 Years | 599 (82.6%) | 71 (11.9%) |
| 30 to 34 Years | 721 (80.9%) | 60 (8.3%) |
| 35 to 44 Years | 1,570 (87.9%) | 104 (6.6%) |
| 45 to 54 Years | 1,577 (87.1%) | 65 (4.1%) |
| 55 to 59 Years | 452 (75.3%) | 60 (13.3%) |
| 60 to 64 Years | 508 (50.7%) | 0 (0.0%) |
| 65 to 74 Years | 269 (31.9%) | 19 (7.1%) |
| 75 Years and over | 19 (4.4%) | 0 (0.0%) |
| Total | 6,685 (71.1%) | 468 (7.0%) |
Employment Status by Educational Attainment in Prairie Ridge
According to labor force statistics for Prairie Ridge, 79.7% of individuals (5,431) out of the total population between 25 and 64 years of age (6,814) are in the labor force, with 6.6% or 358 of them being unemployed. The group with the highest labor force participation rate are those with the educational attainment of bachelor's degree or higher, with 91.2% or 947 individuals in the labor force. Within the labor force, individuals with high school diploma education have the highest percentage of unemployment, with 11.6% or 194 of them being unemployed.

| Educational Attainment | In Labor Force | Unemployed |
| Less than High School | 313 (73.5%) | 29 (6.7%) |
| High School Diploma | 1,675 (72.9%) | 266 (11.6%) |
| College / Associate Degree | 2,494 (81.7%) | 177 (5.8%) |
| Bachelor's Degree or higher | 947 (91.2%) | 0 (0.0%) |
| Total | 5,431 (79.7%) | 450 (6.6%) |
Employment Occupations by Sex in Prairie Ridge
Management, Business, Science and Arts Occupations
The most common Management, Business, Science and Arts occupations in Prairie Ridge are Computers, Engineering & Science (466 | 7.5%), Community & Social Service (396 | 6.4%), Management (359 | 5.8%), Computers & Mathematics (268 | 4.3%), and Health Diagnosing & Treating (208 | 3.4%).
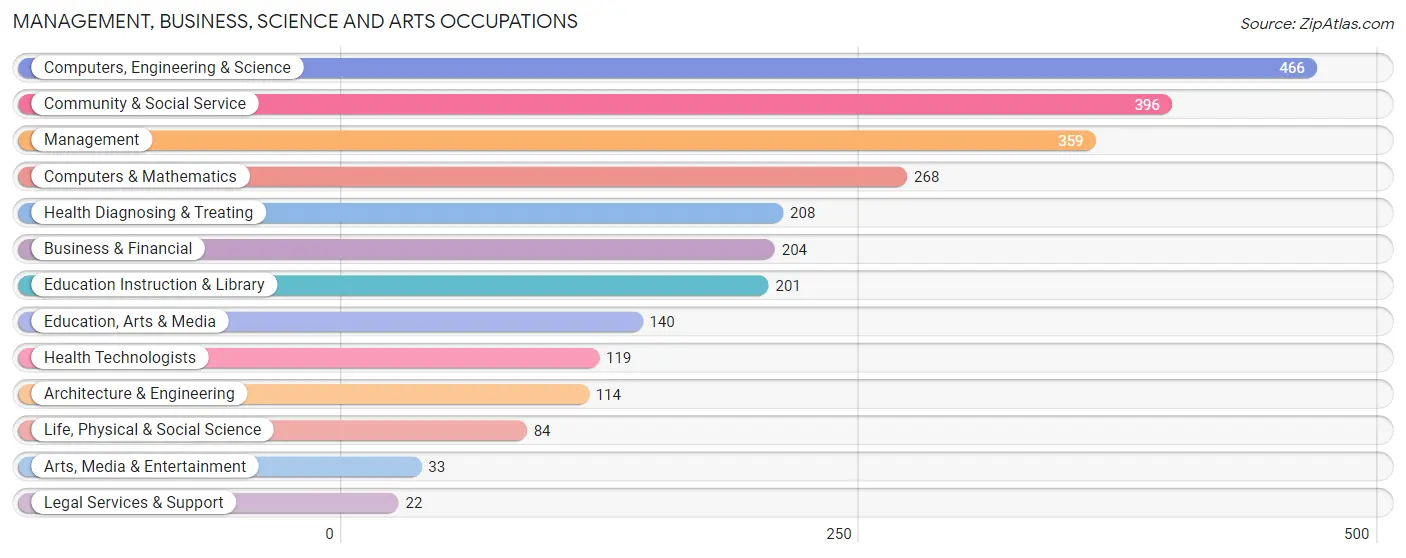
Management, Business, Science and Arts Occupations by Sex
Within the Management, Business, Science and Arts occupations in Prairie Ridge, the most male-oriented occupations are Life, Physical & Social Science (88.1%), Architecture & Engineering (64.0%), and Computers, Engineering & Science (61.8%), while the most female-oriented occupations are Education Instruction & Library (79.6%), Arts, Media & Entertainment (75.8%), and Health Diagnosing & Treating (73.6%).
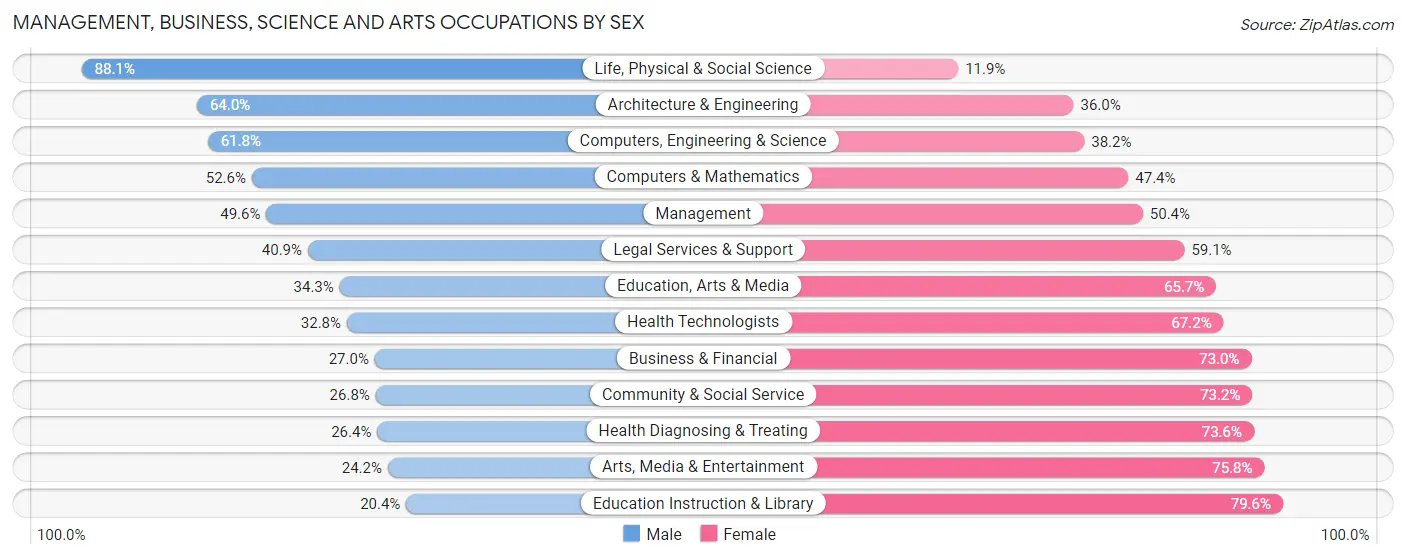
| Occupation | Male | Female |
| Management | 178 (49.6%) | 181 (50.4%) |
| Business & Financial | 55 (27.0%) | 149 (73.0%) |
| Computers, Engineering & Science | 288 (61.8%) | 178 (38.2%) |
| Computers & Mathematics | 141 (52.6%) | 127 (47.4%) |
| Architecture & Engineering | 73 (64.0%) | 41 (36.0%) |
| Life, Physical & Social Science | 74 (88.1%) | 10 (11.9%) |
| Community & Social Service | 106 (26.8%) | 290 (73.2%) |
| Education, Arts & Media | 48 (34.3%) | 92 (65.7%) |
| Legal Services & Support | 9 (40.9%) | 13 (59.1%) |
| Education Instruction & Library | 41 (20.4%) | 160 (79.6%) |
| Arts, Media & Entertainment | 8 (24.2%) | 25 (75.8%) |
| Health Diagnosing & Treating | 55 (26.4%) | 153 (73.6%) |
| Health Technologists | 39 (32.8%) | 80 (67.2%) |
| Total (Category) | 682 (41.8%) | 951 (58.2%) |
| Total (Overall) | 3,330 (53.7%) | 2,875 (46.3%) |
Services Occupations
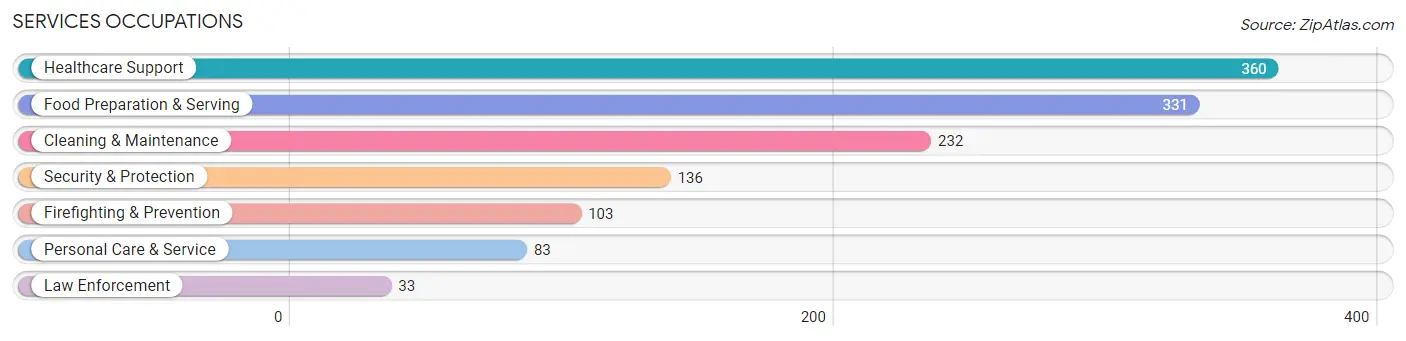
The most common Services occupations in Prairie Ridge are Healthcare Support (360 | 5.8%), Food Preparation & Serving (331 | 5.3%), Cleaning & Maintenance (232 | 3.7%), Security & Protection (136 | 2.2%), and Firefighting & Prevention (103 | 1.7%).
Services Occupations by Sex
Within the Services occupations in Prairie Ridge, the most male-oriented occupations are Cleaning & Maintenance (78.0%), Firefighting & Prevention (75.7%), and Security & Protection (69.9%), while the most female-oriented occupations are Personal Care & Service (100.0%), Food Preparation & Serving (90.0%), and Healthcare Support (70.3%).
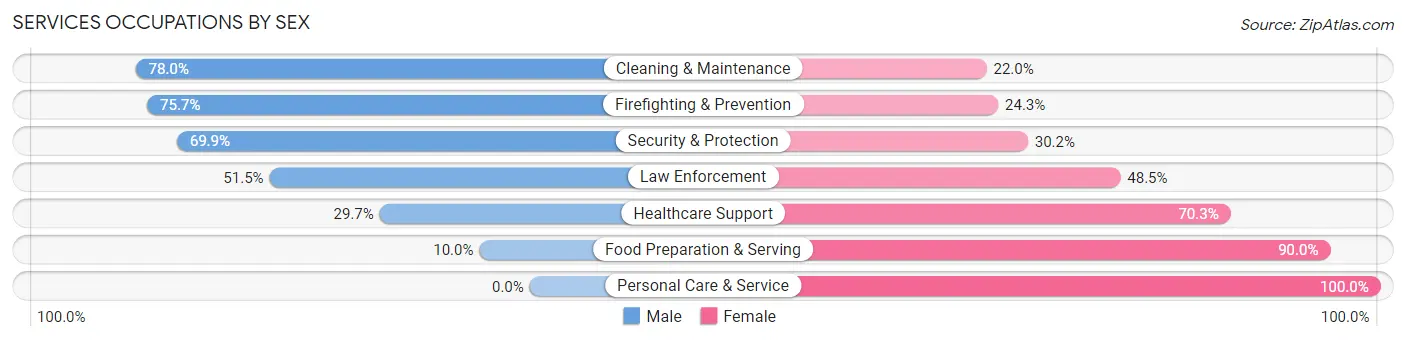
| Occupation | Male | Female |
| Healthcare Support | 107 (29.7%) | 253 (70.3%) |
| Security & Protection | 95 (69.9%) | 41 (30.1%) |
| Firefighting & Prevention | 78 (75.7%) | 25 (24.3%) |
| Law Enforcement | 17 (51.5%) | 16 (48.5%) |
| Food Preparation & Serving | 33 (10.0%) | 298 (90.0%) |
| Cleaning & Maintenance | 181 (78.0%) | 51 (22.0%) |
| Personal Care & Service | 0 (0.0%) | 83 (100.0%) |
| Total (Category) | 416 (36.4%) | 726 (63.6%) |
| Total (Overall) | 3,330 (53.7%) | 2,875 (46.3%) |
Sales and Office Occupations
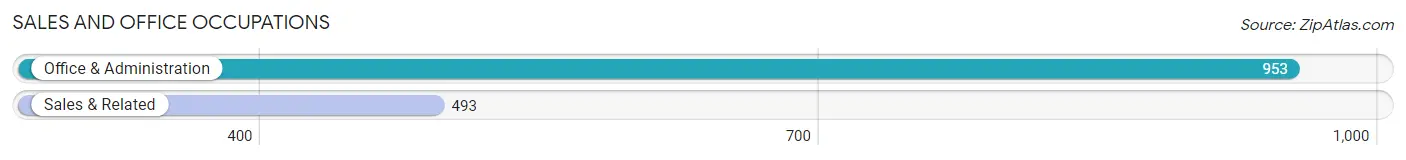
The most common Sales and Office occupations in Prairie Ridge are Office & Administration (953 | 15.4%), and Sales & Related (493 | 8.0%).
Sales and Office Occupations by Sex
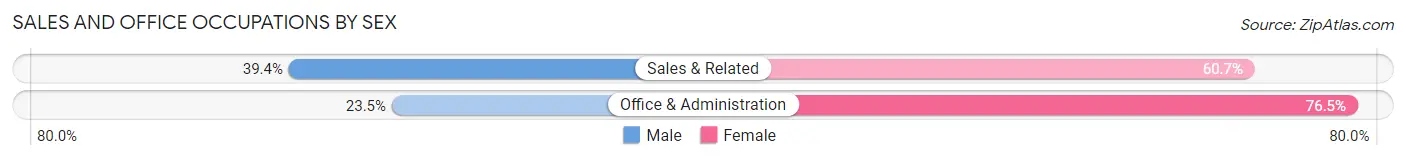
| Occupation | Male | Female |
| Sales & Related | 194 (39.4%) | 299 (60.7%) |
| Office & Administration | 224 (23.5%) | 729 (76.5%) |
| Total (Category) | 418 (28.9%) | 1,028 (71.1%) |
| Total (Overall) | 3,330 (53.7%) | 2,875 (46.3%) |
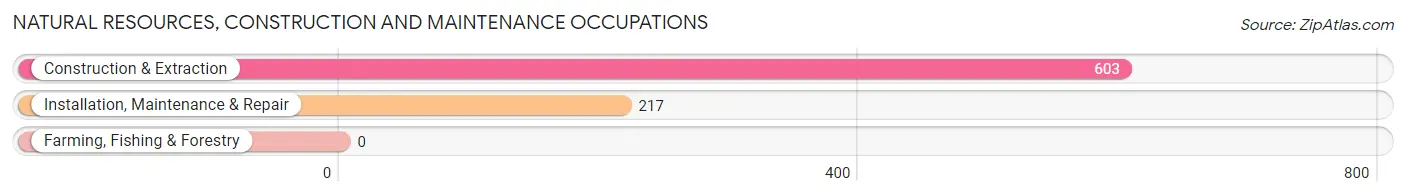
Natural Resources, Construction and Maintenance Occupations
The most common Natural Resources, Construction and Maintenance occupations in Prairie Ridge are Construction & Extraction (603 | 9.7%), and Installation, Maintenance & Repair (217 | 3.5%).
Natural Resources, Construction and Maintenance Occupations by Sex
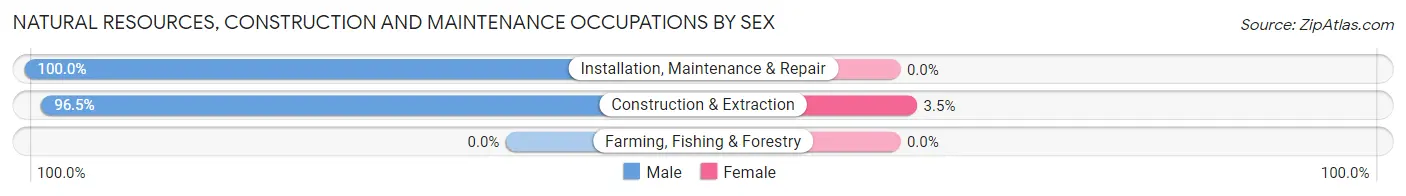
| Occupation | Male | Female |
| Farming, Fishing & Forestry | 0 (0.0%) | 0 (0.0%) |
| Construction & Extraction | 582 (96.5%) | 21 (3.5%) |
| Installation, Maintenance & Repair | 217 (100.0%) | 0 (0.0%) |
| Total (Category) | 799 (97.4%) | 21 (2.6%) |
| Total (Overall) | 3,330 (53.7%) | 2,875 (46.3%) |
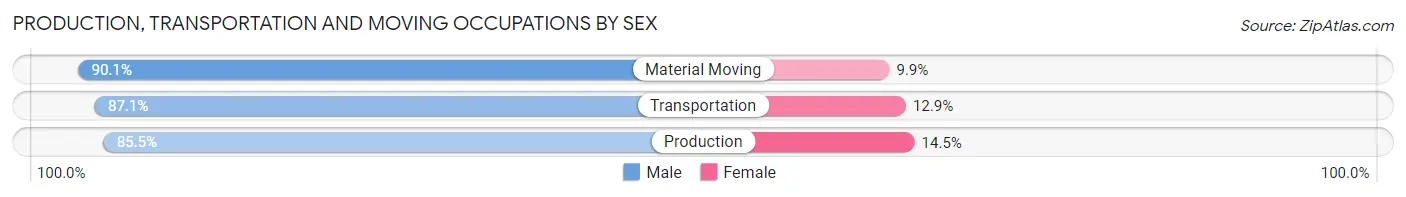
Production, Transportation and Moving Occupations
The most common Production, Transportation and Moving occupations in Prairie Ridge are Production (558 | 9.0%), Material Moving (343 | 5.5%), and Transportation (263 | 4.2%).
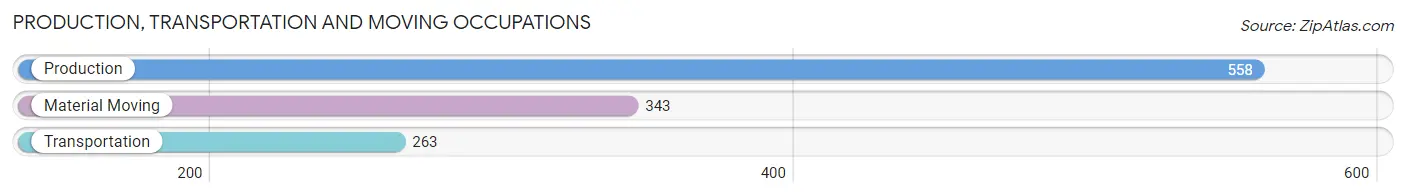
Production, Transportation and Moving Occupations by Sex
| Occupation | Male | Female |
| Production | 477 (85.5%) | 81 (14.5%) |
| Transportation | 229 (87.1%) | 34 (12.9%) |
| Material Moving | 309 (90.1%) | 34 (9.9%) |
| Total (Category) | 1,015 (87.2%) | 149 (12.8%) |
| Total (Overall) | 3,330 (53.7%) | 2,875 (46.3%) |
Employment Industries by Sex in Prairie Ridge
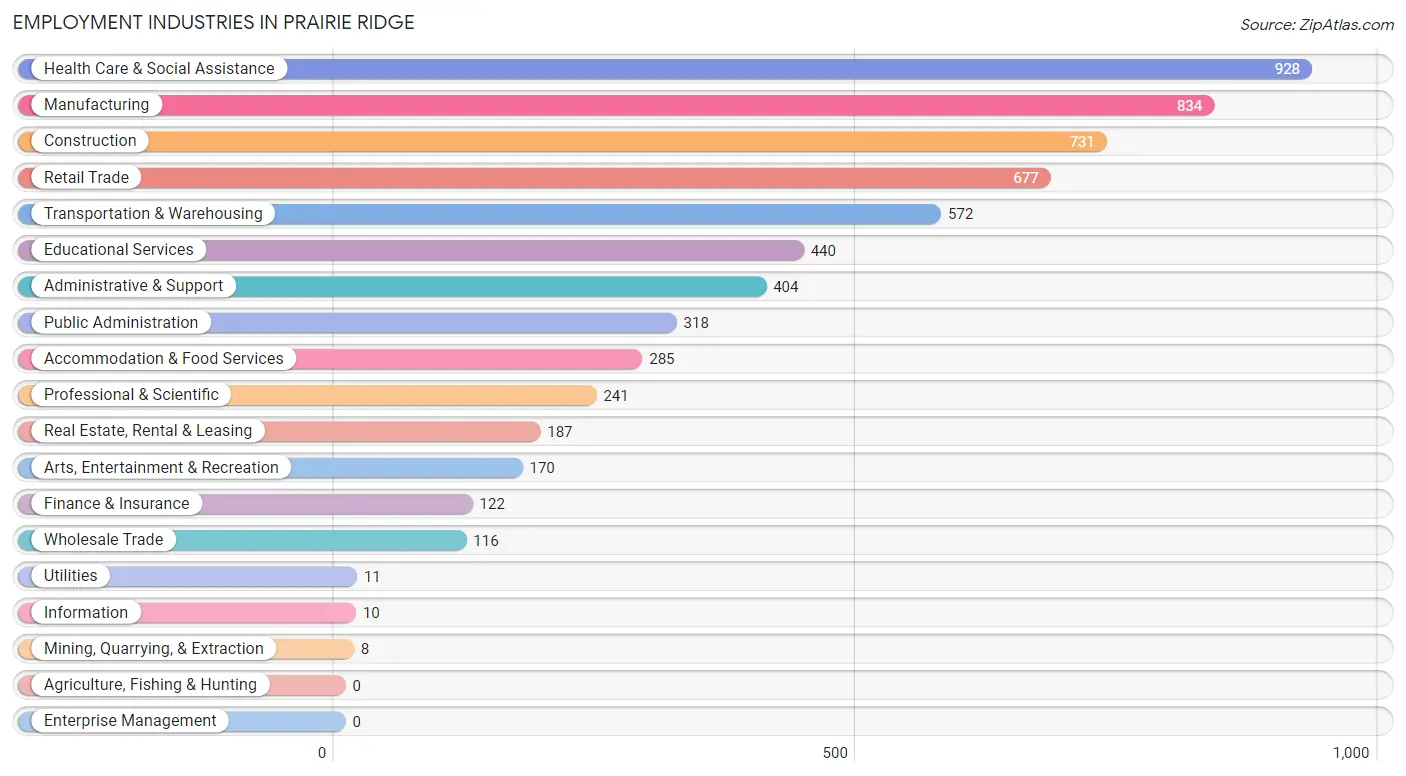
Employment Industries in Prairie Ridge
The major employment industries in Prairie Ridge include Health Care & Social Assistance (928 | 15.0%), Manufacturing (834 | 13.4%), Construction (731 | 11.8%), Retail Trade (677 | 10.9%), and Transportation & Warehousing (572 | 9.2%).
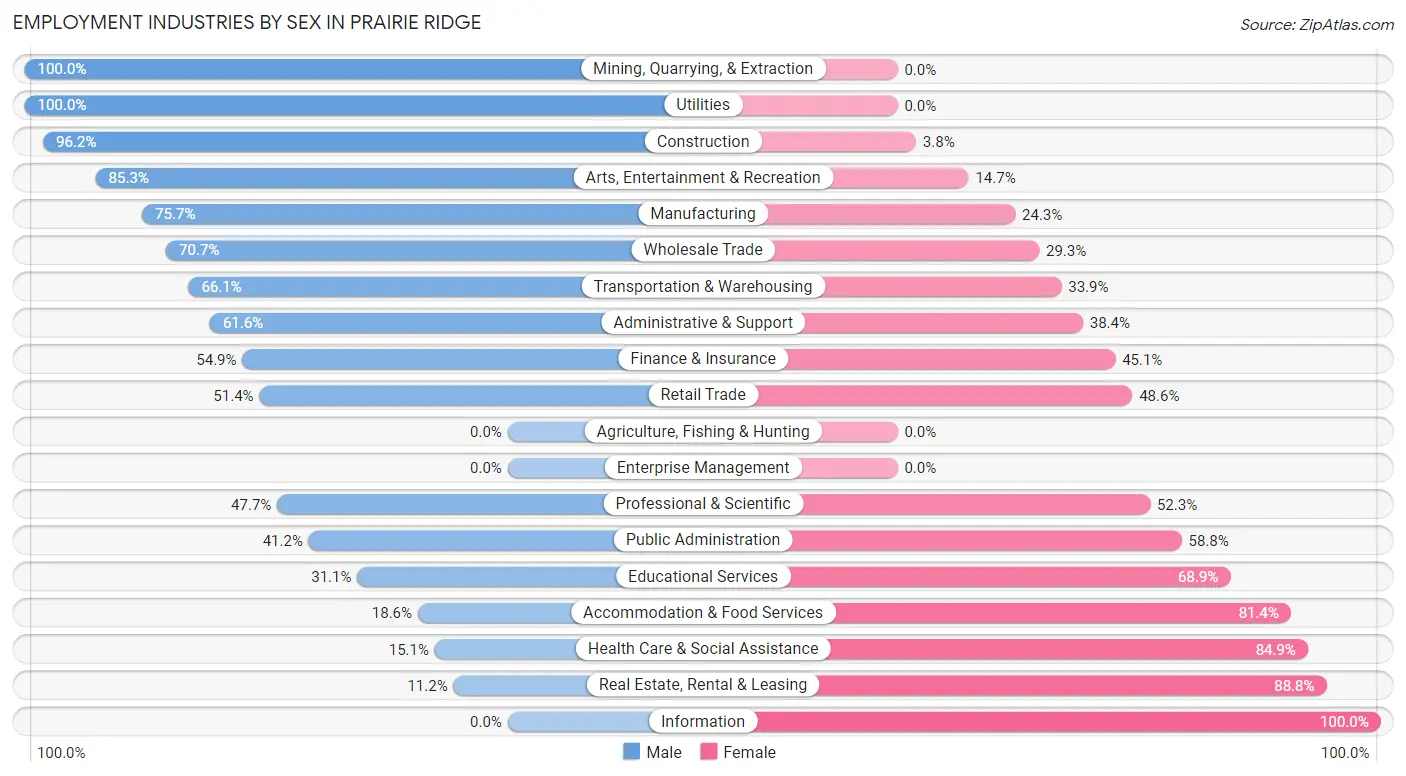
Employment Industries by Sex in Prairie Ridge
The Prairie Ridge industries that see more men than women are Mining, Quarrying, & Extraction (100.0%), Utilities (100.0%), and Construction (96.2%), whereas the industries that tend to have a higher number of women are Information (100.0%), Real Estate, Rental & Leasing (88.8%), and Health Care & Social Assistance (84.9%).
| Industry | Male | Female |
| Agriculture, Fishing & Hunting | 0 (0.0%) | 0 (0.0%) |
| Mining, Quarrying, & Extraction | 8 (100.0%) | 0 (0.0%) |
| Construction | 703 (96.2%) | 28 (3.8%) |
| Manufacturing | 631 (75.7%) | 203 (24.3%) |
| Wholesale Trade | 82 (70.7%) | 34 (29.3%) |
| Retail Trade | 348 (51.4%) | 329 (48.6%) |
| Transportation & Warehousing | 378 (66.1%) | 194 (33.9%) |
| Utilities | 11 (100.0%) | 0 (0.0%) |
| Information | 0 (0.0%) | 10 (100.0%) |
| Finance & Insurance | 67 (54.9%) | 55 (45.1%) |
| Real Estate, Rental & Leasing | 21 (11.2%) | 166 (88.8%) |
| Professional & Scientific | 115 (47.7%) | 126 (52.3%) |
| Enterprise Management | 0 (0.0%) | 0 (0.0%) |
| Administrative & Support | 249 (61.6%) | 155 (38.4%) |
| Educational Services | 137 (31.1%) | 303 (68.9%) |
| Health Care & Social Assistance | 140 (15.1%) | 788 (84.9%) |
| Arts, Entertainment & Recreation | 145 (85.3%) | 25 (14.7%) |
| Accommodation & Food Services | 53 (18.6%) | 232 (81.4%) |
| Public Administration | 131 (41.2%) | 187 (58.8%) |
| Total | 3,330 (53.7%) | 2,875 (46.3%) |
Education in Prairie Ridge
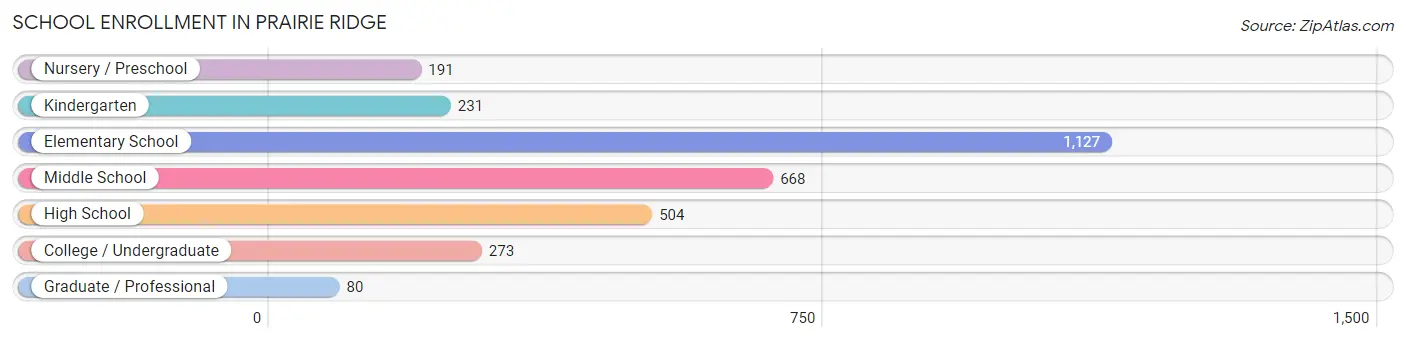
School Enrollment in Prairie Ridge
The most common levels of schooling among the 3,074 students in Prairie Ridge are elementary school (1,127 | 36.7%), middle school (668 | 21.7%), and high school (504 | 16.4%).
| School Level | # Students | % Students |
| Nursery / Preschool | 191 | 6.2% |
| Kindergarten | 231 | 7.5% |
| Elementary School | 1,127 | 36.7% |
| Middle School | 668 | 21.7% |
| High School | 504 | 16.4% |
| College / Undergraduate | 273 | 8.9% |
| Graduate / Professional | 80 | 2.6% |
| Total | 3,074 | 100.0% |
School Enrollment by Age by Funding Source in Prairie Ridge
Out of a total of 3,074 students who are enrolled in schools in Prairie Ridge, 403 (13.1%) attend a private institution, while the remaining 2,671 (86.9%) are enrolled in public schools. The age group of 3 to 4 year olds has the highest likelihood of being enrolled in private schools, with 117 (84.8% in the age bracket) enrolled. Conversely, the age group of 5 to 9 year old has the lowest likelihood of being enrolled in a private school, with 1,118 (94.2% in the age bracket) attending a public institution.
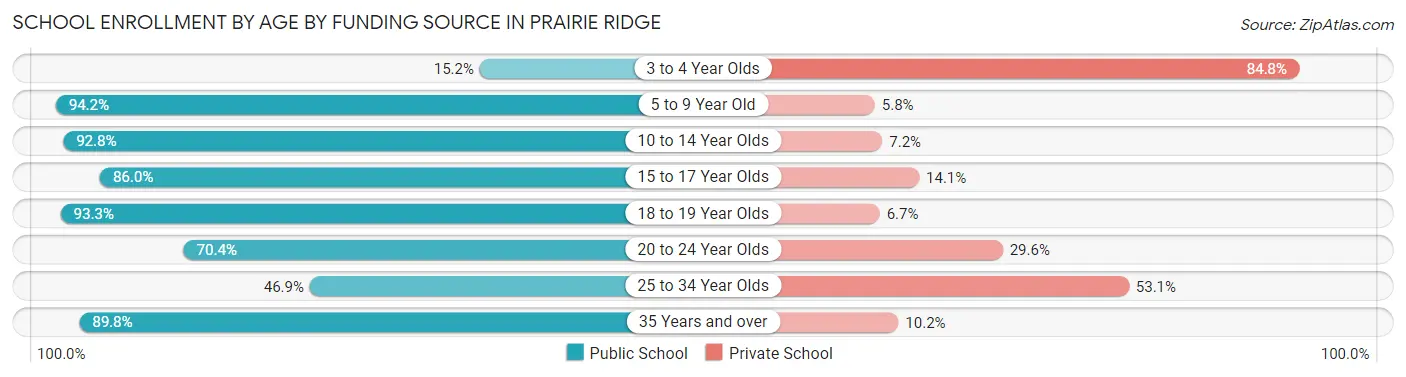
| Age Bracket | Public School | Private School |
| 3 to 4 Year Olds | 21 (15.2%) | 117 (84.8%) |
| 5 to 9 Year Old | 1,118 (94.2%) | 69 (5.8%) |
| 10 to 14 Year Olds | 877 (92.8%) | 68 (7.2%) |
| 15 to 17 Year Olds | 318 (86.0%) | 52 (14.1%) |
| 18 to 19 Year Olds | 139 (93.3%) | 10 (6.7%) |
| 20 to 24 Year Olds | 57 (70.4%) | 24 (29.6%) |
| 25 to 34 Year Olds | 45 (46.9%) | 51 (53.1%) |
| 35 Years and over | 97 (89.8%) | 11 (10.2%) |
| Total | 2,671 (86.9%) | 403 (13.1%) |
Educational Attainment by Field of Study in Prairie Ridge
Business (257 | 20.9%), education (161 | 13.1%), science & technology (140 | 11.4%), arts & humanities (116 | 9.4%), and psychology (113 | 9.2%) are the most common fields of study among 1,232 individuals in Prairie Ridge who have obtained a bachelor's degree or higher.
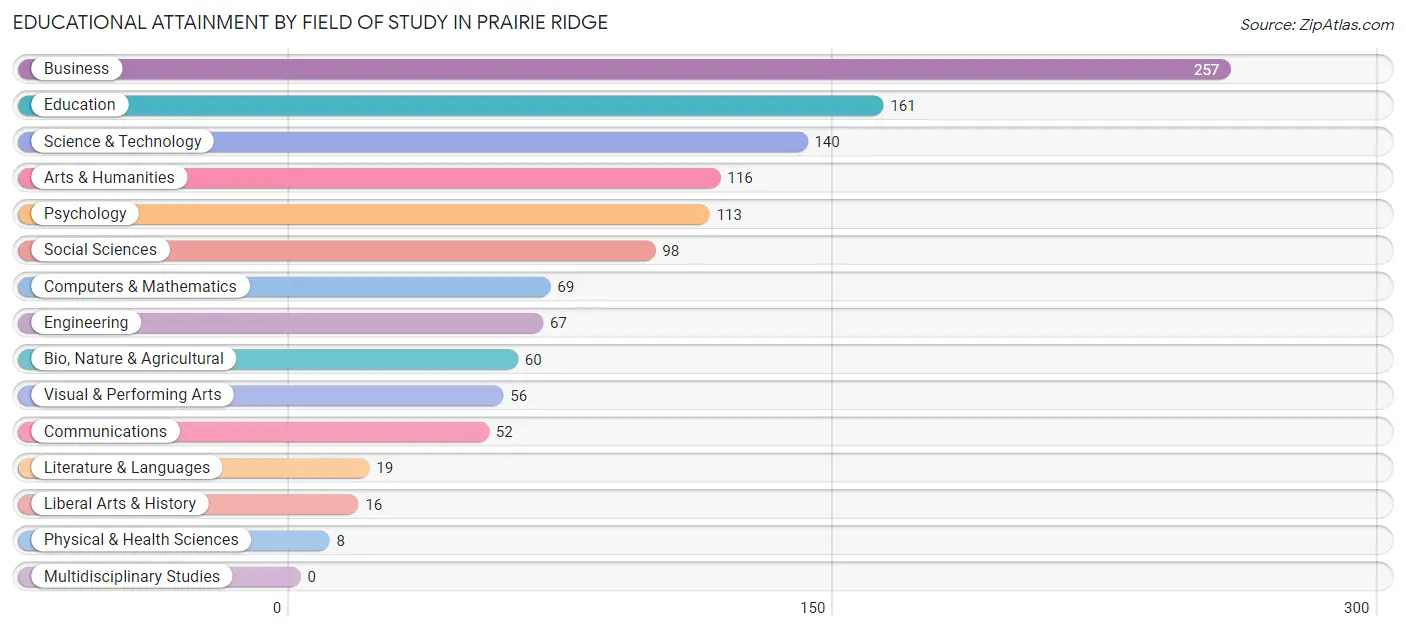
| Field of Study | # Graduates | % Graduates |
| Computers & Mathematics | 69 | 5.6% |
| Bio, Nature & Agricultural | 60 | 4.9% |
| Physical & Health Sciences | 8 | 0.6% |
| Psychology | 113 | 9.2% |
| Social Sciences | 98 | 8.0% |
| Engineering | 67 | 5.4% |
| Multidisciplinary Studies | 0 | 0.0% |
| Science & Technology | 140 | 11.4% |
| Business | 257 | 20.9% |
| Education | 161 | 13.1% |
| Literature & Languages | 19 | 1.5% |
| Liberal Arts & History | 16 | 1.3% |
| Visual & Performing Arts | 56 | 4.5% |
| Communications | 52 | 4.2% |
| Arts & Humanities | 116 | 9.4% |
| Total | 1,232 | 100.0% |
Transportation & Commute in Prairie Ridge
Vehicle Availability by Sex in Prairie Ridge
The most prevalent vehicle ownership categories in Prairie Ridge are males with 2 vehicles (1,195, accounting for 36.7%) and females with 2 vehicles (900, making up 42.8%).
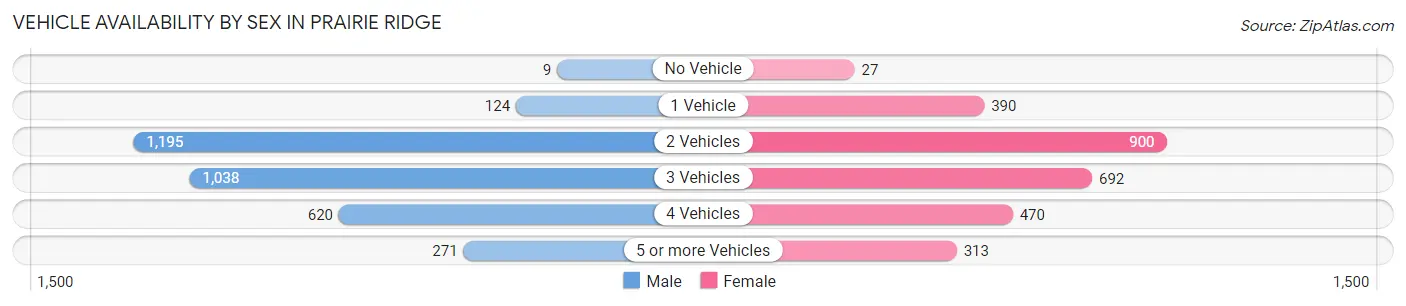
| Vehicles Available | Male | Female |
| No Vehicle | 9 (0.3%) | 27 (1.0%) |
| 1 Vehicle | 124 (3.8%) | 390 (14.0%) |
| 2 Vehicles | 1,195 (36.7%) | 900 (32.2%) |
| 3 Vehicles | 1,038 (31.9%) | 692 (24.8%) |
| 4 Vehicles | 620 (19.0%) | 470 (16.8%) |
| 5 or more Vehicles | 271 (8.3%) | 313 (11.2%) |
| Total | 3,257 (100.0%) | 2,792 (100.0%) |
Commute Time in Prairie Ridge
The most frequently occuring commute durations in Prairie Ridge are 30 to 34 minutes (829 commuters, 14.8%), 45 to 59 minutes (777 commuters, 13.9%), and 20 to 24 minutes (616 commuters, 11.0%).
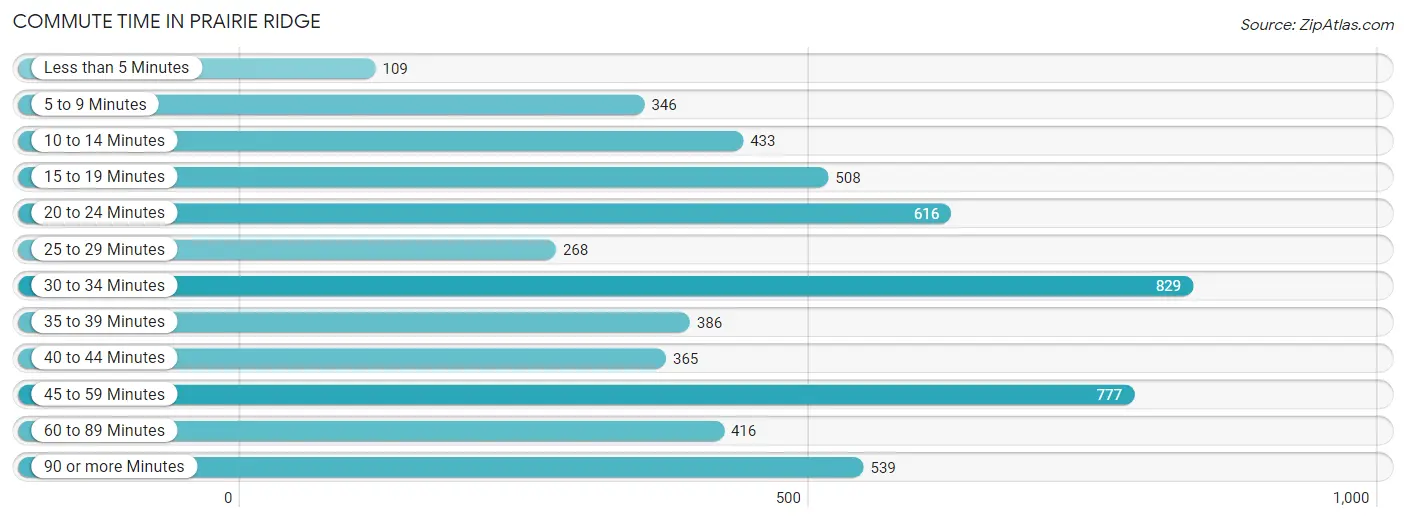
| Commute Time | # Commuters | % Commuters |
| Less than 5 Minutes | 109 | 1.9% |
| 5 to 9 Minutes | 346 | 6.2% |
| 10 to 14 Minutes | 433 | 7.7% |
| 15 to 19 Minutes | 508 | 9.1% |
| 20 to 24 Minutes | 616 | 11.0% |
| 25 to 29 Minutes | 268 | 4.8% |
| 30 to 34 Minutes | 829 | 14.8% |
| 35 to 39 Minutes | 386 | 6.9% |
| 40 to 44 Minutes | 365 | 6.5% |
| 45 to 59 Minutes | 777 | 13.9% |
| 60 to 89 Minutes | 416 | 7.4% |
| 90 or more Minutes | 539 | 9.6% |
Commute Time by Sex in Prairie Ridge
The most common commute times in Prairie Ridge are 45 to 59 minutes (600 commuters, 20.0%) for males and 20 to 24 minutes (396 commuters, 15.3%) for females.
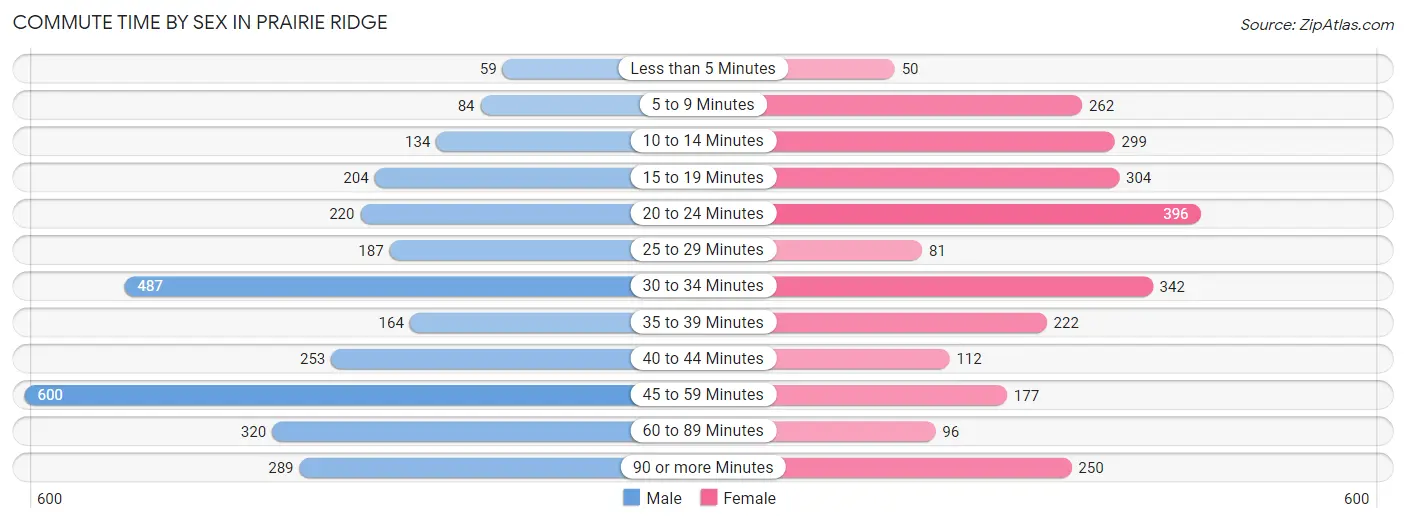
| Commute Time | Male | Female |
| Less than 5 Minutes | 59 (2.0%) | 50 (1.9%) |
| 5 to 9 Minutes | 84 (2.8%) | 262 (10.1%) |
| 10 to 14 Minutes | 134 (4.5%) | 299 (11.5%) |
| 15 to 19 Minutes | 204 (6.8%) | 304 (11.7%) |
| 20 to 24 Minutes | 220 (7.3%) | 396 (15.3%) |
| 25 to 29 Minutes | 187 (6.2%) | 81 (3.1%) |
| 30 to 34 Minutes | 487 (16.2%) | 342 (13.2%) |
| 35 to 39 Minutes | 164 (5.5%) | 222 (8.6%) |
| 40 to 44 Minutes | 253 (8.4%) | 112 (4.3%) |
| 45 to 59 Minutes | 600 (20.0%) | 177 (6.8%) |
| 60 to 89 Minutes | 320 (10.7%) | 96 (3.7%) |
| 90 or more Minutes | 289 (9.6%) | 250 (9.7%) |
Time of Departure to Work by Sex in Prairie Ridge
The most frequent times of departure to work in Prairie Ridge are 12:00 AM to 4:59 AM (653, 21.8%) for males and 7:30 AM to 7:59 AM (466, 18.0%) for females.
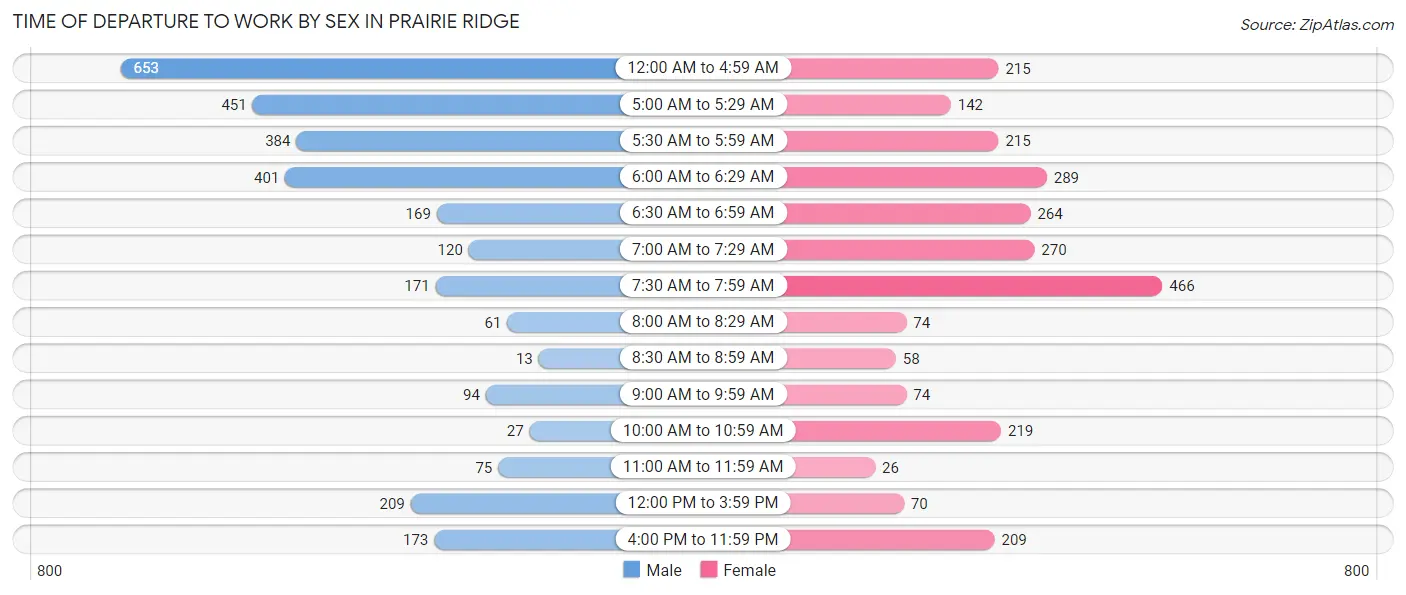
| Time of Departure | Male | Female |
| 12:00 AM to 4:59 AM | 653 (21.8%) | 215 (8.3%) |
| 5:00 AM to 5:29 AM | 451 (15.0%) | 142 (5.5%) |
| 5:30 AM to 5:59 AM | 384 (12.8%) | 215 (8.3%) |
| 6:00 AM to 6:29 AM | 401 (13.4%) | 289 (11.2%) |
| 6:30 AM to 6:59 AM | 169 (5.6%) | 264 (10.2%) |
| 7:00 AM to 7:29 AM | 120 (4.0%) | 270 (10.4%) |
| 7:30 AM to 7:59 AM | 171 (5.7%) | 466 (18.0%) |
| 8:00 AM to 8:29 AM | 61 (2.0%) | 74 (2.9%) |
| 8:30 AM to 8:59 AM | 13 (0.4%) | 58 (2.2%) |
| 9:00 AM to 9:59 AM | 94 (3.1%) | 74 (2.9%) |
| 10:00 AM to 10:59 AM | 27 (0.9%) | 219 (8.5%) |
| 11:00 AM to 11:59 AM | 75 (2.5%) | 26 (1.0%) |
| 12:00 PM to 3:59 PM | 209 (7.0%) | 70 (2.7%) |
| 4:00 PM to 11:59 PM | 173 (5.8%) | 209 (8.1%) |
| Total | 3,001 (100.0%) | 2,591 (100.0%) |
Housing Occupancy in Prairie Ridge
Occupancy by Ownership in Prairie Ridge
Of the total 4,292 dwellings in Prairie Ridge, owner-occupied units account for 3,826 (89.1%), while renter-occupied units make up 466 (10.9%).

| Occupancy | # Housing Units | % Housing Units |
| Owner Occupied Housing Units | 3,826 | 89.1% |
| Renter-Occupied Housing Units | 466 | 10.9% |
| Total Occupied Housing Units | 4,292 | 100.0% |
Occupancy by Household Size in Prairie Ridge
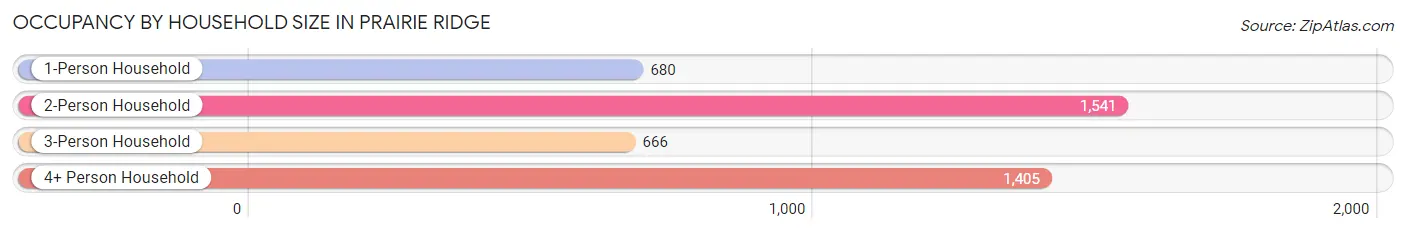
| Household Size | # Housing Units | % Housing Units |
| 1-Person Household | 680 | 15.8% |
| 2-Person Household | 1,541 | 35.9% |
| 3-Person Household | 666 | 15.5% |
| 4+ Person Household | 1,405 | 32.7% |
| Total Housing Units | 4,292 | 100.0% |
Occupancy by Ownership by Household Size in Prairie Ridge
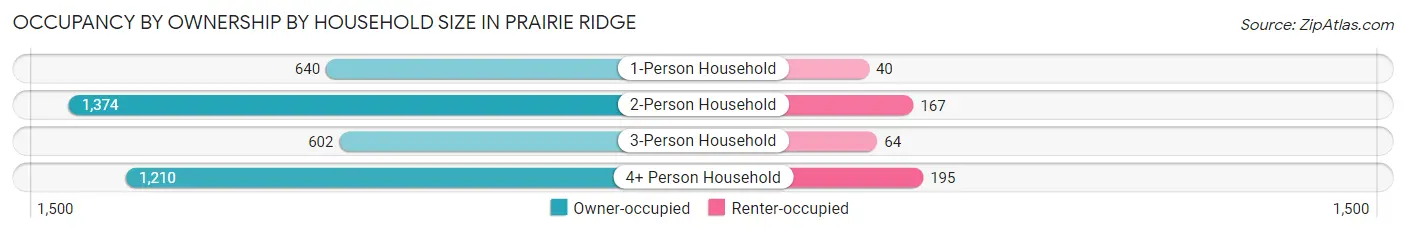
| Household Size | Owner-occupied | Renter-occupied |
| 1-Person Household | 640 (94.1%) | 40 (5.9%) |
| 2-Person Household | 1,374 (89.2%) | 167 (10.8%) |
| 3-Person Household | 602 (90.4%) | 64 (9.6%) |
| 4+ Person Household | 1,210 (86.1%) | 195 (13.9%) |
| Total Housing Units | 3,826 (89.1%) | 466 (10.9%) |
Occupancy by Educational Attainment in Prairie Ridge
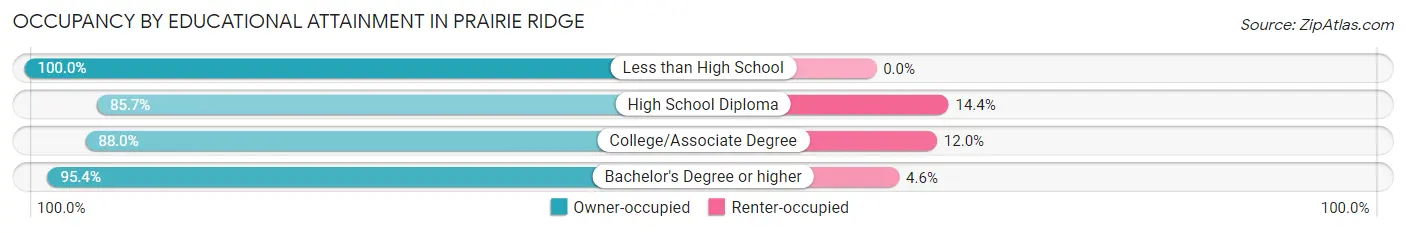
| Household Size | Owner-occupied | Renter-occupied |
| Less than High School | 292 (100.0%) | 0 (0.0%) |
| High School Diploma | 1,247 (85.7%) | 209 (14.3%) |
| College/Associate Degree | 1,659 (88.0%) | 227 (12.0%) |
| Bachelor's Degree or higher | 628 (95.4%) | 30 (4.6%) |
Occupancy by Age of Householder in Prairie Ridge
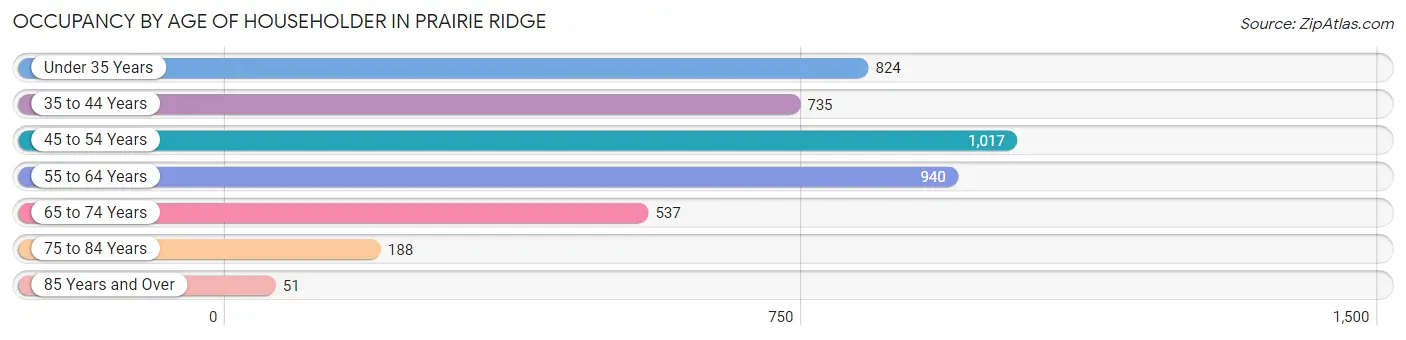
| Age Bracket | # Households | % Households |
| Under 35 Years | 824 | 19.2% |
| 35 to 44 Years | 735 | 17.1% |
| 45 to 54 Years | 1,017 | 23.7% |
| 55 to 64 Years | 940 | 21.9% |
| 65 to 74 Years | 537 | 12.5% |
| 75 to 84 Years | 188 | 4.4% |
| 85 Years and Over | 51 | 1.2% |
| Total | 4,292 | 100.0% |
Housing Finances in Prairie Ridge
Median Income by Occupancy in Prairie Ridge
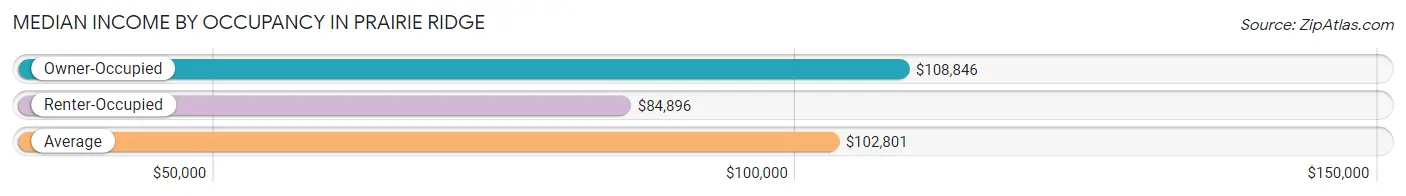
| Occupancy Type | # Households | Median Income |
| Owner-Occupied | 3,826 (89.1%) | $108,846 |
| Renter-Occupied | 466 (10.9%) | $84,896 |
| Average | 4,292 (100.0%) | $102,801 |
Occupancy by Householder Income Bracket in Prairie Ridge
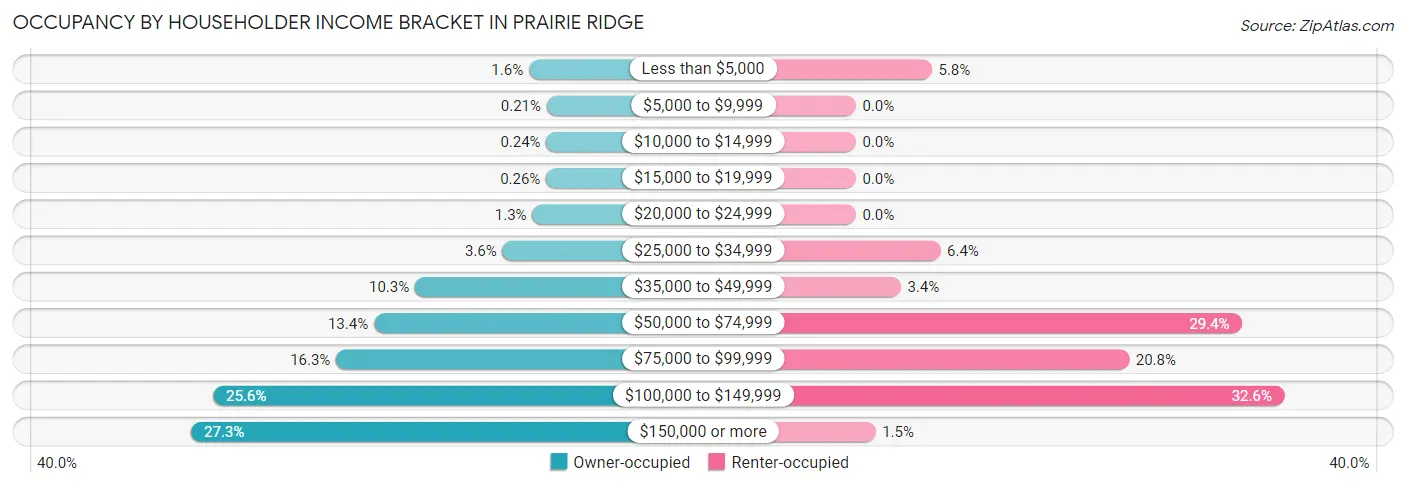
| Income Bracket | Owner-occupied | Renter-occupied |
| Less than $5,000 | 60 (1.6%) | 27 (5.8%) |
| $5,000 to $9,999 | 8 (0.2%) | 0 (0.0%) |
| $10,000 to $14,999 | 9 (0.2%) | 0 (0.0%) |
| $15,000 to $19,999 | 10 (0.3%) | 0 (0.0%) |
| $20,000 to $24,999 | 50 (1.3%) | 0 (0.0%) |
| $25,000 to $34,999 | 137 (3.6%) | 30 (6.4%) |
| $35,000 to $49,999 | 392 (10.2%) | 16 (3.4%) |
| $50,000 to $74,999 | 512 (13.4%) | 137 (29.4%) |
| $75,000 to $99,999 | 622 (16.3%) | 97 (20.8%) |
| $100,000 to $149,999 | 981 (25.6%) | 152 (32.6%) |
| $150,000 or more | 1,045 (27.3%) | 7 (1.5%) |
| Total | 3,826 (100.0%) | 466 (100.0%) |
Monthly Housing Cost Tiers in Prairie Ridge
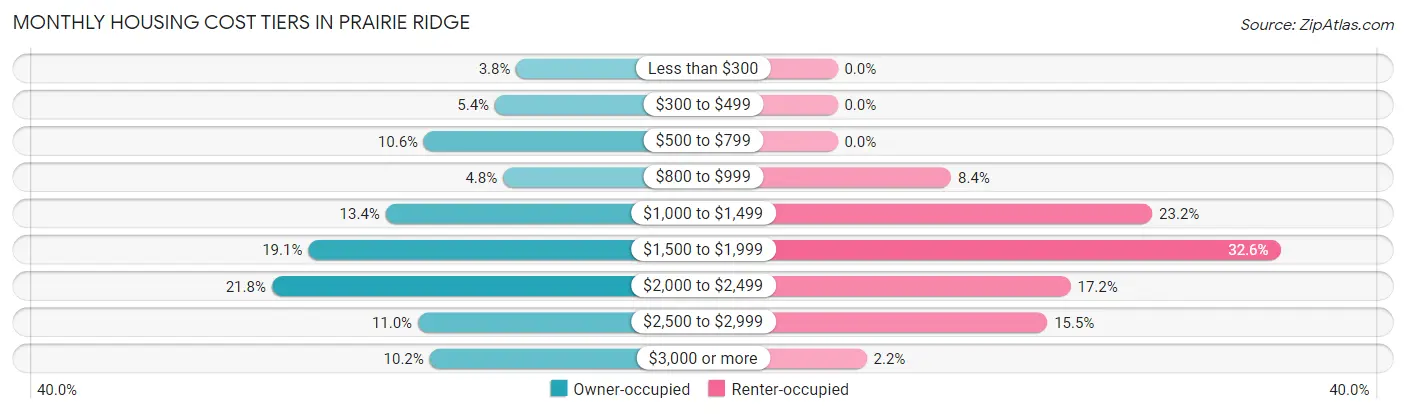
| Monthly Cost | Owner-occupied | Renter-occupied |
| Less than $300 | 145 (3.8%) | 0 (0.0%) |
| $300 to $499 | 205 (5.4%) | 0 (0.0%) |
| $500 to $799 | 405 (10.6%) | 0 (0.0%) |
| $800 to $999 | 182 (4.8%) | 39 (8.4%) |
| $1,000 to $1,499 | 513 (13.4%) | 108 (23.2%) |
| $1,500 to $1,999 | 731 (19.1%) | 152 (32.6%) |
| $2,000 to $2,499 | 834 (21.8%) | 80 (17.2%) |
| $2,500 to $2,999 | 422 (11.0%) | 72 (15.4%) |
| $3,000 or more | 389 (10.2%) | 10 (2.1%) |
| Total | 3,826 (100.0%) | 466 (100.0%) |
Physical Housing Characteristics in Prairie Ridge
Housing Structures in Prairie Ridge
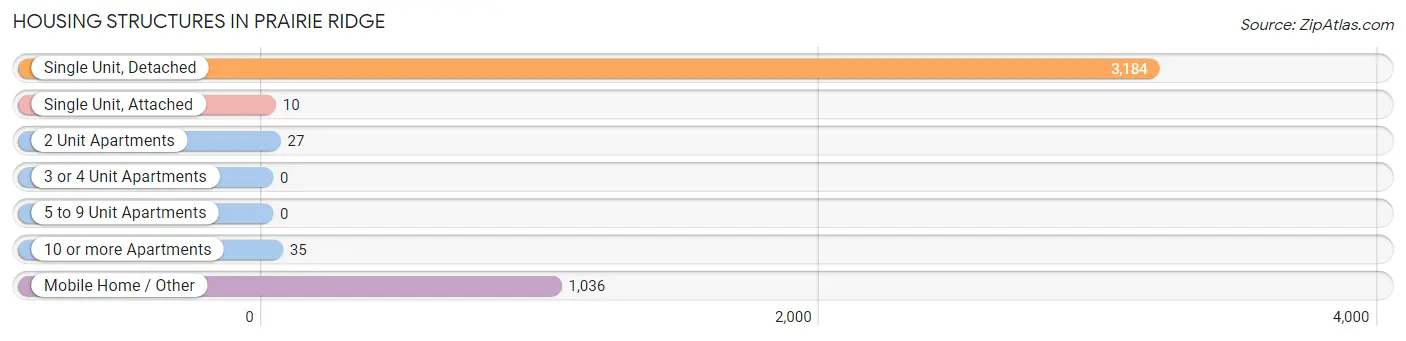
| Structure Type | # Housing Units | % Housing Units |
| Single Unit, Detached | 3,184 | 74.2% |
| Single Unit, Attached | 10 | 0.2% |
| 2 Unit Apartments | 27 | 0.6% |
| 3 or 4 Unit Apartments | 0 | 0.0% |
| 5 to 9 Unit Apartments | 0 | 0.0% |
| 10 or more Apartments | 35 | 0.8% |
| Mobile Home / Other | 1,036 | 24.1% |
| Total | 4,292 | 100.0% |
Housing Structures by Occupancy in Prairie Ridge
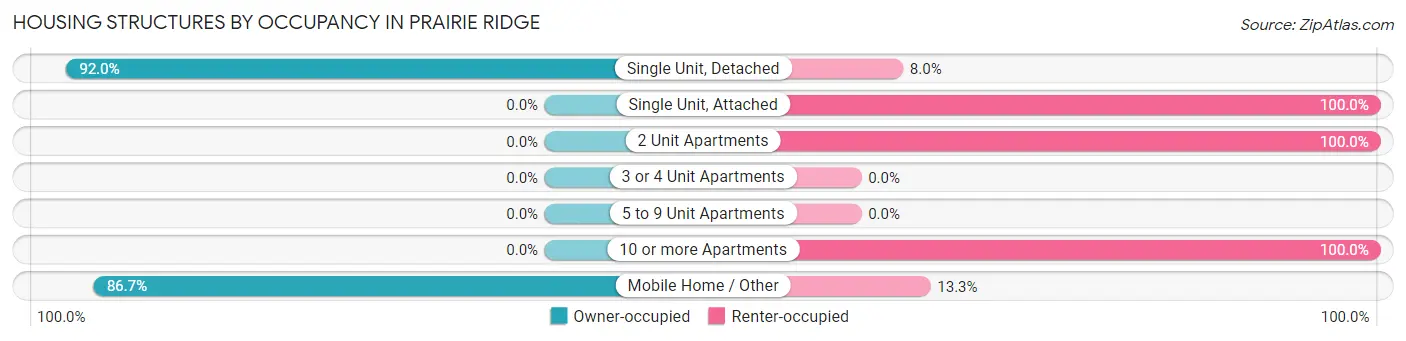
| Structure Type | Owner-occupied | Renter-occupied |
| Single Unit, Detached | 2,928 (92.0%) | 256 (8.0%) |
| Single Unit, Attached | 0 (0.0%) | 10 (100.0%) |
| 2 Unit Apartments | 0 (0.0%) | 27 (100.0%) |
| 3 or 4 Unit Apartments | 0 (0.0%) | 0 (0.0%) |
| 5 to 9 Unit Apartments | 0 (0.0%) | 0 (0.0%) |
| 10 or more Apartments | 0 (0.0%) | 35 (100.0%) |
| Mobile Home / Other | 898 (86.7%) | 138 (13.3%) |
| Total | 3,826 (89.1%) | 466 (10.9%) |
Housing Structures by Number of Rooms in Prairie Ridge
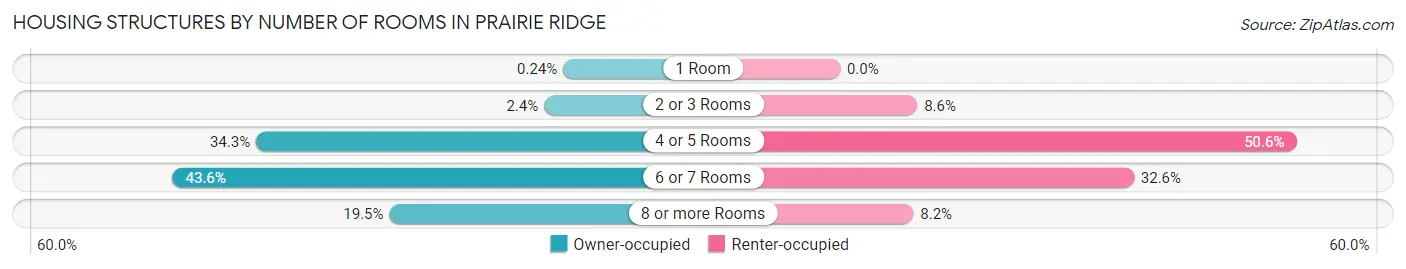
| Number of Rooms | Owner-occupied | Renter-occupied |
| 1 Room | 9 (0.2%) | 0 (0.0%) |
| 2 or 3 Rooms | 90 (2.4%) | 40 (8.6%) |
| 4 or 5 Rooms | 1,313 (34.3%) | 236 (50.6%) |
| 6 or 7 Rooms | 1,667 (43.6%) | 152 (32.6%) |
| 8 or more Rooms | 747 (19.5%) | 38 (8.2%) |
| Total | 3,826 (100.0%) | 466 (100.0%) |
Housing Structure by Heating Type in Prairie Ridge
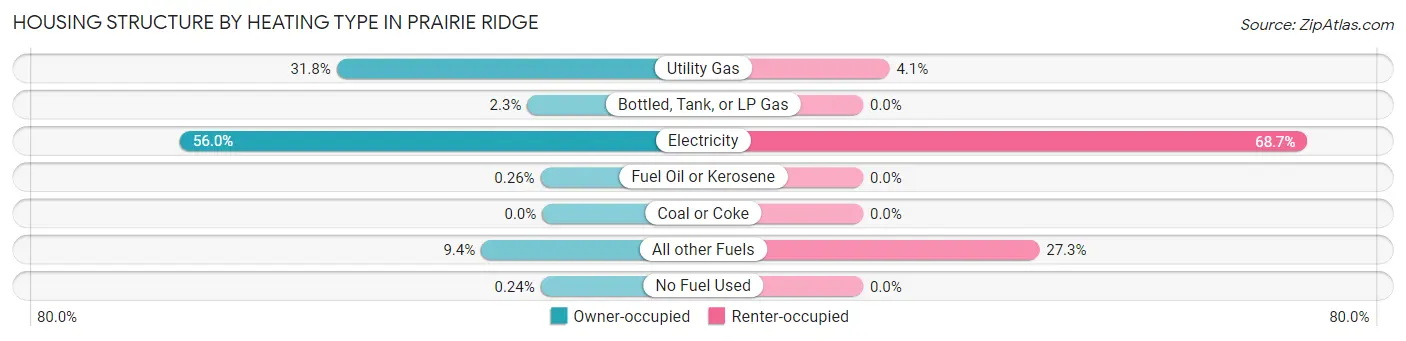
| Heating Type | Owner-occupied | Renter-occupied |
| Utility Gas | 1,216 (31.8%) | 19 (4.1%) |
| Bottled, Tank, or LP Gas | 88 (2.3%) | 0 (0.0%) |
| Electricity | 2,142 (56.0%) | 320 (68.7%) |
| Fuel Oil or Kerosene | 10 (0.3%) | 0 (0.0%) |
| Coal or Coke | 0 (0.0%) | 0 (0.0%) |
| All other Fuels | 361 (9.4%) | 127 (27.3%) |
| No Fuel Used | 9 (0.2%) | 0 (0.0%) |
| Total | 3,826 (100.0%) | 466 (100.0%) |
Household Vehicle Usage in Prairie Ridge
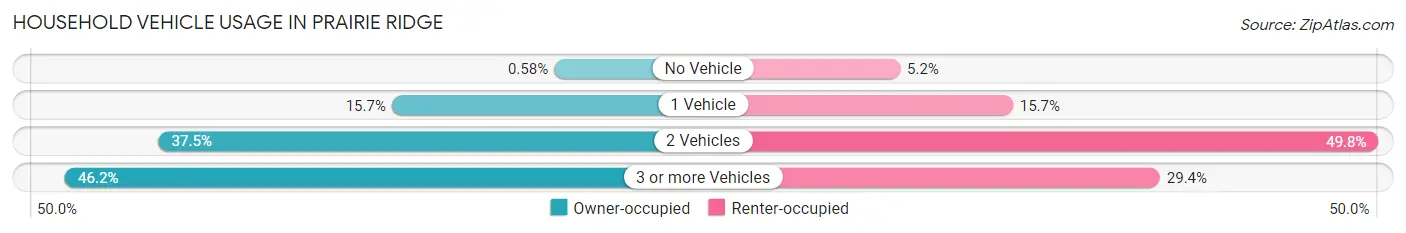
| Vehicles per Household | Owner-occupied | Renter-occupied |
| No Vehicle | 22 (0.6%) | 24 (5.1%) |
| 1 Vehicle | 602 (15.7%) | 73 (15.7%) |
| 2 Vehicles | 1,434 (37.5%) | 232 (49.8%) |
| 3 or more Vehicles | 1,768 (46.2%) | 137 (29.4%) |
| Total | 3,826 (100.0%) | 466 (100.0%) |
Real Estate & Mortgages in Prairie Ridge
Real Estate and Mortgage Overview in Prairie Ridge
| Characteristic | Without Mortgage | With Mortgage |
| Housing Units | 824 | 3,002 |
| Median Property Value | $294,100 | $415,000 |
| Median Household Income | $68,393 | $894 |
| Monthly Housing Costs | $612 | $389 |
| Real Estate Taxes | $2,880 | $79 |
Property Value by Mortgage Status in Prairie Ridge
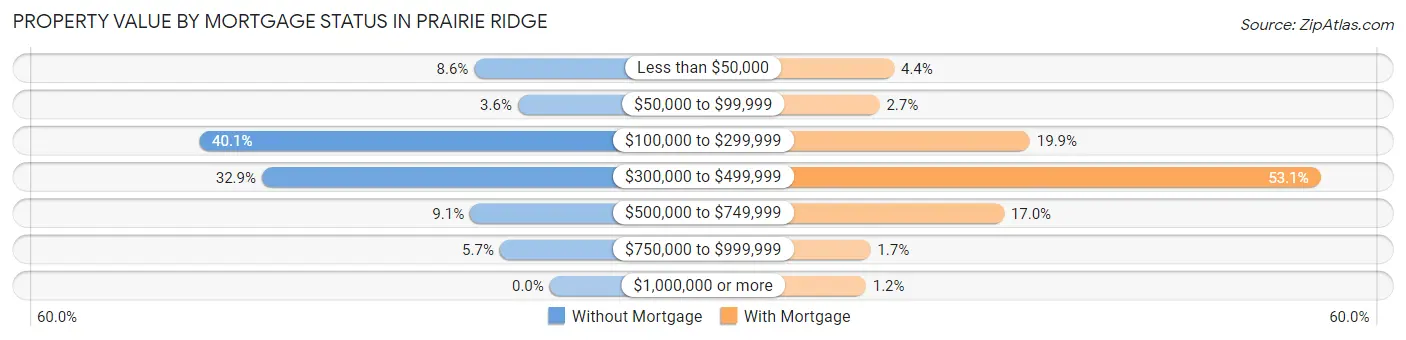
| Property Value | Without Mortgage | With Mortgage |
| Less than $50,000 | 71 (8.6%) | 132 (4.4%) |
| $50,000 to $99,999 | 30 (3.6%) | 82 (2.7%) |
| $100,000 to $299,999 | 330 (40.1%) | 598 (19.9%) |
| $300,000 to $499,999 | 271 (32.9%) | 1,595 (53.1%) |
| $500,000 to $749,999 | 75 (9.1%) | 509 (17.0%) |
| $750,000 to $999,999 | 47 (5.7%) | 51 (1.7%) |
| $1,000,000 or more | 0 (0.0%) | 35 (1.2%) |
| Total | 824 (100.0%) | 3,002 (100.0%) |
Household Income by Mortgage Status in Prairie Ridge
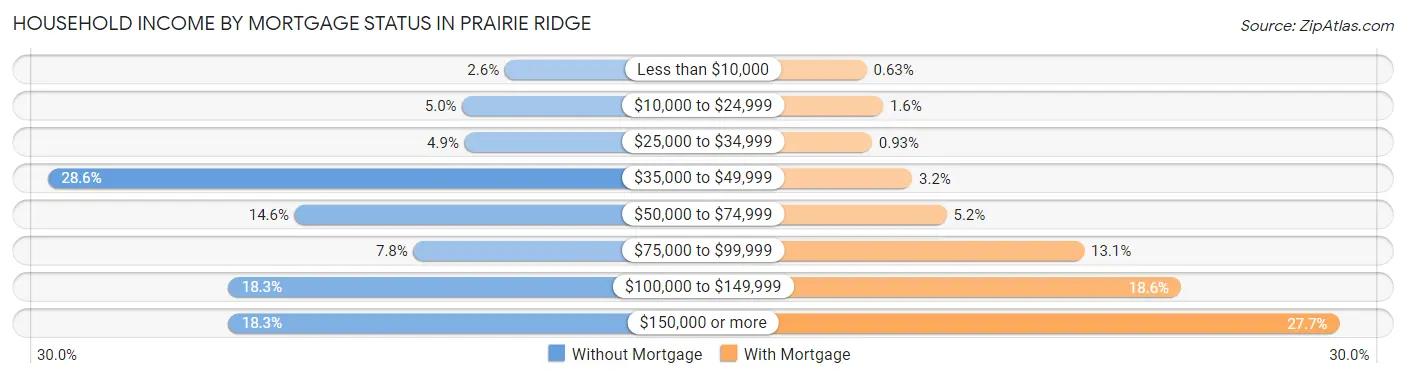
| Household Income | Without Mortgage | With Mortgage |
| Less than $10,000 | 21 (2.5%) | 19 (0.6%) |
| $10,000 to $24,999 | 41 (5.0%) | 47 (1.6%) |
| $25,000 to $34,999 | 40 (4.9%) | 28 (0.9%) |
| $35,000 to $49,999 | 236 (28.6%) | 97 (3.2%) |
| $50,000 to $74,999 | 120 (14.6%) | 156 (5.2%) |
| $75,000 to $99,999 | 64 (7.8%) | 392 (13.1%) |
| $100,000 to $149,999 | 151 (18.3%) | 558 (18.6%) |
| $150,000 or more | 151 (18.3%) | 830 (27.7%) |
| Total | 824 (100.0%) | 3,002 (100.0%) |
Property Value to Household Income Ratio in Prairie Ridge
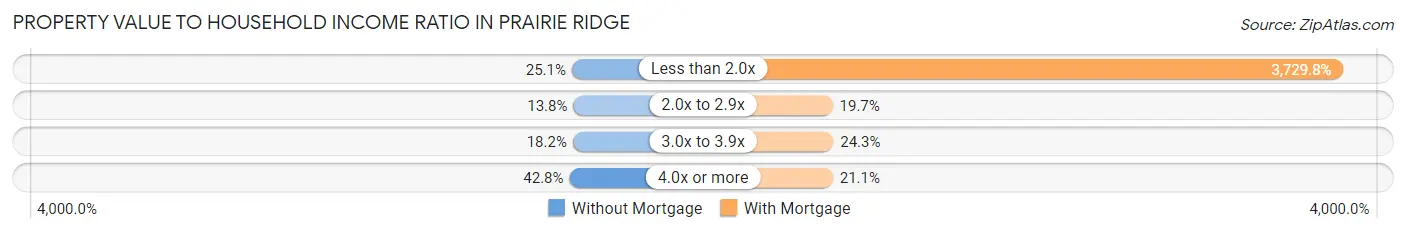
| Value-to-Income Ratio | Without Mortgage | With Mortgage |
| Less than 2.0x | 207 (25.1%) | 111,968 (3,729.8%) |
| 2.0x to 2.9x | 114 (13.8%) | 591 (19.7%) |
| 3.0x to 3.9x | 150 (18.2%) | 729 (24.3%) |
| 4.0x or more | 353 (42.8%) | 633 (21.1%) |
| Total | 824 (100.0%) | 3,002 (100.0%) |
Real Estate Taxes by Mortgage Status in Prairie Ridge
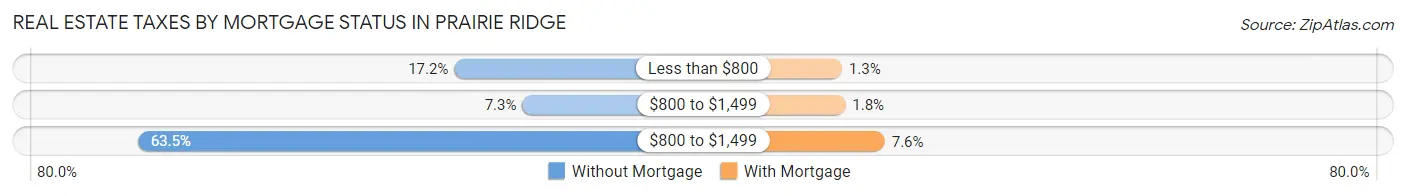
| Property Taxes | Without Mortgage | With Mortgage |
| Less than $800 | 142 (17.2%) | 39 (1.3%) |
| $800 to $1,499 | 60 (7.3%) | 54 (1.8%) |
| $800 to $1,499 | 523 (63.5%) | 227 (7.6%) |
| Total | 824 (100.0%) | 3,002 (100.0%) |
Health & Disability in Prairie Ridge
Health Insurance Coverage by Age in Prairie Ridge
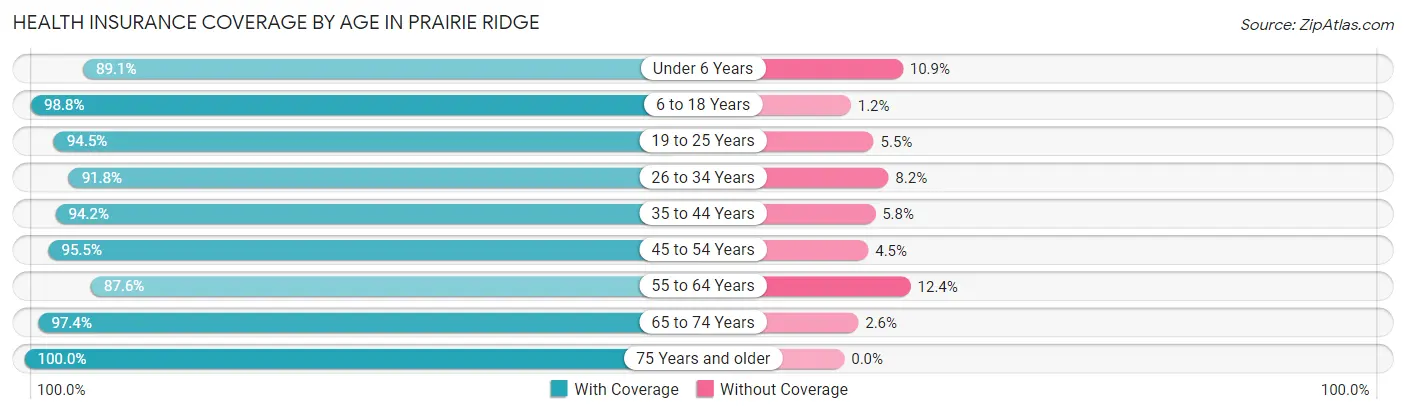
| Age Bracket | With Coverage | Without Coverage |
| Under 6 Years | 800 (89.1%) | 98 (10.9%) |
| 6 to 18 Years | 2,451 (98.8%) | 30 (1.2%) |
| 19 to 25 Years | 1,019 (94.5%) | 59 (5.5%) |
| 26 to 34 Years | 1,383 (91.8%) | 124 (8.2%) |
| 35 to 44 Years | 1,683 (94.2%) | 103 (5.8%) |
| 45 to 54 Years | 1,730 (95.5%) | 81 (4.5%) |
| 55 to 64 Years | 1,403 (87.6%) | 198 (12.4%) |
| 65 to 74 Years | 821 (97.4%) | 22 (2.6%) |
| 75 Years and older | 428 (100.0%) | 0 (0.0%) |
| Total | 11,718 (94.3%) | 715 (5.8%) |
Health Insurance Coverage by Citizenship Status in Prairie Ridge
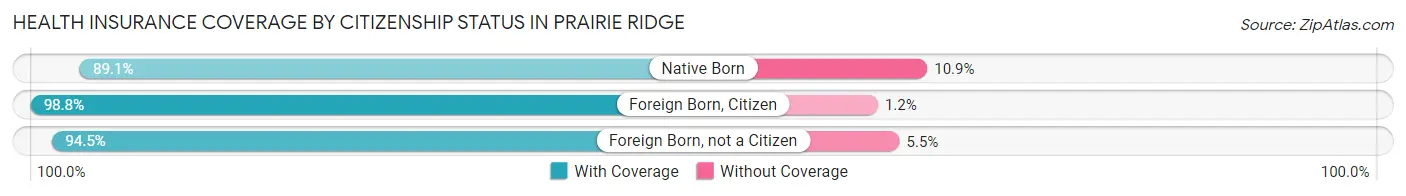
| Citizenship Status | With Coverage | Without Coverage |
| Native Born | 800 (89.1%) | 98 (10.9%) |
| Foreign Born, Citizen | 2,451 (98.8%) | 30 (1.2%) |
| Foreign Born, not a Citizen | 1,019 (94.5%) | 59 (5.5%) |
Health Insurance Coverage by Household Income in Prairie Ridge
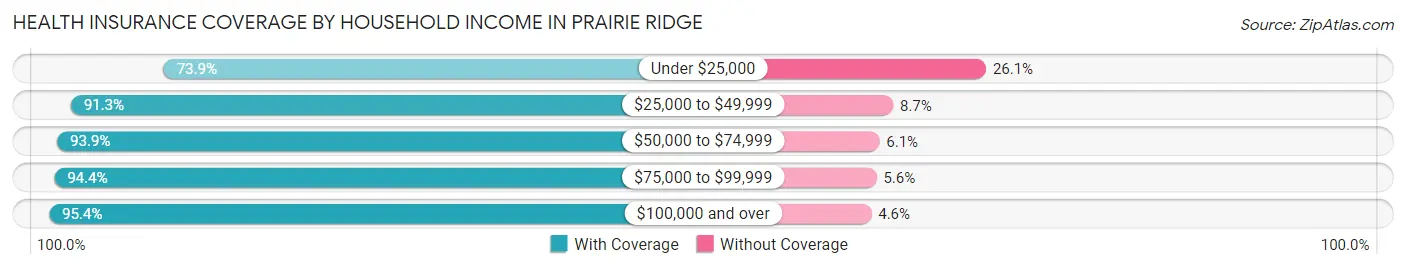
| Household Income | With Coverage | Without Coverage |
| Under $25,000 | 173 (73.9%) | 61 (26.1%) |
| $25,000 to $49,999 | 991 (91.3%) | 94 (8.7%) |
| $50,000 to $74,999 | 1,816 (93.9%) | 118 (6.1%) |
| $75,000 to $99,999 | 2,006 (94.4%) | 118 (5.6%) |
| $100,000 and over | 6,732 (95.4%) | 324 (4.6%) |
Public vs Private Health Insurance Coverage by Age in Prairie Ridge
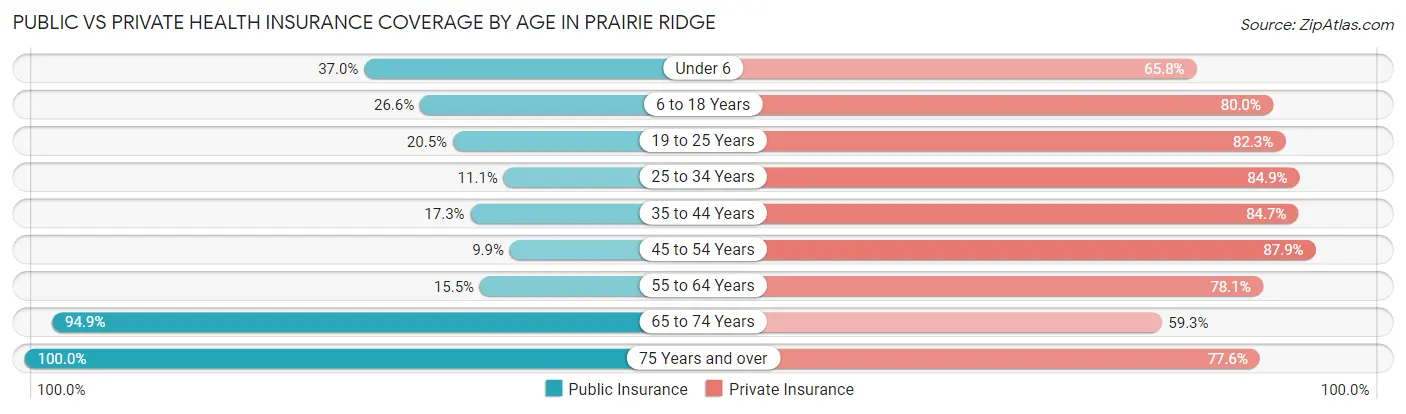
| Age Bracket | Public Insurance | Private Insurance |
| Under 6 | 332 (37.0%) | 591 (65.8%) |
| 6 to 18 Years | 660 (26.6%) | 1,985 (80.0%) |
| 19 to 25 Years | 221 (20.5%) | 887 (82.3%) |
| 25 to 34 Years | 167 (11.1%) | 1,280 (84.9%) |
| 35 to 44 Years | 308 (17.2%) | 1,513 (84.7%) |
| 45 to 54 Years | 180 (9.9%) | 1,592 (87.9%) |
| 55 to 64 Years | 248 (15.5%) | 1,250 (78.1%) |
| 65 to 74 Years | 800 (94.9%) | 500 (59.3%) |
| 75 Years and over | 428 (100.0%) | 332 (77.6%) |
| Total | 3,344 (26.9%) | 9,930 (79.9%) |
Disability Status by Sex by Age in Prairie Ridge
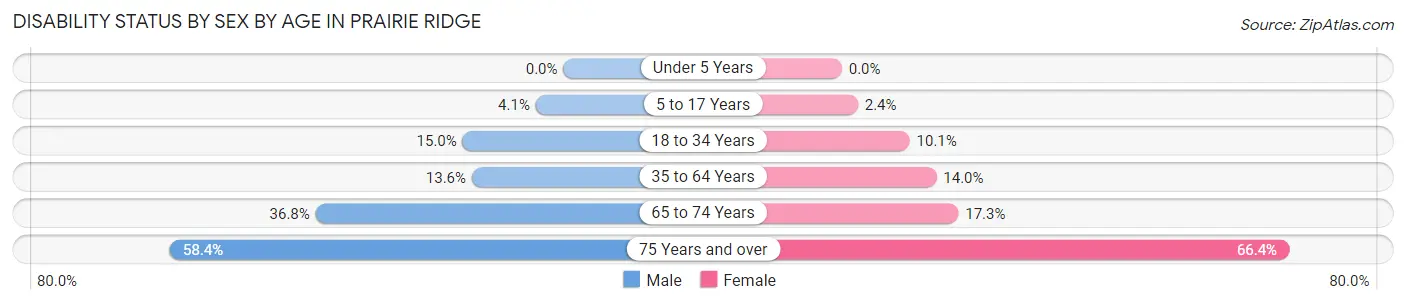
| Age Bracket | Male | Female |
| Under 5 Years | 0 (0.0%) | 0 (0.0%) |
| 5 to 17 Years | 57 (4.1%) | 28 (2.4%) |
| 18 to 34 Years | 204 (15.0%) | 134 (10.1%) |
| 35 to 64 Years | 360 (13.6%) | 358 (14.0%) |
| 65 to 74 Years | 174 (36.8%) | 64 (17.3%) |
| 75 Years and over | 111 (58.4%) | 158 (66.4%) |
Disability Class by Sex by Age in Prairie Ridge
Disability Class: Hearing Difficulty
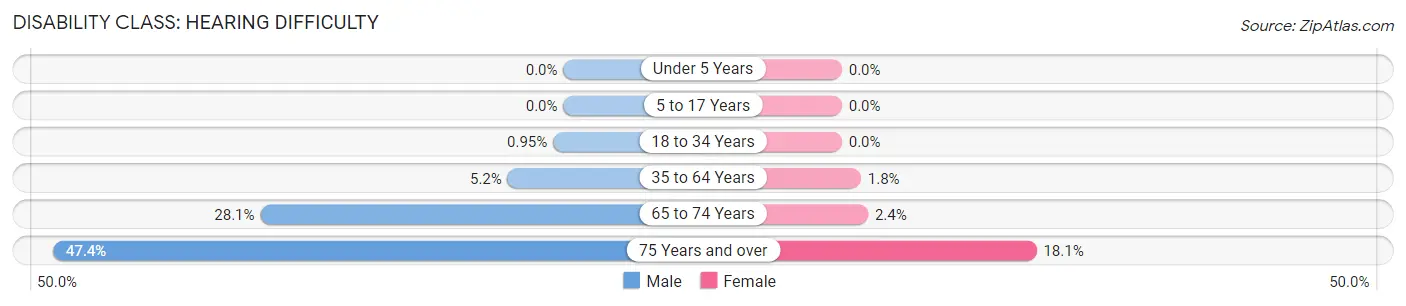
| Age Bracket | Male | Female |
| Under 5 Years | 0 (0.0%) | 0 (0.0%) |
| 5 to 17 Years | 0 (0.0%) | 0 (0.0%) |
| 18 to 34 Years | 13 (0.9%) | 0 (0.0%) |
| 35 to 64 Years | 137 (5.2%) | 45 (1.8%) |
| 65 to 74 Years | 133 (28.1%) | 9 (2.4%) |
| 75 Years and over | 90 (47.4%) | 43 (18.1%) |
Disability Class: Vision Difficulty
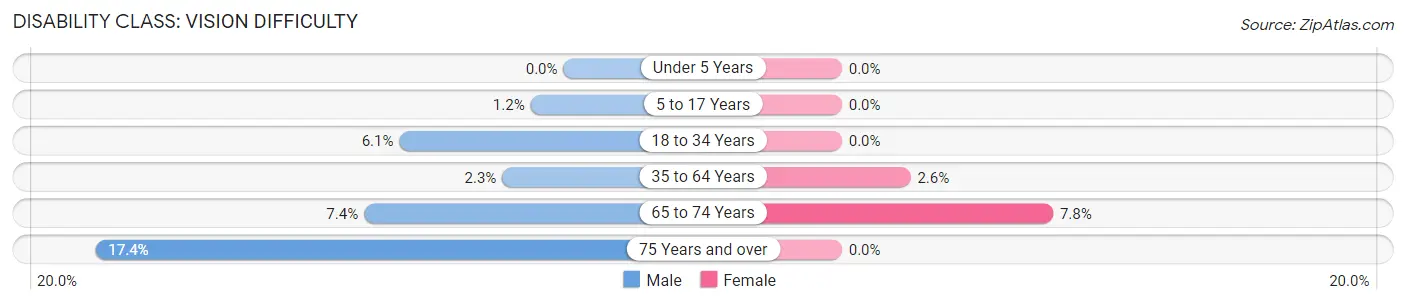
| Age Bracket | Male | Female |
| Under 5 Years | 0 (0.0%) | 0 (0.0%) |
| 5 to 17 Years | 17 (1.2%) | 0 (0.0%) |
| 18 to 34 Years | 83 (6.1%) | 0 (0.0%) |
| 35 to 64 Years | 60 (2.3%) | 65 (2.5%) |
| 65 to 74 Years | 35 (7.4%) | 29 (7.8%) |
| 75 Years and over | 33 (17.4%) | 0 (0.0%) |
Disability Class: Cognitive Difficulty
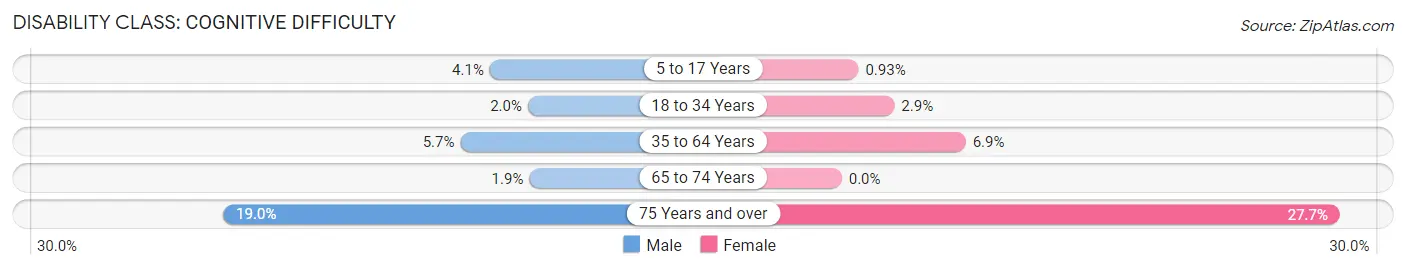
| Age Bracket | Male | Female |
| 5 to 17 Years | 57 (4.1%) | 11 (0.9%) |
| 18 to 34 Years | 27 (2.0%) | 39 (2.9%) |
| 35 to 64 Years | 152 (5.7%) | 176 (6.9%) |
| 65 to 74 Years | 9 (1.9%) | 0 (0.0%) |
| 75 Years and over | 36 (19.0%) | 66 (27.7%) |
Disability Class: Ambulatory Difficulty
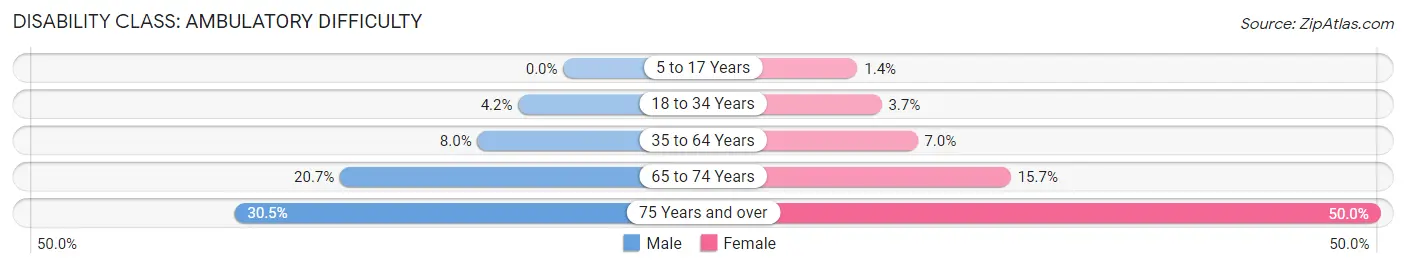
| Age Bracket | Male | Female |
| 5 to 17 Years | 0 (0.0%) | 17 (1.4%) |
| 18 to 34 Years | 57 (4.2%) | 49 (3.7%) |
| 35 to 64 Years | 211 (8.0%) | 179 (7.0%) |
| 65 to 74 Years | 98 (20.7%) | 58 (15.7%) |
| 75 Years and over | 58 (30.5%) | 119 (50.0%) |
Disability Class: Self-Care Difficulty
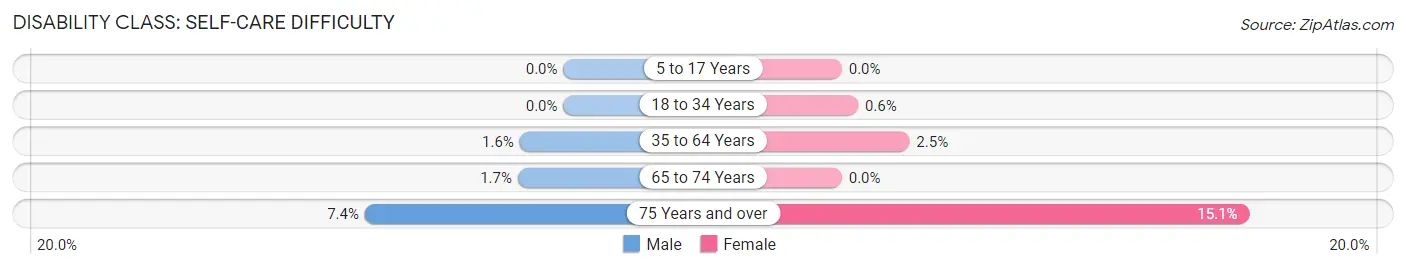
| Age Bracket | Male | Female |
| 5 to 17 Years | 0 (0.0%) | 0 (0.0%) |
| 18 to 34 Years | 0 (0.0%) | 8 (0.6%) |
| 35 to 64 Years | 43 (1.6%) | 64 (2.5%) |
| 65 to 74 Years | 8 (1.7%) | 0 (0.0%) |
| 75 Years and over | 14 (7.4%) | 36 (15.1%) |
Technology Access in Prairie Ridge
Computing Device Access in Prairie Ridge
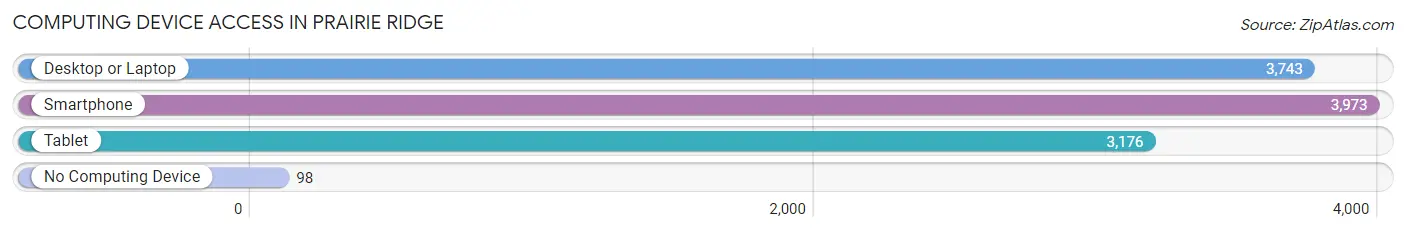
| Device Type | # Households | % Households |
| Desktop or Laptop | 3,743 | 87.2% |
| Smartphone | 3,973 | 92.6% |
| Tablet | 3,176 | 74.0% |
| No Computing Device | 98 | 2.3% |
| Total | 4,292 | 100.0% |
Internet Access in Prairie Ridge
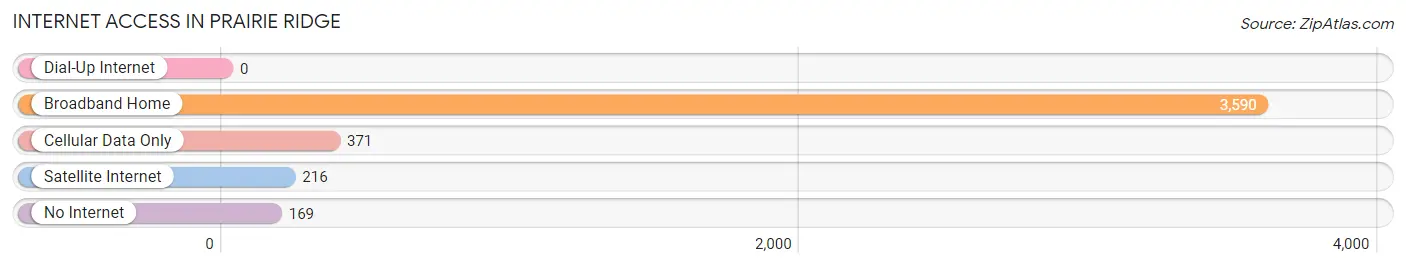
| Internet Type | # Households | % Households |
| Dial-Up Internet | 0 | 0.0% |
| Broadband Home | 3,590 | 83.6% |
| Cellular Data Only | 371 | 8.6% |
| Satellite Internet | 216 | 5.0% |
| No Internet | 169 | 3.9% |
| Total | 4,292 | 100.0% |
Prairie Ridge Summary
Prairie Ridge is a small unincorporated community located in Pierce County, Washington, United States. It is situated in the foothills of the Cascade Mountains, approximately 25 miles east of Tacoma and 30 miles south of Seattle. The community is located in the Puyallup River Valley, and is surrounded by the cities of Puyallup, Sumner, and Orting.
History
The area that is now Prairie Ridge was first settled in the late 1800s by homesteaders who were attracted to the area’s fertile soil and abundant natural resources. The first settlers were primarily of German and Scandinavian descent, and the community was known as “Prairie Ridge” due to its location on a ridge overlooking the Puyallup River Valley.
In the early 1900s, the area was home to a number of small farms and orchards, as well as a few small businesses. The community was also home to a one-room schoolhouse, which served the area’s children until it closed in the 1950s.
In the late 1950s, the area began to experience rapid growth as the population of the nearby cities of Puyallup, Sumner, and Orting began to expand. This growth led to the development of several new neighborhoods in the area, as well as the construction of a new elementary school.
Geography
Prairie Ridge is located in the foothills of the Cascade Mountains, approximately 25 miles east of Tacoma and 30 miles south of Seattle. The community is situated in the Puyallup River Valley, and is surrounded by the cities of Puyallup, Sumner, and Orting.
The area is characterized by rolling hills, lush forests, and numerous streams and rivers. The climate is mild and temperate, with warm summers and cool winters.
Economy
The economy of Prairie Ridge is largely based on agriculture and tourism. The area is home to several small farms and orchards, as well as a number of wineries and breweries. The community is also home to a number of small businesses, including restaurants, retail stores, and professional services.
Demographics
As of the 2010 census, the population of Prairie Ridge was 1,845. The racial makeup of the community was 87.3% White, 5.2% Hispanic or Latino, 2.2% Asian, 1.7% African American, and 0.8% Native American. The median household income was $60,938, and the median home value was $269,000.
Conclusion
Prairie Ridge is a small unincorporated community located in Pierce County, Washington. It is situated in the foothills of the Cascade Mountains, and is surrounded by the cities of Puyallup, Sumner, and Orting. The area was first settled in the late 1800s by homesteaders, and the economy is largely based on agriculture and tourism. As of the 2010 census, the population of Prairie Ridge was 1,845. The racial makeup of the community was 87.3% White, 5.2% Hispanic or Latino, 2.2% Asian, 1.7% African American, and 0.8% Native American. The median household income was $60,938, and the median home value was $269,000.
Common Questions
What is Per Capita Income in Prairie Ridge?
Per Capita income in Prairie Ridge is $42,581.
What is the Median Family Income in Prairie Ridge?
Median Family Income in Prairie Ridge is $105,821.
What is the Median Household income in Prairie Ridge?
Median Household Income in Prairie Ridge is $102,801.
What is Income or Wage Gap in Prairie Ridge?
Income or Wage Gap in Prairie Ridge is 24.7%.
Women in Prairie Ridge earn 75.3 cents for every dollar earned by a man.
What is Inequality or Gini Index in Prairie Ridge?
Inequality or Gini Index in Prairie Ridge is 0.38.
What is the Total Population of Prairie Ridge?
Total Population of Prairie Ridge is 12,444.
What is the Total Male Population of Prairie Ridge?
Total Male Population of Prairie Ridge is 6,402.
What is the Total Female Population of Prairie Ridge?
Total Female Population of Prairie Ridge is 6,042.
What is the Ratio of Males per 100 Females in Prairie Ridge?
There are 105.96 Males per 100 Females in Prairie Ridge.
What is the Ratio of Females per 100 Males in Prairie Ridge?
There are 94.38 Females per 100 Males in Prairie Ridge.
What is the Median Population Age in Prairie Ridge?
Median Population Age in Prairie Ridge is 36.3 Years.
What is the Average Family Size in Prairie Ridge
Average Family Size in Prairie Ridge is 3.2 People.
What is the Average Household Size in Prairie Ridge
Average Household Size in Prairie Ridge is 2.9 People.
How Large is the Labor Force in Prairie Ridge?
There are 6,685 People in the Labor Forcein in Prairie Ridge.
What is the Percentage of People in the Labor Force in Prairie Ridge?
71.1% of People are in the Labor Force in Prairie Ridge.
What is the Unemployment Rate in Prairie Ridge?
Unemployment Rate in Prairie Ridge is 7.0%.