Zip Codes with the Highest Percentage of Population Carpooling to Work in Millstone Township, NJ
RELATED REPORTS & OPTIONS
Drive | Carpool
Millstone Township
Compare Zip Codes
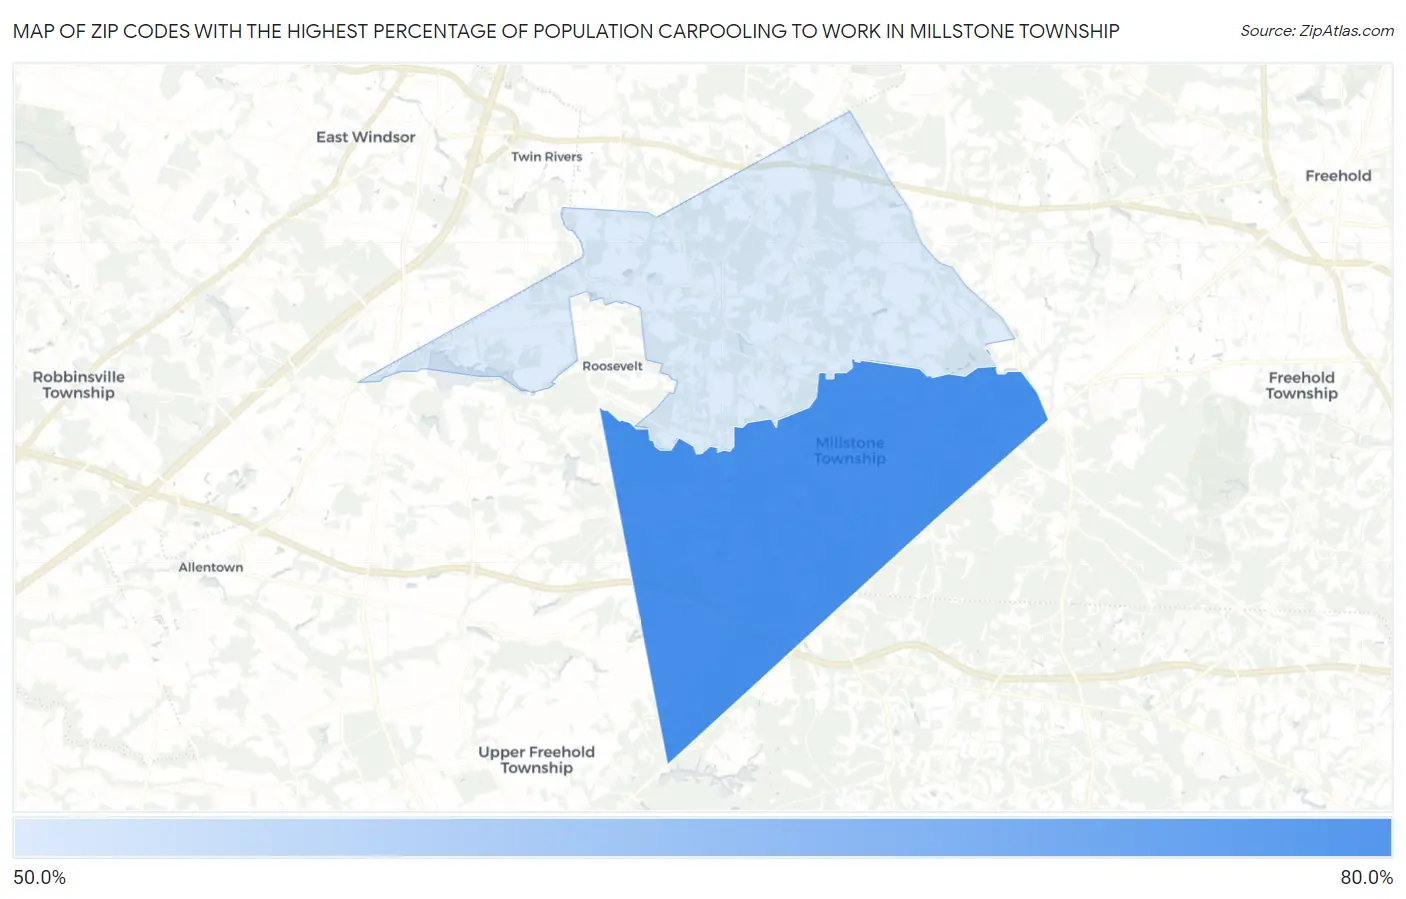
Map of Zip Codes with the Highest Percentage of Population Carpooling to Work in Millstone Township
51.4%
60.7%
Zip Codes with the Highest Percentage of Population Carpooling to Work in Millstone Township, NJ
| Zip Code | % Carpool | vs State | vs National | |
| 1. | 08510 | 60.7% | 40.8%(+19.9)#8 | 38.2%(+22.5)#406 |
| 2. | 08535 | 51.4% | 40.8%(+10.6)#64 | 38.2%(+13.2)#2,289 |
1
Common Questions
What are the Top Zip Codes with the Highest Percentage of Population Carpooling to Work in Millstone Township, NJ?
Top Zip Codes with the Highest Percentage of Population Carpooling to Work in Millstone Township, NJ are:
What zip code has the Highest Percentage of Population Carpooling to Work in Millstone Township, NJ?
08510 has the Highest Percentage of Population Carpooling to Work in Millstone Township, NJ with 60.7%.
What is the Percentage of Population Carpooling to Work in New Jersey?
Percentage of Population Carpooling to Work in New Jersey is 40.8%.
What is the Percentage of Population Carpooling to Work in the United States?
Percentage of Population Carpooling to Work in the United States is 38.2%.