Matawan borough, NJ Map & Demographics
Matawan borough Overview
$53,663
PER CAPITA INCOME
$137,179
AVG FAMILY INCOME
$125,040
AVG HOUSEHOLD INCOME
24.6%
WAGE / INCOME GAP [ % ]
75.4¢/ $1
WAGE / INCOME GAP [ $ ]
0.38
INEQUALITY / GINI INDEX
9,546
TOTAL POPULATION
5,081
MALE POPULATION
4,465
FEMALE POPULATION
113.80
MALES / 100 FEMALES
87.88
FEMALES / 100 MALES
38.0
MEDIAN AGE
3.2
AVG FAMILY SIZE
2.5
AVG HOUSEHOLD SIZE
5,716
LABOR FORCE [ PEOPLE ]
75.0%
PERCENT IN LABOR FORCE
4.3%
UNEMPLOYMENT RATE
Income in Matawan borough
Income Overview in Matawan borough
Per Capita Income in Matawan borough is $53,663, while median incomes of families and households are $137,179 and $125,040 respectively.
| Characteristic | Number | Measure |
| Per Capita Income | 9,546 | $53,663 |
| Median Family Income | 2,208 | $137,179 |
| Mean Family Income | 2,208 | $163,356 |
| Median Household Income | 3,775 | $125,040 |
| Mean Household Income | 3,775 | $136,829 |
| Income Deficit | 2,208 | $0 |
| Wage / Income Gap (%) | 9,546 | 24.63% |
| Wage / Income Gap ($) | 9,546 | 75.37¢ per $1 |
| Gini / Inequality Index | 9,546 | 0.38 |
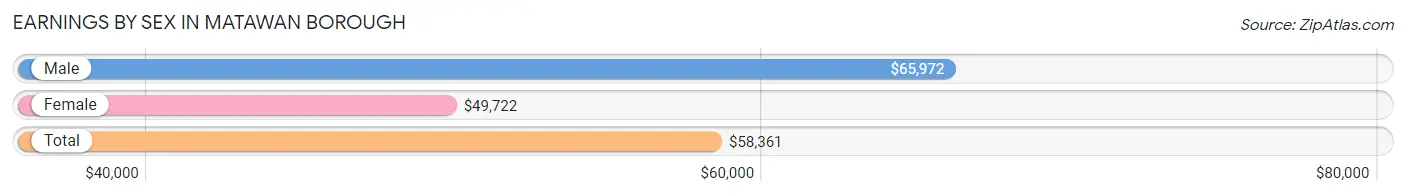
Earnings by Sex in Matawan borough
Average Earnings in Matawan borough are $58,361, $65,972 for men and $49,722 for women, a difference of 24.6%.
| Sex | Number | Average Earnings |
| Male | 3,448 (59.0%) | $65,972 |
| Female | 2,396 (41.0%) | $49,722 |
| Total | 5,844 (100.0%) | $58,361 |
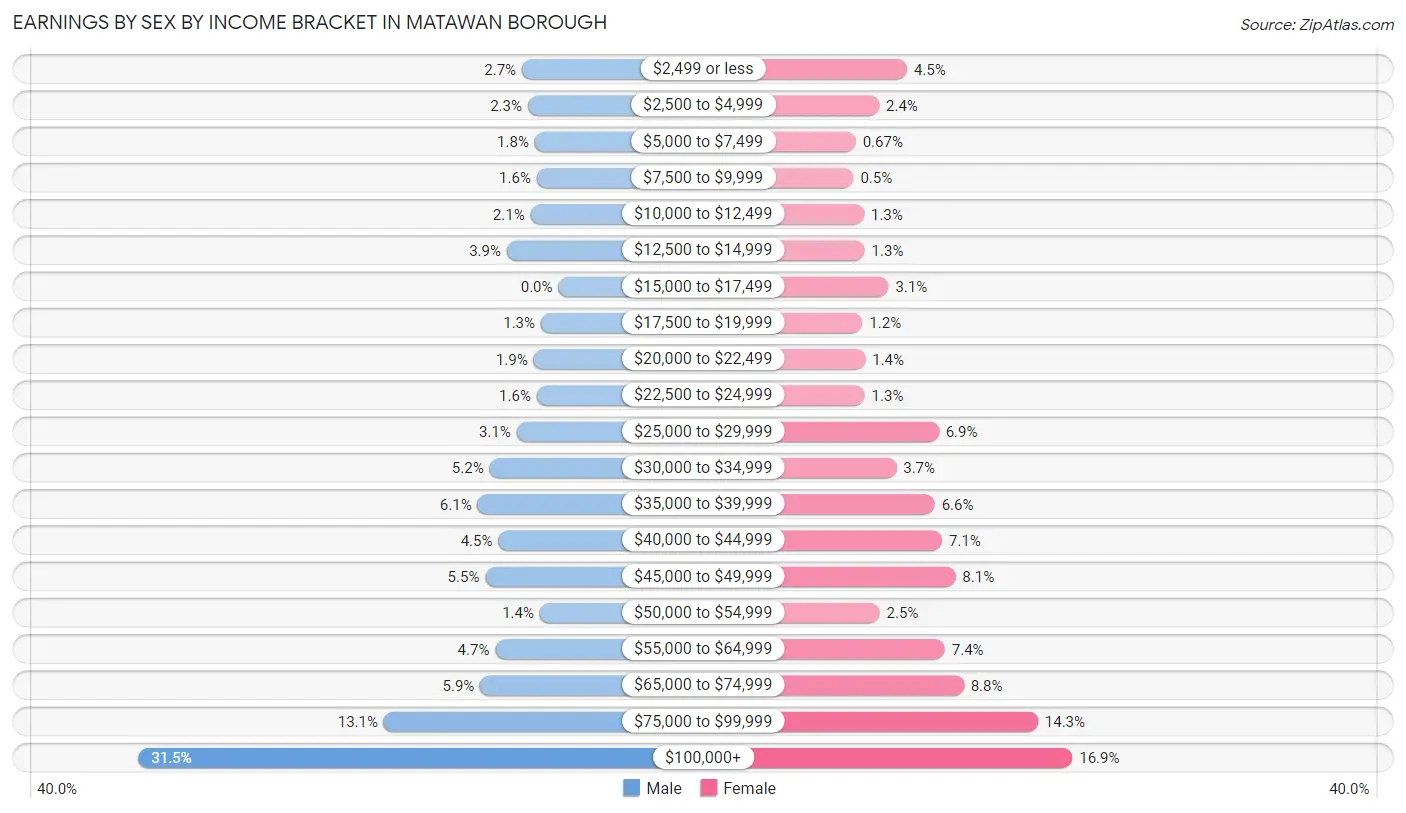
Earnings by Sex by Income Bracket in Matawan borough
The most common earnings brackets in Matawan borough are $100,000+ for men (1,085 | 31.5%) and $100,000+ for women (405 | 16.9%).
| Income | Male | Female |
| $2,499 or less | 94 (2.7%) | 108 (4.5%) |
| $2,500 to $4,999 | 79 (2.3%) | 58 (2.4%) |
| $5,000 to $7,499 | 61 (1.8%) | 16 (0.7%) |
| $7,500 to $9,999 | 56 (1.6%) | 12 (0.5%) |
| $10,000 to $12,499 | 72 (2.1%) | 31 (1.3%) |
| $12,500 to $14,999 | 133 (3.9%) | 32 (1.3%) |
| $15,000 to $17,499 | 0 (0.0%) | 75 (3.1%) |
| $17,500 to $19,999 | 45 (1.3%) | 28 (1.2%) |
| $20,000 to $22,499 | 64 (1.9%) | 33 (1.4%) |
| $22,500 to $24,999 | 56 (1.6%) | 32 (1.3%) |
| $25,000 to $29,999 | 108 (3.1%) | 165 (6.9%) |
| $30,000 to $34,999 | 178 (5.2%) | 89 (3.7%) |
| $35,000 to $39,999 | 209 (6.1%) | 158 (6.6%) |
| $40,000 to $44,999 | 155 (4.5%) | 171 (7.1%) |
| $45,000 to $49,999 | 189 (5.5%) | 195 (8.1%) |
| $50,000 to $54,999 | 48 (1.4%) | 59 (2.5%) |
| $55,000 to $64,999 | 163 (4.7%) | 176 (7.3%) |
| $65,000 to $74,999 | 202 (5.9%) | 210 (8.8%) |
| $75,000 to $99,999 | 451 (13.1%) | 343 (14.3%) |
| $100,000+ | 1,085 (31.5%) | 405 (16.9%) |
| Total | 3,448 (100.0%) | 2,396 (100.0%) |
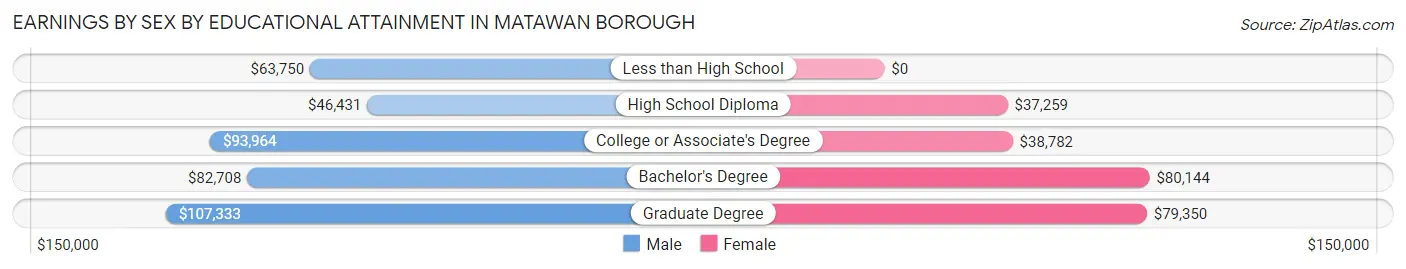
Earnings by Sex by Educational Attainment in Matawan borough
Average earnings in Matawan borough are $72,313 for men and $58,024 for women, a difference of 19.8%. Men with an educational attainment of graduate degree enjoy the highest average annual earnings of $107,333, while those with high school diploma education earn the least with $46,431. Women with an educational attainment of bachelor's degree earn the most with the average annual earnings of $80,144, while those with high school diploma education have the smallest earnings of $37,259.
| Educational Attainment | Male Income | Female Income |
| Less than High School | $63,750 | $0 |
| High School Diploma | $46,431 | $37,259 |
| College or Associate's Degree | $93,964 | $38,782 |
| Bachelor's Degree | $82,708 | $80,144 |
| Graduate Degree | $107,333 | $79,350 |
| Total | $72,313 | $58,024 |
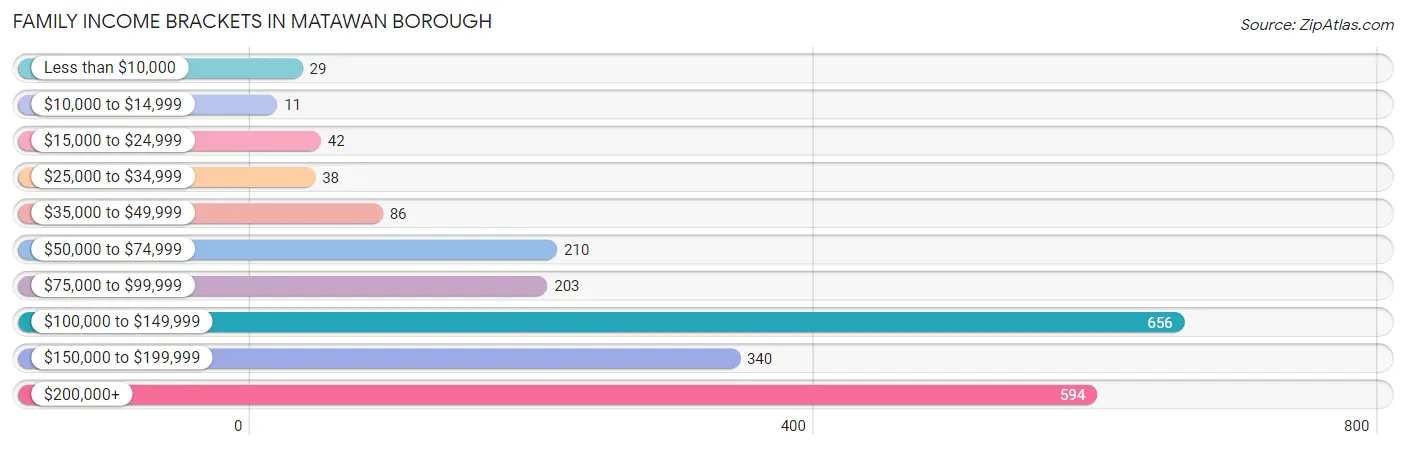
Family Income in Matawan borough
Family Income Brackets in Matawan borough
According to the Matawan borough family income data, there are 656 families falling into the $100,000 to $149,999 income range, which is the most common income bracket and makes up 29.7% of all families. Conversely, the $10,000 to $14,999 income bracket is the least frequent group with only 11 families (0.5%) belonging to this category.
| Income Bracket | # Families | % Families |
| Less than $10,000 | 29 | 1.3% |
| $10,000 to $14,999 | 11 | 0.5% |
| $15,000 to $24,999 | 42 | 1.9% |
| $25,000 to $34,999 | 38 | 1.7% |
| $35,000 to $49,999 | 86 | 3.9% |
| $50,000 to $74,999 | 210 | 9.5% |
| $75,000 to $99,999 | 203 | 9.2% |
| $100,000 to $149,999 | 656 | 29.7% |
| $150,000 to $199,999 | 340 | 15.4% |
| $200,000+ | 594 | 26.9% |
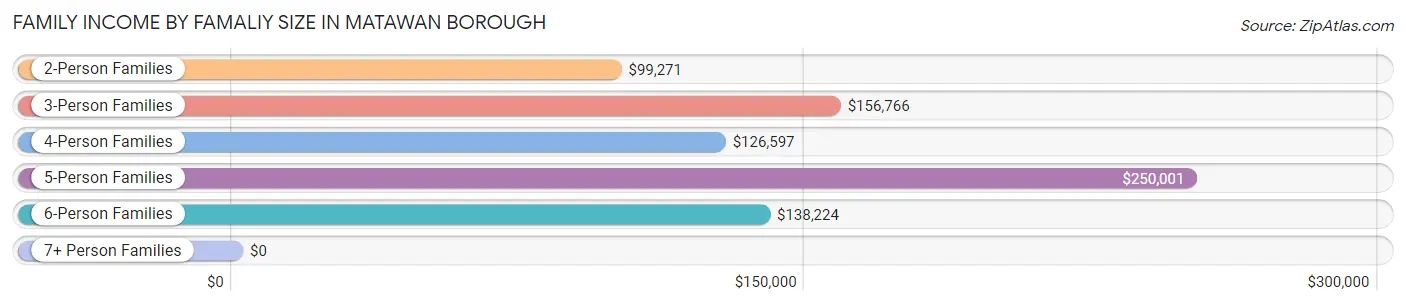
Family Income by Famaliy Size in Matawan borough
5-person families (132 | 6.0%) account for the highest median family income in Matawan borough with $250,001 per family, while 3-person families (619 | 28.0%) have the highest median income of $52,255 per family member.
| Income Bracket | # Families | Median Income |
| 2-Person Families | 801 (36.3%) | $99,271 |
| 3-Person Families | 619 (28.0%) | $156,766 |
| 4-Person Families | 559 (25.3%) | $126,597 |
| 5-Person Families | 132 (6.0%) | $250,001 |
| 6-Person Families | 61 (2.8%) | $138,224 |
| 7+ Person Families | 36 (1.6%) | $0 |
| Total | 2,208 (100.0%) | $137,179 |
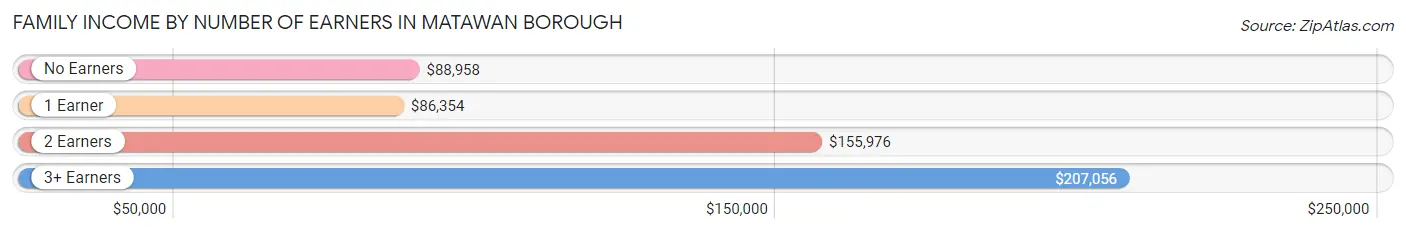
Family Income by Number of Earners in Matawan borough
The median family income in Matawan borough is $137,179, with families comprising 3+ earners (379) having the highest median family income of $207,056, while families with 1 earner (590) have the lowest median family income of $86,354, accounting for 17.2% and 26.7% of families, respectively.
| Number of Earners | # Families | Median Income |
| No Earners | 163 (7.4%) | $88,958 |
| 1 Earner | 590 (26.7%) | $86,354 |
| 2 Earners | 1,076 (48.7%) | $155,976 |
| 3+ Earners | 379 (17.2%) | $207,056 |
| Total | 2,208 (100.0%) | $137,179 |
Household Income in Matawan borough
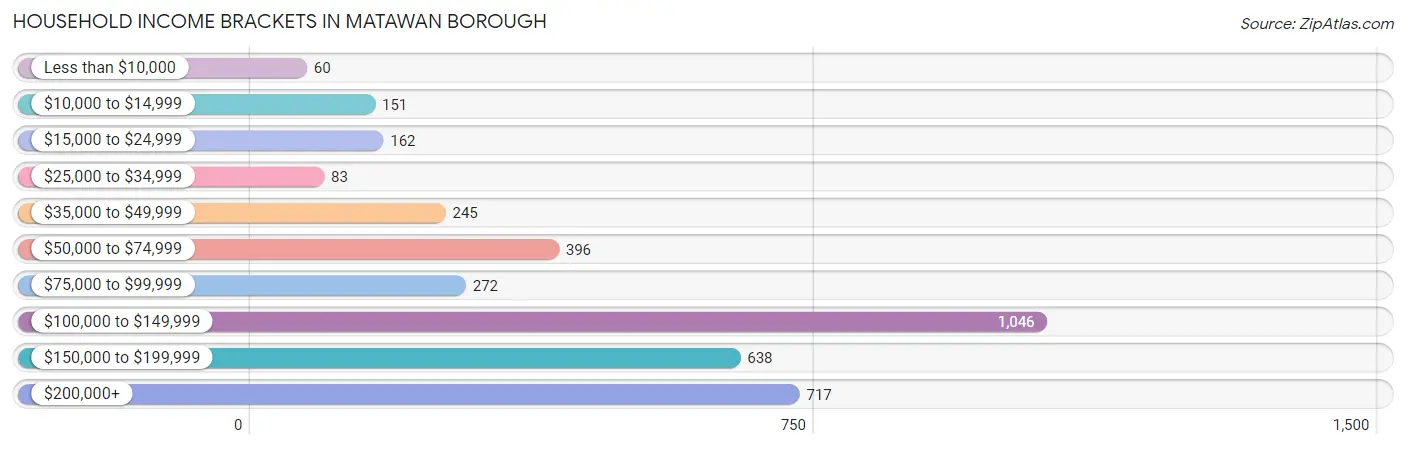
Household Income Brackets in Matawan borough
With 1,046 households falling in the category, the $100,000 to $149,999 income range is the most frequent in Matawan borough, accounting for 27.7% of all households. In contrast, only 60 households (1.6%) fall into the less than $10,000 income bracket, making it the least populous group.
| Income Bracket | # Households | % Households |
| Less than $10,000 | 60 | 1.6% |
| $10,000 to $14,999 | 151 | 4.0% |
| $15,000 to $24,999 | 162 | 4.3% |
| $25,000 to $34,999 | 83 | 2.2% |
| $35,000 to $49,999 | 245 | 6.5% |
| $50,000 to $74,999 | 396 | 10.5% |
| $75,000 to $99,999 | 272 | 7.2% |
| $100,000 to $149,999 | 1,046 | 27.7% |
| $150,000 to $199,999 | 638 | 16.9% |
| $200,000+ | 717 | 19.0% |
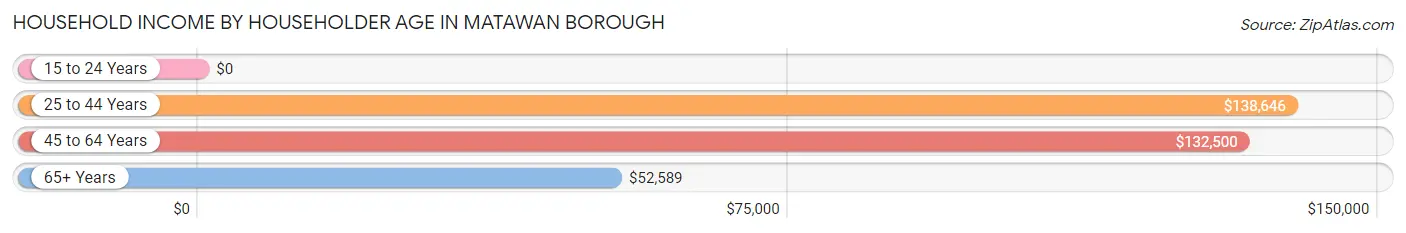
Household Income by Householder Age in Matawan borough
The median household income in Matawan borough is $125,040, with the highest median household income of $138,646 found in the 25 to 44 years age bracket for the primary householder. A total of 1,291 households (34.2%) fall into this category. Meanwhile, the 15 to 24 years age bracket for the primary householder has the lowest median household income of $0, with 46 households (1.2%) in this group.
| Income Bracket | # Households | Median Income |
| 15 to 24 Years | 46 (1.2%) | $0 |
| 25 to 44 Years | 1,291 (34.2%) | $138,646 |
| 45 to 64 Years | 1,692 (44.8%) | $132,500 |
| 65+ Years | 746 (19.8%) | $52,589 |
| Total | 3,775 (100.0%) | $125,040 |
Poverty in Matawan borough
Income Below Poverty by Sex and Age in Matawan borough
With 6.2% poverty level for males and 8.0% for females among the residents of Matawan borough, under 5 year old males and 65 to 74 year old females are the most vulnerable to poverty, with 60 males (14.6%) and 60 females (18.1%) in their respective age groups living below the poverty level.
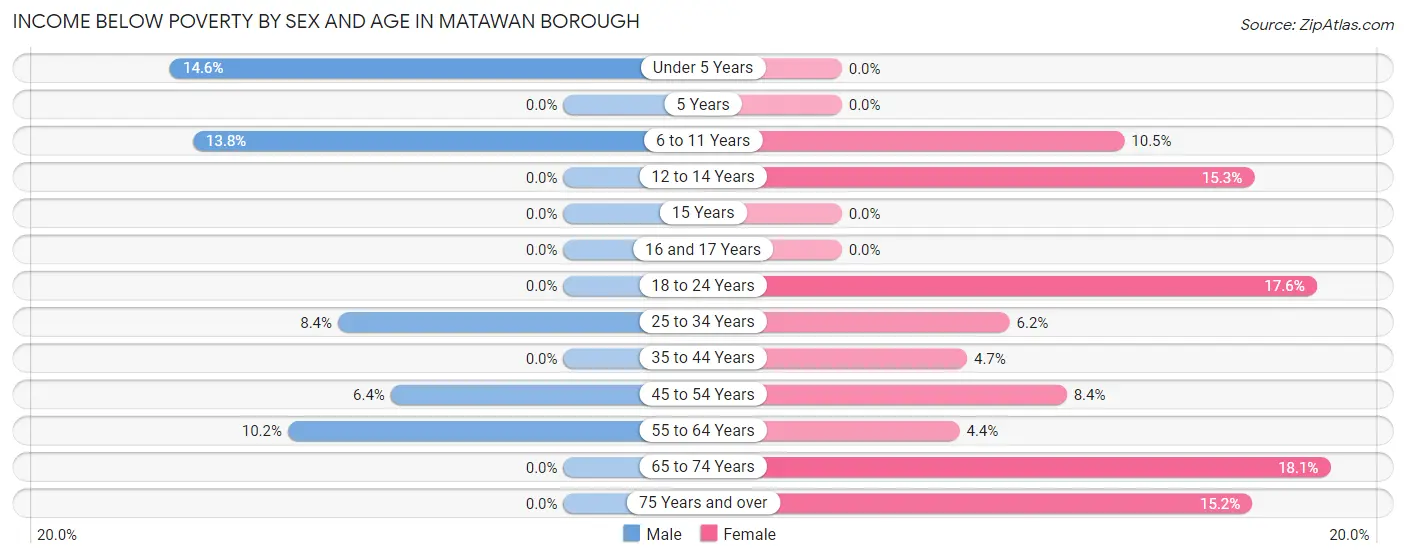
| Age Bracket | Male | Female |
| Under 5 Years | 60 (14.6%) | 0 (0.0%) |
| 5 Years | 0 (0.0%) | 0 (0.0%) |
| 6 to 11 Years | 59 (13.8%) | 34 (10.5%) |
| 12 to 14 Years | 0 (0.0%) | 28 (15.3%) |
| 15 Years | 0 (0.0%) | 0 (0.0%) |
| 16 and 17 Years | 0 (0.0%) | 0 (0.0%) |
| 18 to 24 Years | 0 (0.0%) | 37 (17.6%) |
| 25 to 34 Years | 85 (8.4%) | 41 (6.2%) |
| 35 to 44 Years | 0 (0.0%) | 29 (4.6%) |
| 45 to 54 Years | 43 (6.4%) | 54 (8.4%) |
| 55 to 64 Years | 67 (10.2%) | 31 (4.4%) |
| 65 to 74 Years | 0 (0.0%) | 60 (18.1%) |
| 75 Years and over | 0 (0.0%) | 37 (15.2%) |
| Total | 314 (6.2%) | 351 (8.0%) |
Income Above Poverty by Sex and Age in Matawan borough
According to the poverty statistics in Matawan borough, males aged 12 to 14 years and females aged under 5 years are the age groups that are most secure financially, with 100.0% of males and 100.0% of females in these age groups living above the poverty line.
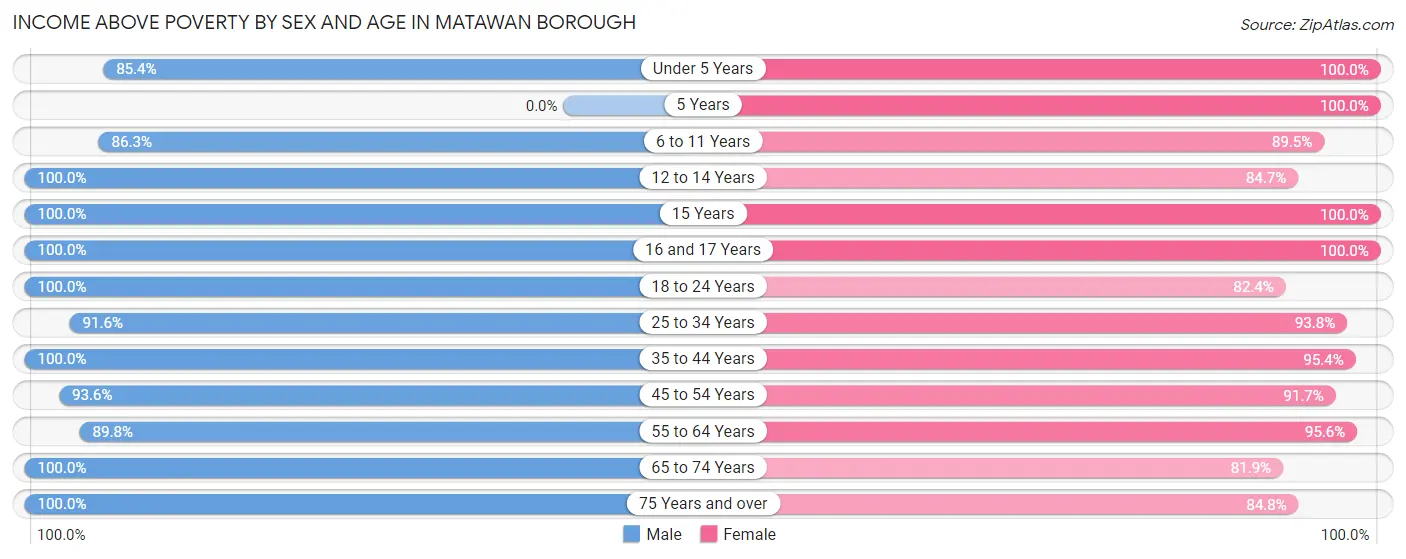
| Age Bracket | Male | Female |
| Under 5 Years | 351 (85.4%) | 248 (100.0%) |
| 5 Years | 0 (0.0%) | 114 (100.0%) |
| 6 to 11 Years | 370 (86.3%) | 290 (89.5%) |
| 12 to 14 Years | 81 (100.0%) | 155 (84.7%) |
| 15 Years | 82 (100.0%) | 41 (100.0%) |
| 16 and 17 Years | 116 (100.0%) | 80 (100.0%) |
| 18 to 24 Years | 208 (100.0%) | 173 (82.4%) |
| 25 to 34 Years | 930 (91.6%) | 617 (93.8%) |
| 35 to 44 Years | 788 (100.0%) | 594 (95.4%) |
| 45 to 54 Years | 628 (93.6%) | 593 (91.6%) |
| 55 to 64 Years | 588 (89.8%) | 679 (95.6%) |
| 65 to 74 Years | 403 (100.0%) | 271 (81.9%) |
| 75 Years and over | 176 (100.0%) | 206 (84.8%) |
| Total | 4,721 (93.8%) | 4,061 (92.0%) |
Income Below Poverty Among Married-Couple Families in Matawan borough
The poverty statistics for married-couple families in Matawan borough show that 2.1% or 37 of the total 1,790 families live below the poverty line. Families with 1 or 2 children have the highest poverty rate of 4.5%, comprising of 37 families. On the other hand, families with no children have the lowest poverty rate of 0.0%, which includes 0 families.
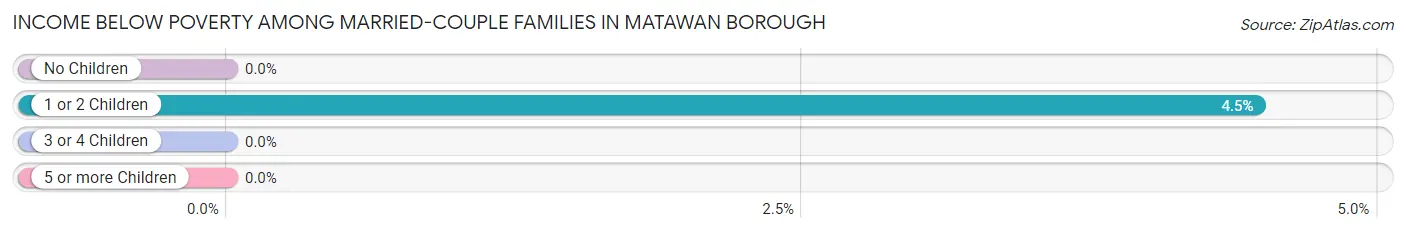
| Children | Above Poverty | Below Poverty |
| No Children | 823 (100.0%) | 0 (0.0%) |
| 1 or 2 Children | 791 (95.5%) | 37 (4.5%) |
| 3 or 4 Children | 139 (100.0%) | 0 (0.0%) |
| 5 or more Children | 0 (0.0%) | 0 (0.0%) |
| Total | 1,753 (97.9%) | 37 (2.1%) |
Income Below Poverty Among Single-Parent Households in Matawan borough
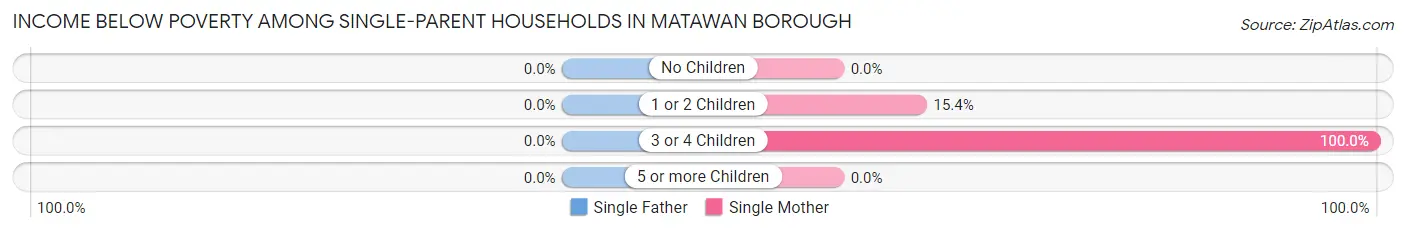
| Children | Single Father | Single Mother |
| No Children | 0 (0.0%) | 0 (0.0%) |
| 1 or 2 Children | 0 (0.0%) | 29 (15.4%) |
| 3 or 4 Children | 0 (0.0%) | 17 (100.0%) |
| 5 or more Children | 0 (0.0%) | 0 (0.0%) |
| Total | 0 (0.0%) | 46 (16.0%) |
Income Below Poverty Among Married-Couple vs Single-Parent Households in Matawan borough
The poverty data for Matawan borough shows that 37 of the married-couple family households (2.1%) and 46 of the single-parent households (11.0%) are living below the poverty level. Within the married-couple family households, those with 1 or 2 children have the highest poverty rate, with 37 households (4.5%) falling below the poverty line. Among the single-parent households, those with 3 or 4 children have the highest poverty rate, with 17 household (100.0%) living below poverty.
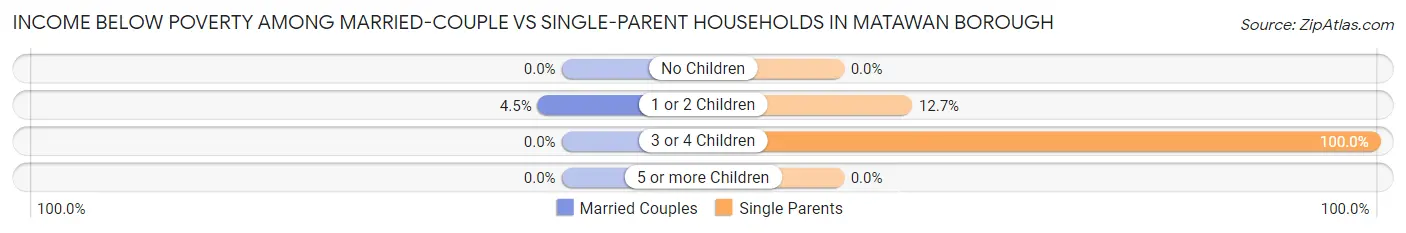
| Children | Married-Couple Families | Single-Parent Households |
| No Children | 0 (0.0%) | 0 (0.0%) |
| 1 or 2 Children | 37 (4.5%) | 29 (12.7%) |
| 3 or 4 Children | 0 (0.0%) | 17 (100.0%) |
| 5 or more Children | 0 (0.0%) | 0 (0.0%) |
| Total | 37 (2.1%) | 46 (11.0%) |
Race in Matawan borough
The most populous races in Matawan borough are White / Caucasian (7,075 | 74.1%), Hispanic or Latino (1,240 | 13.0%), and Black / African American (1,139 | 11.9%).
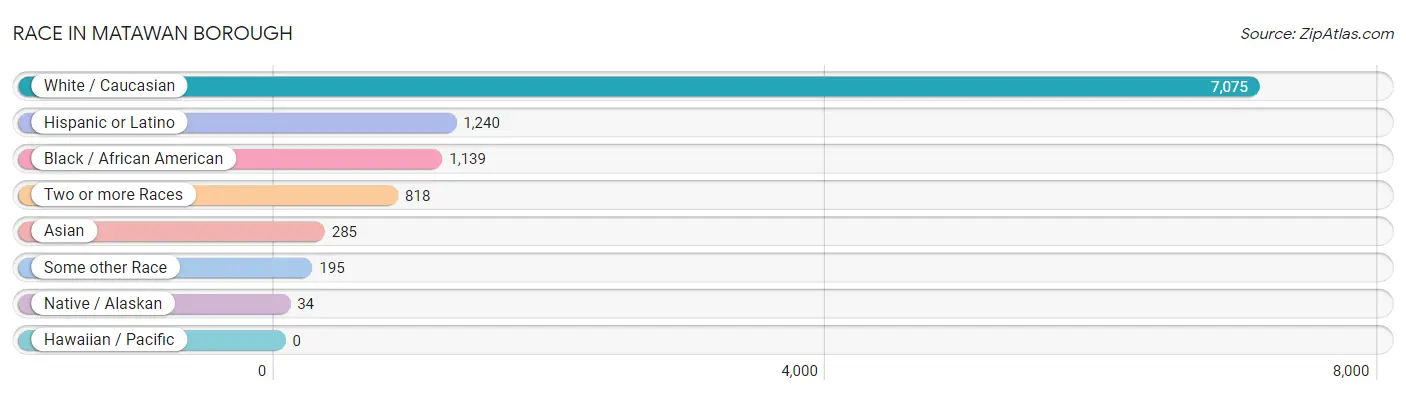
| Race | # Population | % Population |
| Asian | 285 | 3.0% |
| Black / African American | 1,139 | 11.9% |
| Hawaiian / Pacific | 0 | 0.0% |
| Hispanic or Latino | 1,240 | 13.0% |
| Native / Alaskan | 34 | 0.4% |
| White / Caucasian | 7,075 | 74.1% |
| Two or more Races | 818 | 8.6% |
| Some other Race | 195 | 2.0% |
| Total | 9,546 | 100.0% |
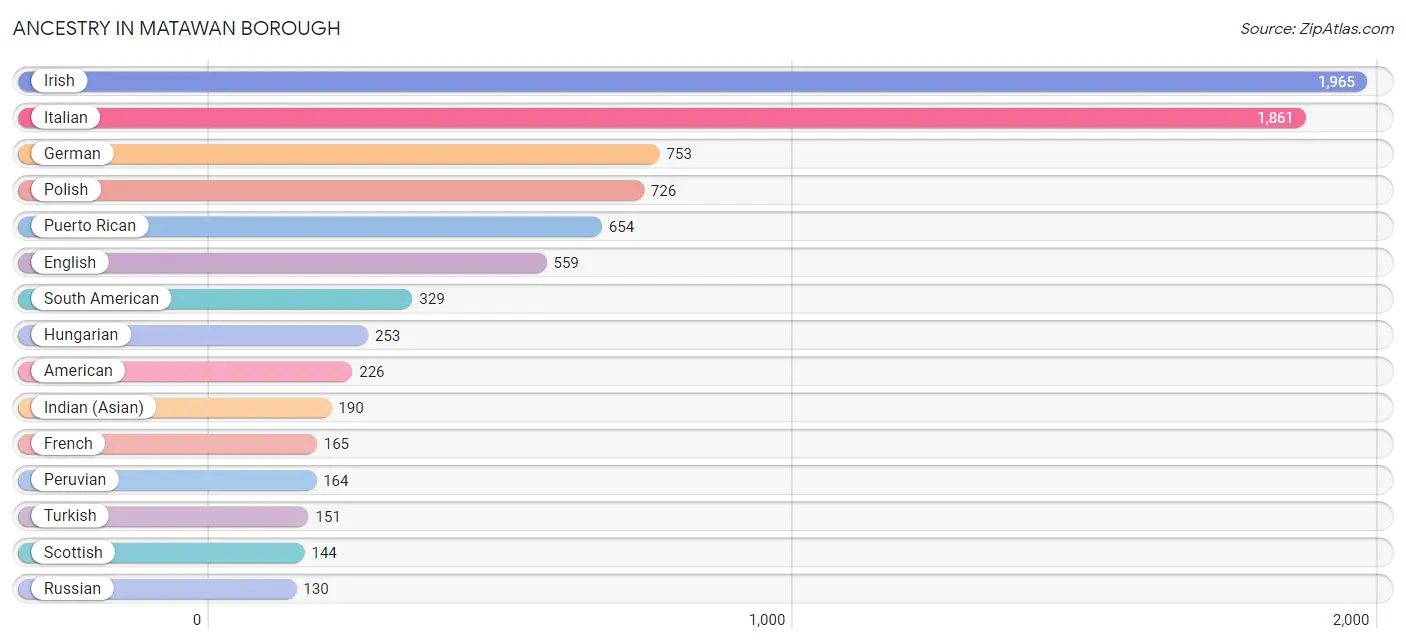
Ancestry in Matawan borough
The most populous ancestries reported in Matawan borough are Irish (1,965 | 20.6%), Italian (1,861 | 19.5%), German (753 | 7.9%), Polish (726 | 7.6%), and Puerto Rican (654 | 6.9%), together accounting for 62.4% of all Matawan borough residents.
| Ancestry | # Population | % Population |
| Albanian | 85 | 0.9% |
| American | 226 | 2.4% |
| Arab | 61 | 0.6% |
| Armenian | 15 | 0.2% |
| Austrian | 53 | 0.6% |
| Belgian | 16 | 0.2% |
| Belizean | 17 | 0.2% |
| Bhutanese | 68 | 0.7% |
| Bolivian | 96 | 1.0% |
| British | 25 | 0.3% |
| Burmese | 10 | 0.1% |
| Central American | 40 | 0.4% |
| Central American Indian | 74 | 0.8% |
| Colombian | 46 | 0.5% |
| Costa Rican | 19 | 0.2% |
| Croatian | 47 | 0.5% |
| Cuban | 56 | 0.6% |
| Czech | 32 | 0.3% |
| Czechoslovakian | 7 | 0.1% |
| Danish | 27 | 0.3% |
| Dutch | 123 | 1.3% |
| Eastern European | 17 | 0.2% |
| Ecuadorian | 23 | 0.2% |
| Egyptian | 29 | 0.3% |
| English | 559 | 5.9% |
| European | 96 | 1.0% |
| Finnish | 12 | 0.1% |
| French | 165 | 1.7% |
| French Canadian | 11 | 0.1% |
| German | 753 | 7.9% |
| Greek | 11 | 0.1% |
| Guyanese | 20 | 0.2% |
| Honduran | 10 | 0.1% |
| Hungarian | 253 | 2.6% |
| Indian (Asian) | 190 | 2.0% |
| Irish | 1,965 | 20.6% |
| Italian | 1,861 | 19.5% |
| Korean | 55 | 0.6% |
| Lithuanian | 13 | 0.1% |
| Macedonian | 10 | 0.1% |
| Maltese | 9 | 0.1% |
| Mexican | 84 | 0.9% |
| Northern European | 15 | 0.2% |
| Norwegian | 60 | 0.6% |
| Palestinian | 32 | 0.3% |
| Peruvian | 164 | 1.7% |
| Polish | 726 | 7.6% |
| Portuguese | 38 | 0.4% |
| Puerto Rican | 654 | 6.9% |
| Romanian | 21 | 0.2% |
| Russian | 130 | 1.4% |
| Salvadoran | 11 | 0.1% |
| Scandinavian | 18 | 0.2% |
| Scotch-Irish | 16 | 0.2% |
| Scottish | 144 | 1.5% |
| Slovak | 53 | 0.6% |
| South American | 329 | 3.5% |
| Spaniard | 41 | 0.4% |
| Spanish | 25 | 0.3% |
| Sri Lankan | 35 | 0.4% |
| Swedish | 39 | 0.4% |
| Thai | 19 | 0.2% |
| Turkish | 151 | 1.6% |
| Ukrainian | 89 | 0.9% |
| Welsh | 61 | 0.6% |
| West Indian | 57 | 0.6% |
| Yugoslavian | 56 | 0.6% | View All 67 Rows |
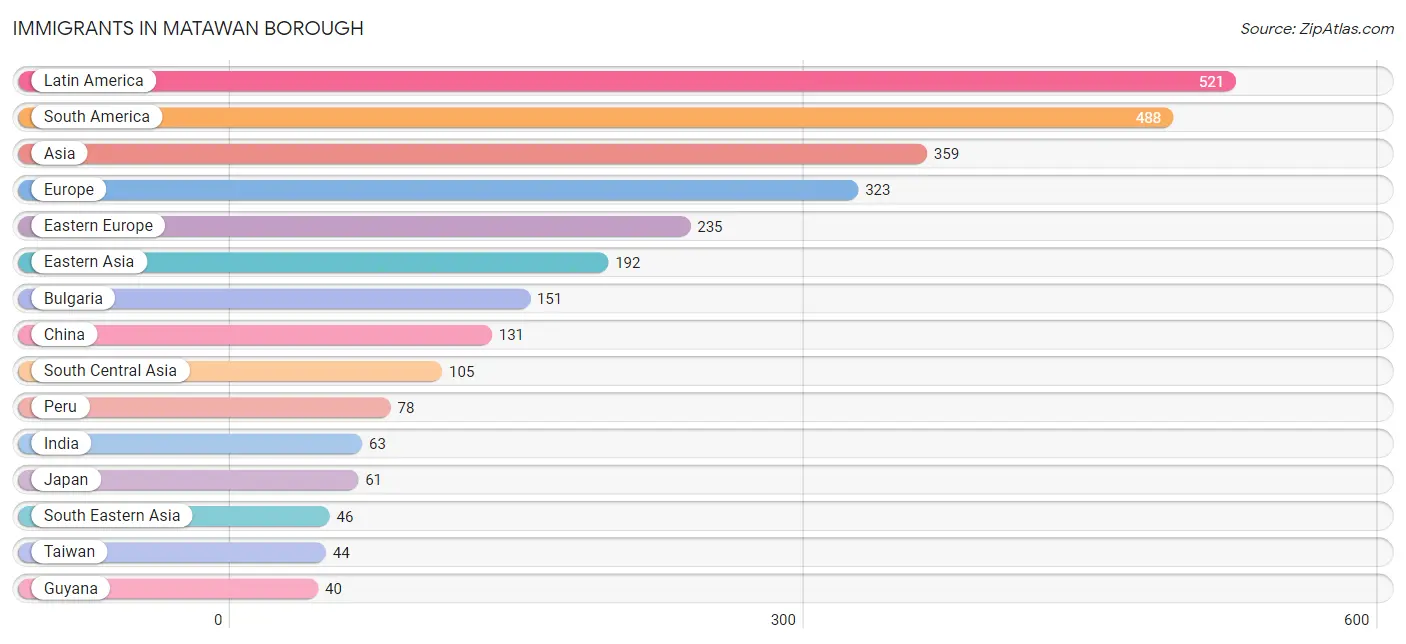
Immigrants in Matawan borough
The most numerous immigrant groups reported in Matawan borough came from Latin America (521 | 5.5%), South America (488 | 5.1%), Asia (359 | 3.8%), Europe (323 | 3.4%), and Eastern Europe (235 | 2.5%), together accounting for 20.2% of all Matawan borough residents.
| Immigration Origin | # Population | % Population |
| Africa | 29 | 0.3% |
| Albania | 11 | 0.1% |
| Armenia | 15 | 0.2% |
| Asia | 359 | 3.8% |
| Bangladesh | 32 | 0.3% |
| Bosnia and Herzegovina | 12 | 0.1% |
| Brazil | 11 | 0.1% |
| Bulgaria | 151 | 1.6% |
| Caribbean | 22 | 0.2% |
| Central America | 11 | 0.1% |
| China | 131 | 1.4% |
| Colombia | 34 | 0.4% |
| Eastern Asia | 192 | 2.0% |
| Eastern Europe | 235 | 2.5% |
| Egypt | 29 | 0.3% |
| El Salvador | 11 | 0.1% |
| Europe | 323 | 3.4% |
| France | 22 | 0.2% |
| Germany | 8 | 0.1% |
| Guyana | 40 | 0.4% |
| India | 63 | 0.7% |
| Ireland | 32 | 0.3% |
| Italy | 25 | 0.3% |
| Japan | 61 | 0.6% |
| Latin America | 521 | 5.5% |
| Northern Africa | 29 | 0.3% |
| Northern Europe | 32 | 0.3% |
| Pakistan | 10 | 0.1% |
| Peru | 78 | 0.8% |
| Philippines | 14 | 0.2% |
| Poland | 13 | 0.1% |
| Portugal | 1 | 0.0% |
| Saudi Arabia | 1 | 0.0% |
| Singapore | 12 | 0.1% |
| South America | 488 | 5.1% |
| South Central Asia | 105 | 1.1% |
| South Eastern Asia | 46 | 0.5% |
| Southern Europe | 26 | 0.3% |
| Taiwan | 44 | 0.5% |
| Trinidad and Tobago | 22 | 0.2% |
| Vietnam | 20 | 0.2% |
| Western Asia | 16 | 0.2% |
| Western Europe | 30 | 0.3% | View All 43 Rows |
Sex and Age in Matawan borough
Sex and Age in Matawan borough
The most populous age groups in Matawan borough are 25 to 29 Years (575 | 11.3%) for men and 55 to 59 Years (435 | 9.7%) for women.
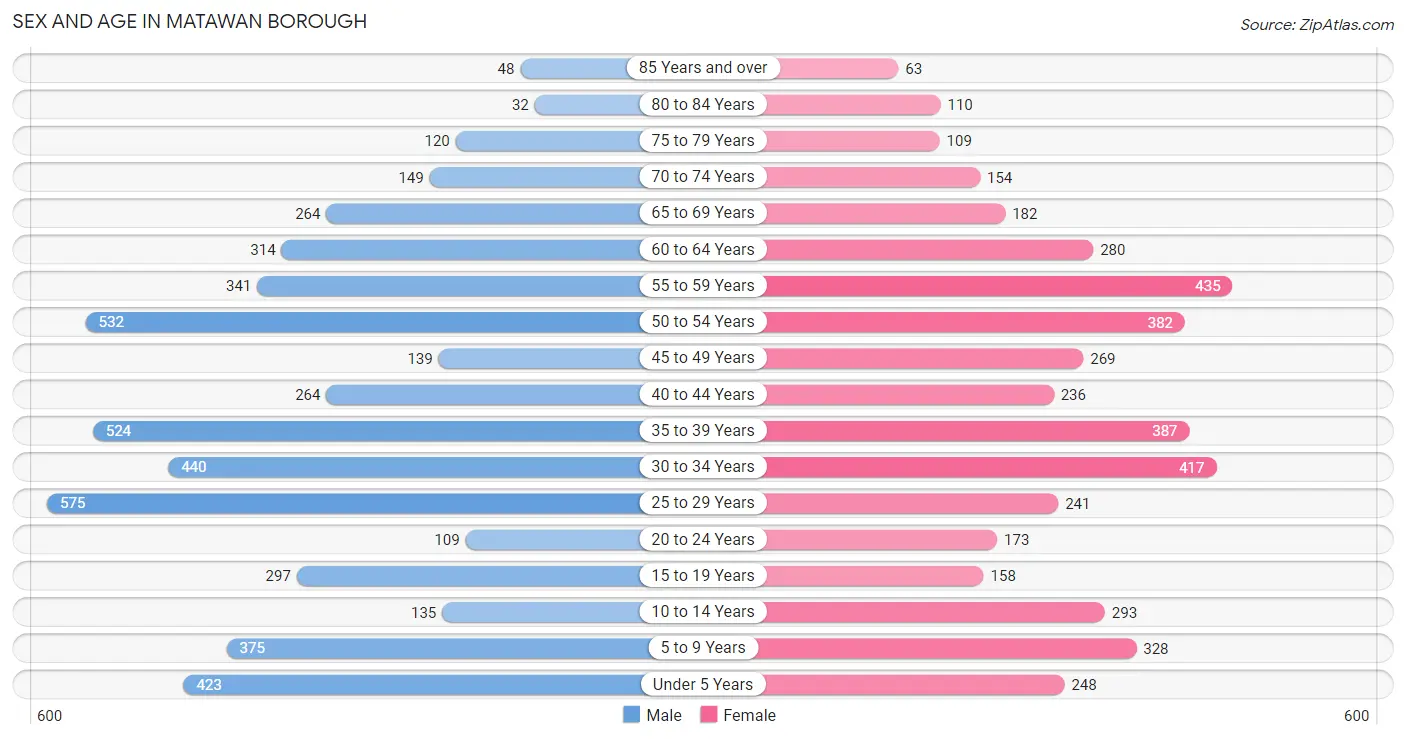
| Age Bracket | Male | Female |
| Under 5 Years | 423 (8.3%) | 248 (5.6%) |
| 5 to 9 Years | 375 (7.4%) | 328 (7.3%) |
| 10 to 14 Years | 135 (2.7%) | 293 (6.6%) |
| 15 to 19 Years | 297 (5.9%) | 158 (3.5%) |
| 20 to 24 Years | 109 (2.1%) | 173 (3.9%) |
| 25 to 29 Years | 575 (11.3%) | 241 (5.4%) |
| 30 to 34 Years | 440 (8.7%) | 417 (9.3%) |
| 35 to 39 Years | 524 (10.3%) | 387 (8.7%) |
| 40 to 44 Years | 264 (5.2%) | 236 (5.3%) |
| 45 to 49 Years | 139 (2.7%) | 269 (6.0%) |
| 50 to 54 Years | 532 (10.5%) | 382 (8.6%) |
| 55 to 59 Years | 341 (6.7%) | 435 (9.7%) |
| 60 to 64 Years | 314 (6.2%) | 280 (6.3%) |
| 65 to 69 Years | 264 (5.2%) | 182 (4.1%) |
| 70 to 74 Years | 149 (2.9%) | 154 (3.5%) |
| 75 to 79 Years | 120 (2.4%) | 109 (2.4%) |
| 80 to 84 Years | 32 (0.6%) | 110 (2.5%) |
| 85 Years and over | 48 (0.9%) | 63 (1.4%) |
| Total | 5,081 (100.0%) | 4,465 (100.0%) |
Families and Households in Matawan borough
Median Family Size in Matawan borough
The median family size in Matawan borough is 3.24 persons per family, with married-couple families (1,790 | 81.1%) accounting for the largest median family size of 3.38 persons per family. On the other hand, single female/mother families (288 | 13.0%) represent the smallest median family size with 2.57 persons per family.
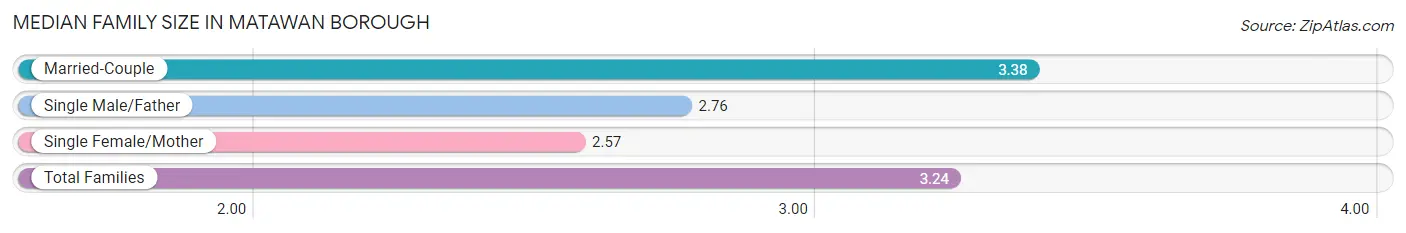
| Family Type | # Families | Family Size |
| Married-Couple | 1,790 (81.1%) | 3.38 |
| Single Male/Father | 130 (5.9%) | 2.76 |
| Single Female/Mother | 288 (13.0%) | 2.57 |
| Total Families | 2,208 (100.0%) | 3.24 |
Median Household Size in Matawan borough
The median household size in Matawan borough is 2.50 persons per household, with married-couple households (1,790 | 47.4%) accounting for the largest median household size of 3.39 persons per household. non-family households (1,567 | 41.5%) represent the smallest median household size with 1.41 persons per household.
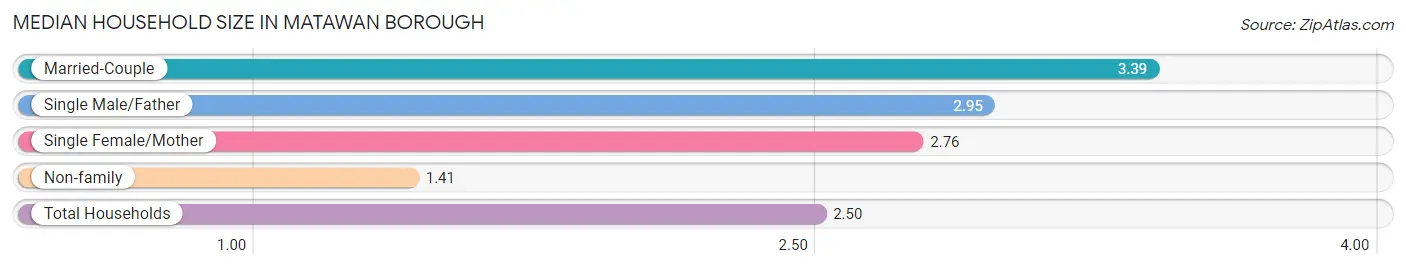
| Household Type | # Households | Household Size |
| Married-Couple | 1,790 (47.4%) | 3.39 |
| Single Male/Father | 130 (3.4%) | 2.95 |
| Single Female/Mother | 288 (7.6%) | 2.76 |
| Non-family | 1,567 (41.5%) | 1.41 |
| Total Households | 3,775 (100.0%) | 2.50 |
Household Size by Marriage Status in Matawan borough
Out of a total of 3,775 households in Matawan borough, 2,208 (58.5%) are family households, while 1,567 (41.5%) are nonfamily households. The most numerous type of family households are 2-person households, comprising 801, and the most common type of nonfamily households are 1-person households, comprising 1,178.
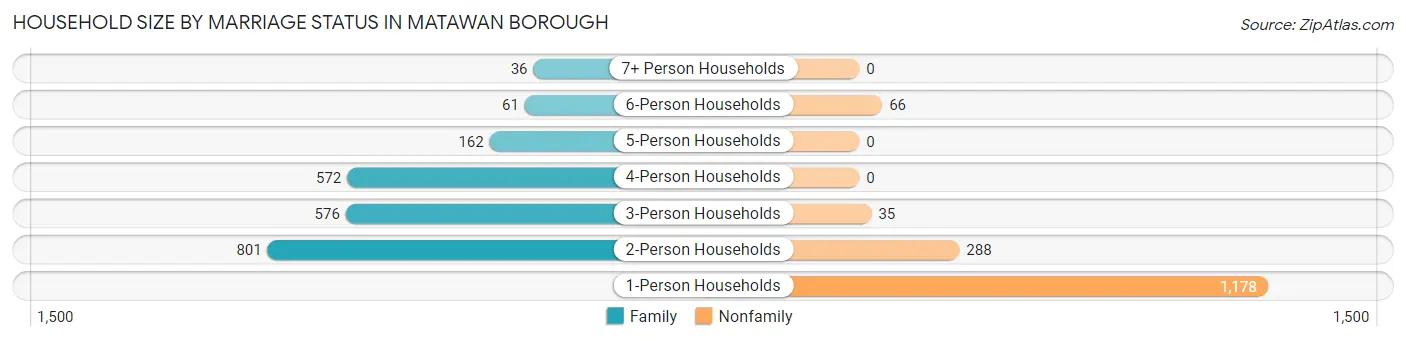
| Household Size | Family Households | Nonfamily Households |
| 1-Person Households | - | 1,178 (31.2%) |
| 2-Person Households | 801 (21.2%) | 288 (7.6%) |
| 3-Person Households | 576 (15.3%) | 35 (0.9%) |
| 4-Person Households | 572 (15.1%) | 0 (0.0%) |
| 5-Person Households | 162 (4.3%) | 0 (0.0%) |
| 6-Person Households | 61 (1.6%) | 66 (1.8%) |
| 7+ Person Households | 36 (0.9%) | 0 (0.0%) |
| Total | 2,208 (58.5%) | 1,567 (41.5%) |
Female Fertility in Matawan borough
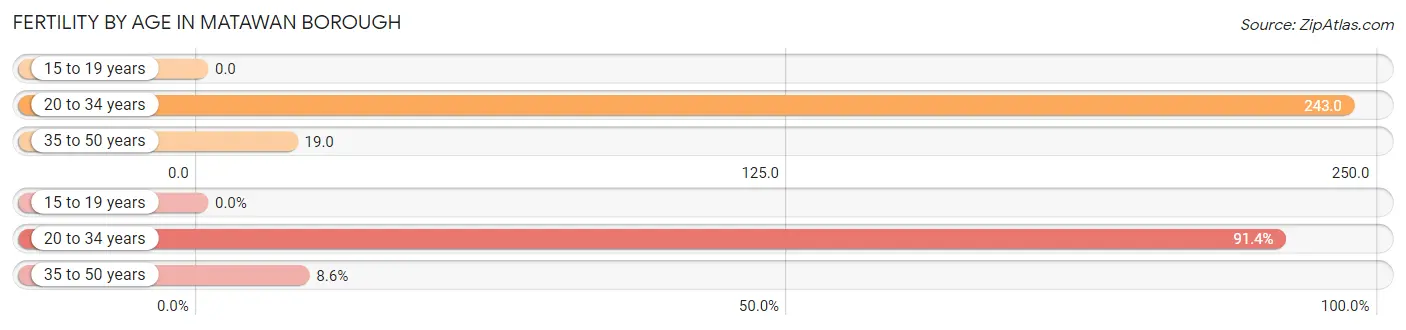
Fertility by Age in Matawan borough
Average fertility rate in Matawan borough is 111.0 births per 1,000 women. Women in the age bracket of 20 to 34 years have the highest fertility rate with 243.0 births per 1,000 women. Women in the age bracket of 20 to 34 years acount for 91.4% of all women with births.
| Age Bracket | Women with Births | Births / 1,000 Women |
| 15 to 19 years | 0 (0.0%) | 0.0 |
| 20 to 34 years | 202 (91.4%) | 243.0 |
| 35 to 50 years | 19 (8.6%) | 19.0 |
| Total | 221 (100.0%) | 111.0 |
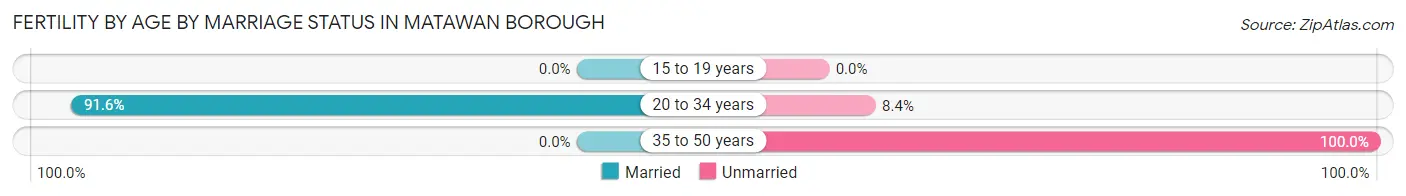
Fertility by Age by Marriage Status in Matawan borough
83.7% of women with births (221) in Matawan borough are married. The highest percentage of unmarried women with births falls into 35 to 50 years age bracket with 100.0% of them unmarried at the time of birth, while the lowest percentage of unmarried women with births belong to 20 to 34 years age bracket with 8.4% of them unmarried.
| Age Bracket | Married | Unmarried |
| 15 to 19 years | 0 (0.0%) | 0 (0.0%) |
| 20 to 34 years | 185 (91.6%) | 17 (8.4%) |
| 35 to 50 years | 0 (0.0%) | 19 (100.0%) |
| Total | 185 (83.7%) | 36 (16.3%) |
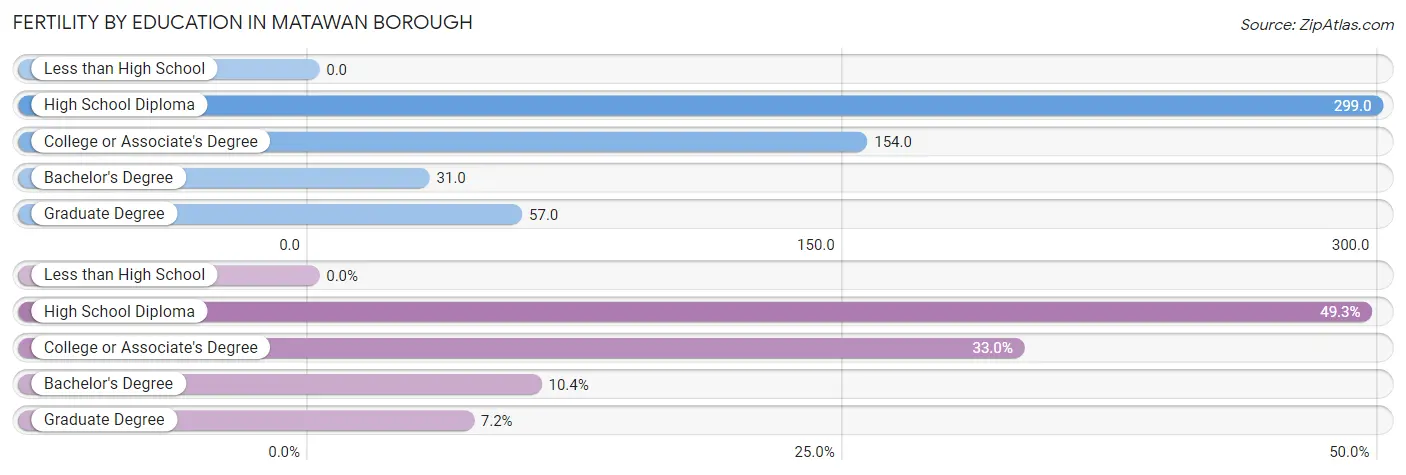
Fertility by Education in Matawan borough
| Educational Attainment | Women with Births | Births / 1,000 Women |
| Less than High School | 0 (0.0%) | 0.0 |
| High School Diploma | 109 (49.3%) | 299.0 |
| College or Associate's Degree | 73 (33.0%) | 154.0 |
| Bachelor's Degree | 23 (10.4%) | 31.0 |
| Graduate Degree | 16 (7.2%) | 57.0 |
| Total | 221 (100.0%) | 111.0 |
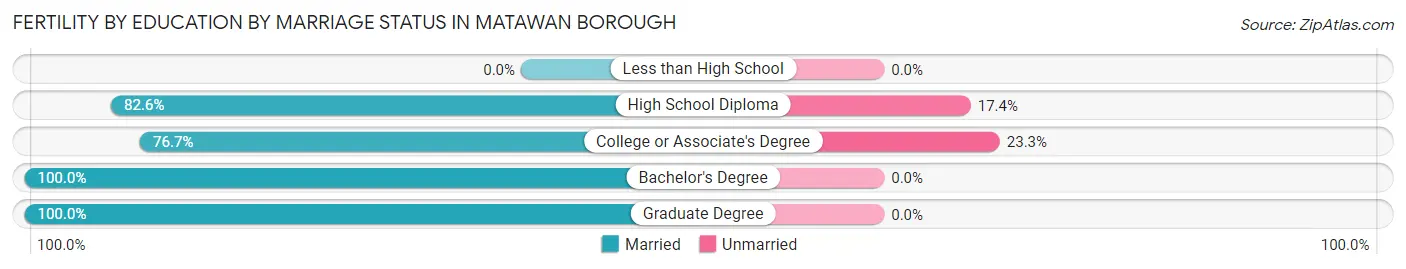
Fertility by Education by Marriage Status in Matawan borough
16.3% of women with births in Matawan borough are unmarried. Women with the educational attainment of bachelor's degree are most likely to be married with 100.0% of them married at childbirth, while women with the educational attainment of college or associate's degree are least likely to be married with 23.3% of them unmarried at childbirth.
| Educational Attainment | Married | Unmarried |
| Less than High School | 0 (0.0%) | 0 (0.0%) |
| High School Diploma | 90 (82.6%) | 19 (17.4%) |
| College or Associate's Degree | 56 (76.7%) | 17 (23.3%) |
| Bachelor's Degree | 23 (100.0%) | 0 (0.0%) |
| Graduate Degree | 16 (100.0%) | 0 (0.0%) |
| Total | 185 (83.7%) | 36 (16.3%) |
Employment Characteristics in Matawan borough
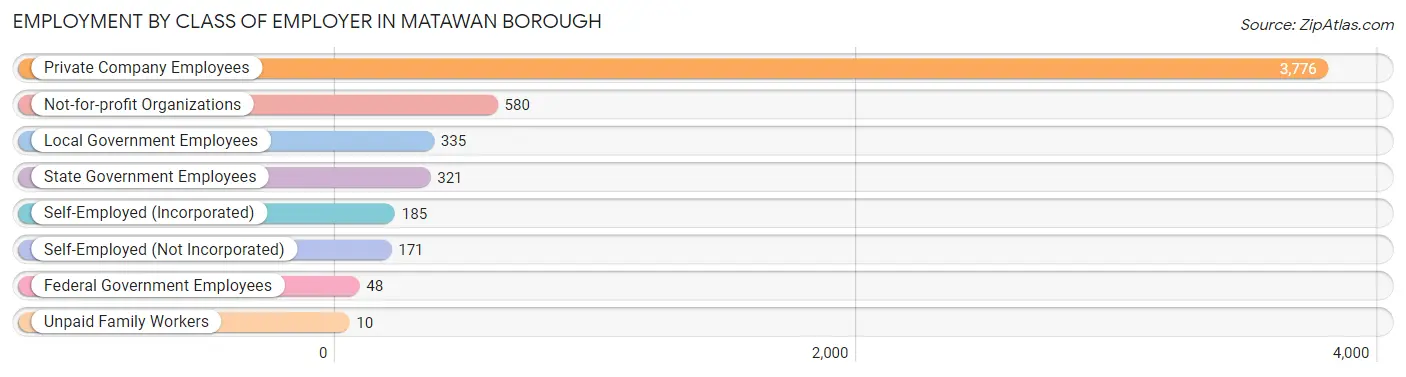
Employment by Class of Employer in Matawan borough
Among the 5,426 employed individuals in Matawan borough, private company employees (3,776 | 69.6%), not-for-profit organizations (580 | 10.7%), and local government employees (335 | 6.2%) make up the most common classes of employment.
| Employer Class | # Employees | % Employees |
| Private Company Employees | 3,776 | 69.6% |
| Self-Employed (Incorporated) | 185 | 3.4% |
| Self-Employed (Not Incorporated) | 171 | 3.2% |
| Not-for-profit Organizations | 580 | 10.7% |
| Local Government Employees | 335 | 6.2% |
| State Government Employees | 321 | 5.9% |
| Federal Government Employees | 48 | 0.9% |
| Unpaid Family Workers | 10 | 0.2% |
| Total | 5,426 | 100.0% |
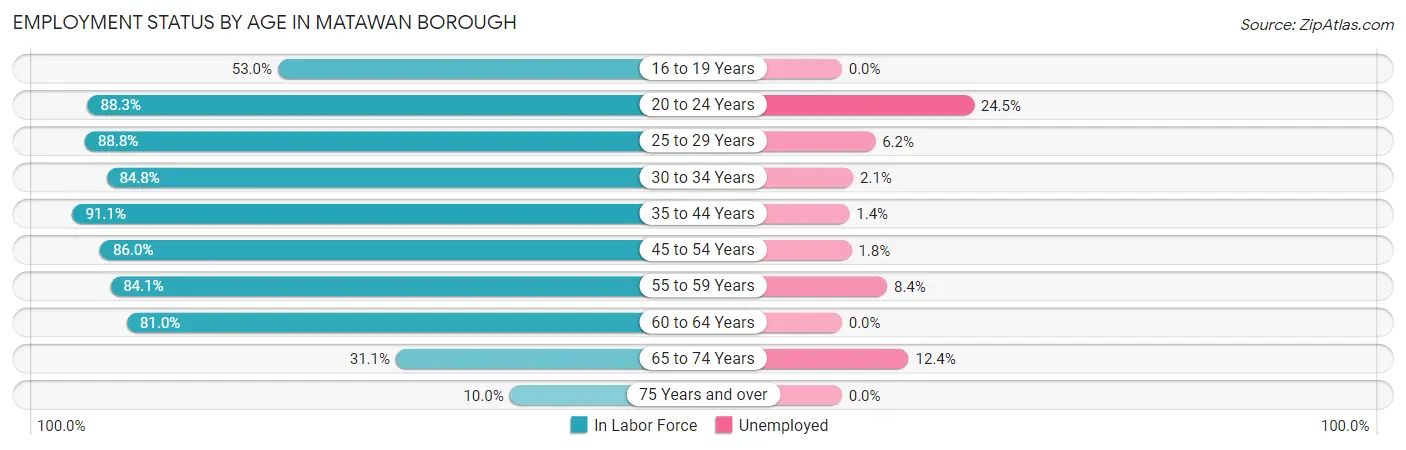
Employment Status by Age in Matawan borough
According to the labor force statistics for Matawan borough, out of the total population over 16 years of age (7,621), 75.0% or 5,716 individuals are in the labor force, with 4.3% or 246 of them unemployed. The age group with the highest labor force participation rate is 35 to 44 years, with 91.1% or 1,285 individuals in the labor force. Within the labor force, the 20 to 24 years age range has the highest percentage of unemployed individuals, with 24.5% or 61 of them being unemployed.
| Age Bracket | In Labor Force | Unemployed |
| 16 to 19 Years | 176 (53.0%) | 0 (0.0%) |
| 20 to 24 Years | 249 (88.3%) | 61 (24.5%) |
| 25 to 29 Years | 725 (88.8%) | 45 (6.2%) |
| 30 to 34 Years | 727 (84.8%) | 15 (2.1%) |
| 35 to 44 Years | 1,285 (91.1%) | 18 (1.4%) |
| 45 to 54 Years | 1,137 (86.0%) | 20 (1.8%) |
| 55 to 59 Years | 653 (84.1%) | 55 (8.4%) |
| 60 to 64 Years | 481 (81.0%) | 0 (0.0%) |
| 65 to 74 Years | 233 (31.1%) | 29 (12.4%) |
| 75 Years and over | 48 (10.0%) | 0 (0.0%) |
| Total | 5,716 (75.0%) | 246 (4.3%) |
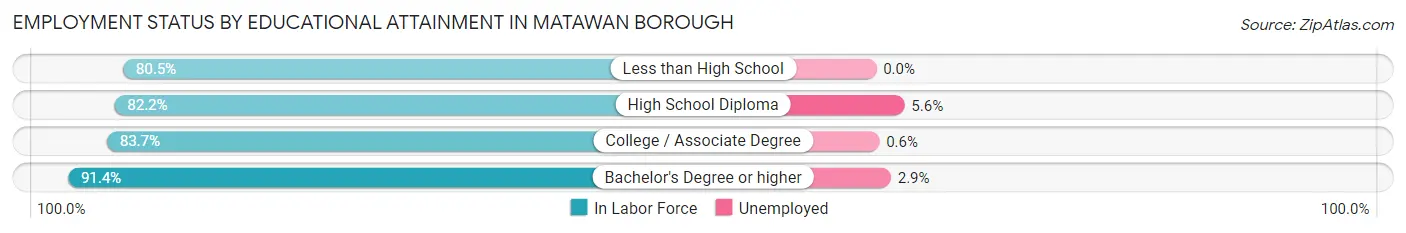
Employment Status by Educational Attainment in Matawan borough
According to labor force statistics for Matawan borough, 86.7% of individuals (5,008) out of the total population between 25 and 64 years of age (5,776) are in the labor force, with 3.1% or 155 of them being unemployed. The group with the highest labor force participation rate are those with the educational attainment of bachelor's degree or higher, with 91.4% or 2,381 individuals in the labor force. Within the labor force, individuals with high school diploma education have the highest percentage of unemployment, with 5.6% or 75 of them being unemployed.
| Educational Attainment | In Labor Force | Unemployed |
| Less than High School | 33 (80.5%) | 0 (0.0%) |
| High School Diploma | 1,345 (82.2%) | 92 (5.6%) |
| College / Associate Degree | 1,250 (83.7%) | 9 (0.6%) |
| Bachelor's Degree or higher | 2,381 (91.4%) | 76 (2.9%) |
| Total | 5,008 (86.7%) | 179 (3.1%) |
Employment Occupations by Sex in Matawan borough
Management, Business, Science and Arts Occupations
The most common Management, Business, Science and Arts occupations in Matawan borough are Community & Social Service (789 | 14.4%), Management (755 | 13.8%), Education Instruction & Library (490 | 9.0%), Health Diagnosing & Treating (411 | 7.5%), and Business & Financial (378 | 6.9%).
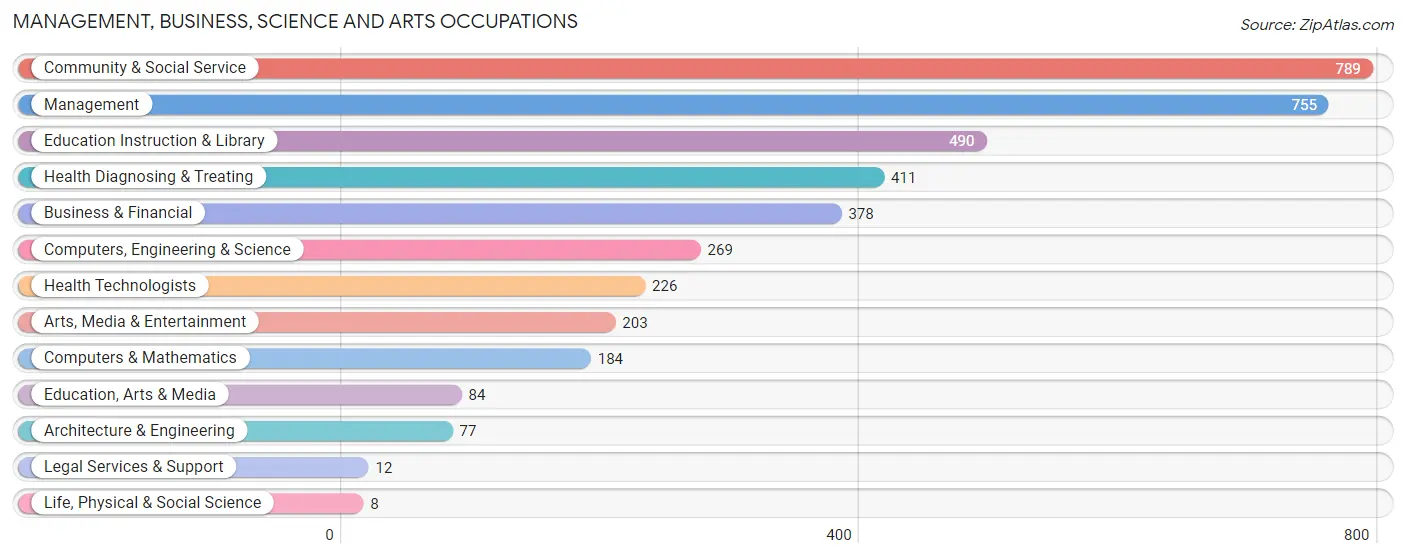
Management, Business, Science and Arts Occupations by Sex
Within the Management, Business, Science and Arts occupations in Matawan borough, the most male-oriented occupations are Architecture & Engineering (100.0%), Life, Physical & Social Science (100.0%), and Management (80.1%), while the most female-oriented occupations are Education, Arts & Media (100.0%), Legal Services & Support (100.0%), and Health Technologists (95.1%).
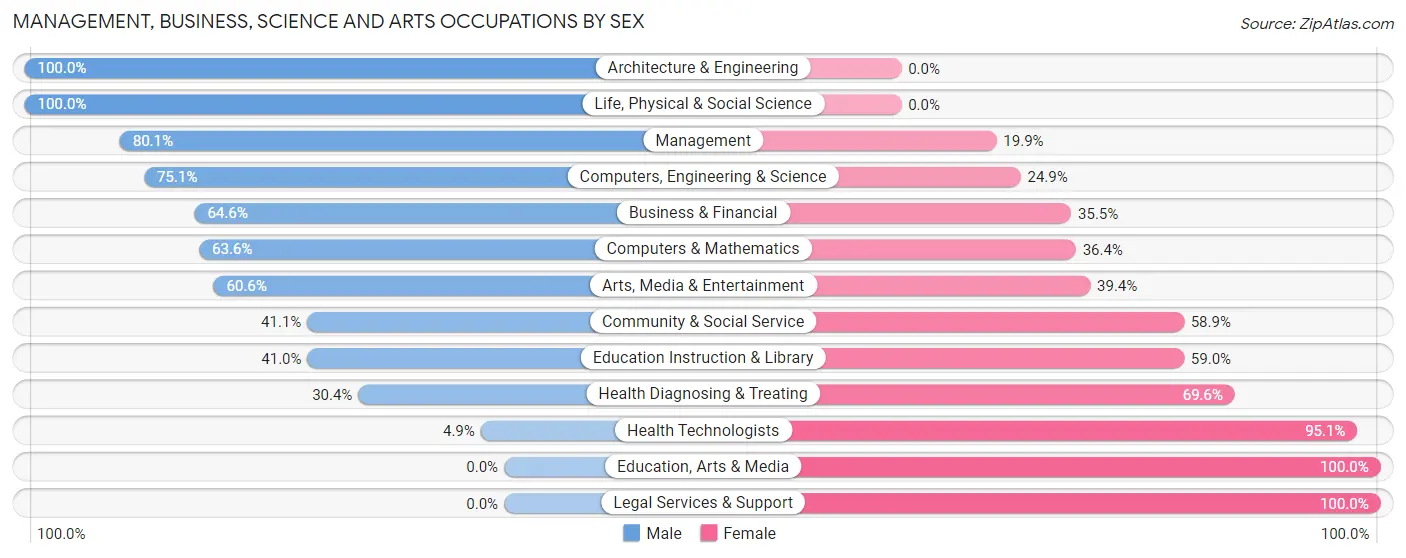
| Occupation | Male | Female |
| Management | 605 (80.1%) | 150 (19.9%) |
| Business & Financial | 244 (64.5%) | 134 (35.4%) |
| Computers, Engineering & Science | 202 (75.1%) | 67 (24.9%) |
| Computers & Mathematics | 117 (63.6%) | 67 (36.4%) |
| Architecture & Engineering | 77 (100.0%) | 0 (0.0%) |
| Life, Physical & Social Science | 8 (100.0%) | 0 (0.0%) |
| Community & Social Service | 324 (41.1%) | 465 (58.9%) |
| Education, Arts & Media | 0 (0.0%) | 84 (100.0%) |
| Legal Services & Support | 0 (0.0%) | 12 (100.0%) |
| Education Instruction & Library | 201 (41.0%) | 289 (59.0%) |
| Arts, Media & Entertainment | 123 (60.6%) | 80 (39.4%) |
| Health Diagnosing & Treating | 125 (30.4%) | 286 (69.6%) |
| Health Technologists | 11 (4.9%) | 215 (95.1%) |
| Total (Category) | 1,500 (57.7%) | 1,102 (42.3%) |
| Total (Overall) | 3,233 (59.1%) | 2,238 (40.9%) |
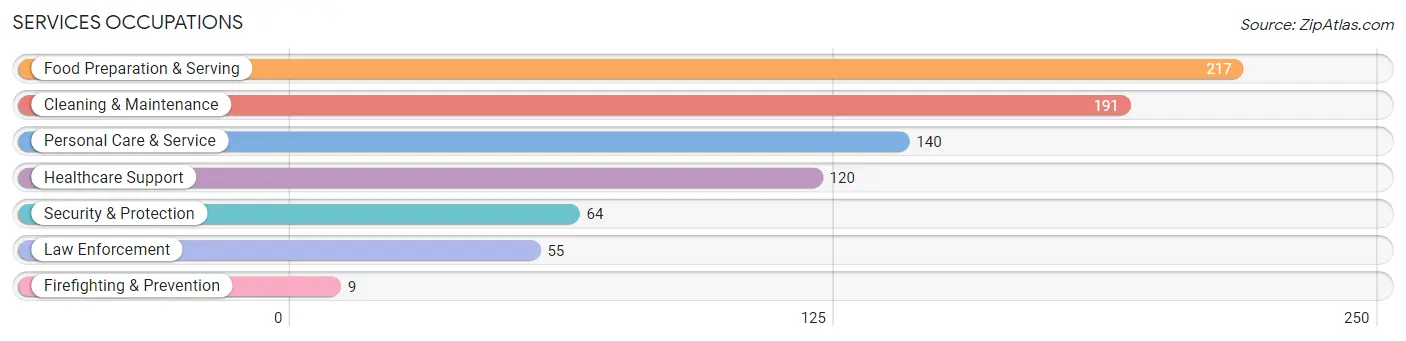
Services Occupations
The most common Services occupations in Matawan borough are Food Preparation & Serving (217 | 4.0%), Cleaning & Maintenance (191 | 3.5%), Personal Care & Service (140 | 2.6%), Healthcare Support (120 | 2.2%), and Security & Protection (64 | 1.2%).
Services Occupations by Sex
Within the Services occupations in Matawan borough, the most male-oriented occupations are Security & Protection (100.0%), Firefighting & Prevention (100.0%), and Law Enforcement (100.0%), while the most female-oriented occupations are Personal Care & Service (92.1%), Healthcare Support (57.5%), and Food Preparation & Serving (47.0%).
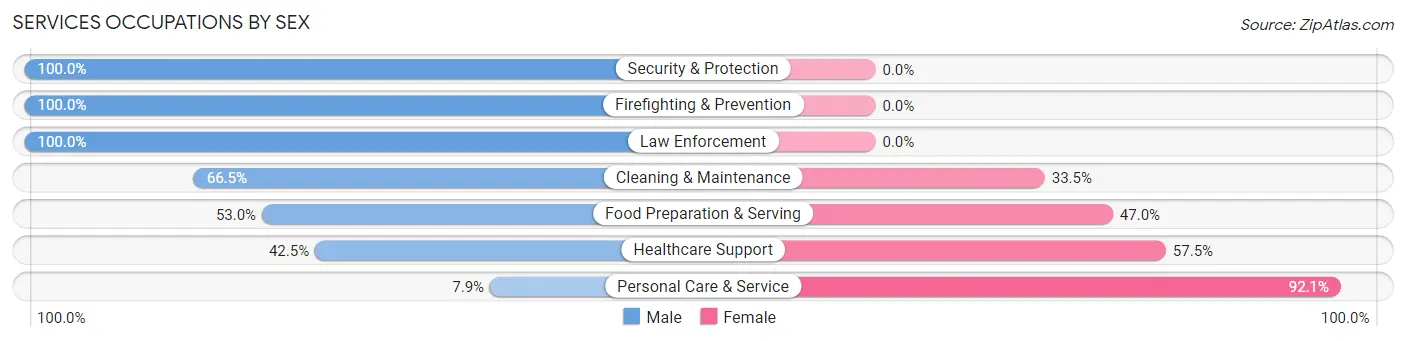
| Occupation | Male | Female |
| Healthcare Support | 51 (42.5%) | 69 (57.5%) |
| Security & Protection | 64 (100.0%) | 0 (0.0%) |
| Firefighting & Prevention | 9 (100.0%) | 0 (0.0%) |
| Law Enforcement | 55 (100.0%) | 0 (0.0%) |
| Food Preparation & Serving | 115 (53.0%) | 102 (47.0%) |
| Cleaning & Maintenance | 127 (66.5%) | 64 (33.5%) |
| Personal Care & Service | 11 (7.9%) | 129 (92.1%) |
| Total (Category) | 368 (50.3%) | 364 (49.7%) |
| Total (Overall) | 3,233 (59.1%) | 2,238 (40.9%) |
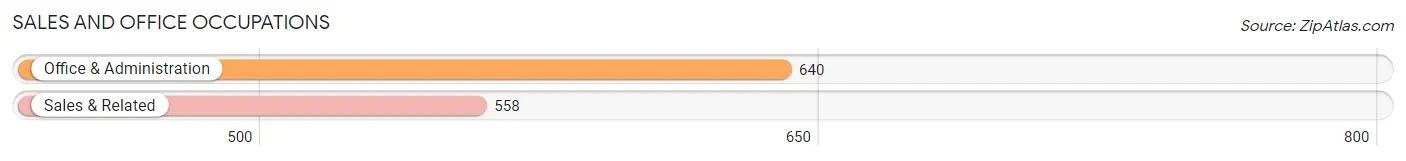
Sales and Office Occupations
The most common Sales and Office occupations in Matawan borough are Office & Administration (640 | 11.7%), and Sales & Related (558 | 10.2%).
Sales and Office Occupations by Sex
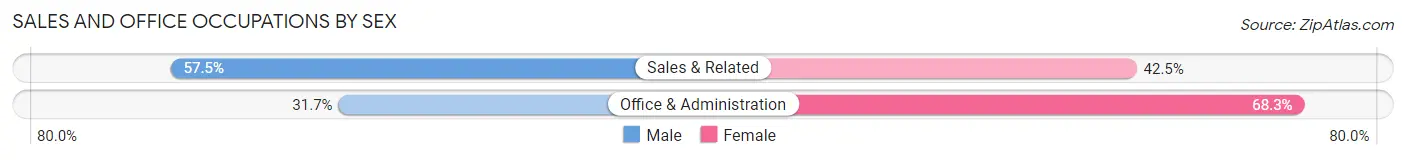
| Occupation | Male | Female |
| Sales & Related | 321 (57.5%) | 237 (42.5%) |
| Office & Administration | 203 (31.7%) | 437 (68.3%) |
| Total (Category) | 524 (43.7%) | 674 (56.3%) |
| Total (Overall) | 3,233 (59.1%) | 2,238 (40.9%) |
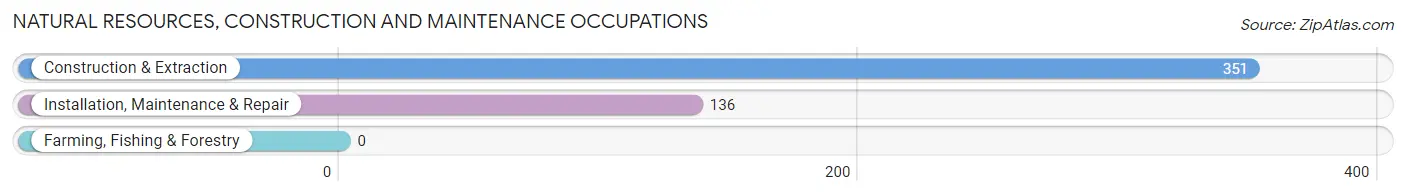
Natural Resources, Construction and Maintenance Occupations
The most common Natural Resources, Construction and Maintenance occupations in Matawan borough are Construction & Extraction (351 | 6.4%), and Installation, Maintenance & Repair (136 | 2.5%).
Natural Resources, Construction and Maintenance Occupations by Sex
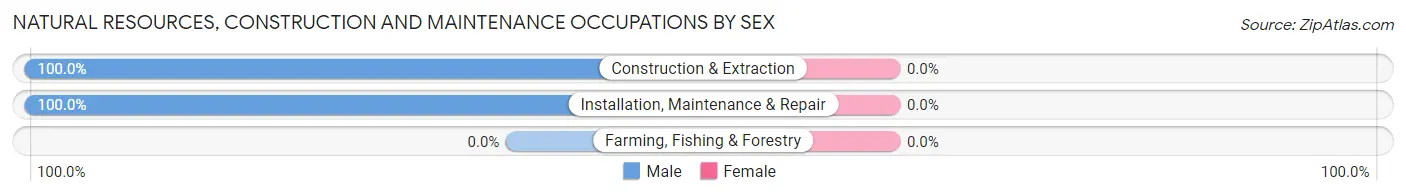
| Occupation | Male | Female |
| Farming, Fishing & Forestry | 0 (0.0%) | 0 (0.0%) |
| Construction & Extraction | 351 (100.0%) | 0 (0.0%) |
| Installation, Maintenance & Repair | 136 (100.0%) | 0 (0.0%) |
| Total (Category) | 487 (100.0%) | 0 (0.0%) |
| Total (Overall) | 3,233 (59.1%) | 2,238 (40.9%) |
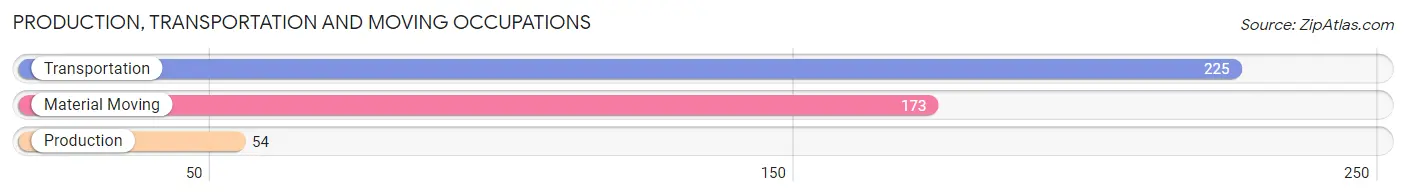
Production, Transportation and Moving Occupations
The most common Production, Transportation and Moving occupations in Matawan borough are Transportation (225 | 4.1%), Material Moving (173 | 3.2%), and Production (54 | 1.0%).
Production, Transportation and Moving Occupations by Sex
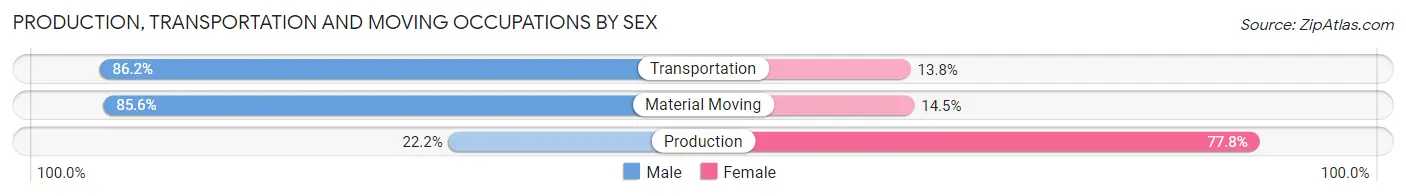
| Occupation | Male | Female |
| Production | 12 (22.2%) | 42 (77.8%) |
| Transportation | 194 (86.2%) | 31 (13.8%) |
| Material Moving | 148 (85.6%) | 25 (14.4%) |
| Total (Category) | 354 (78.3%) | 98 (21.7%) |
| Total (Overall) | 3,233 (59.1%) | 2,238 (40.9%) |
Employment Industries by Sex in Matawan borough
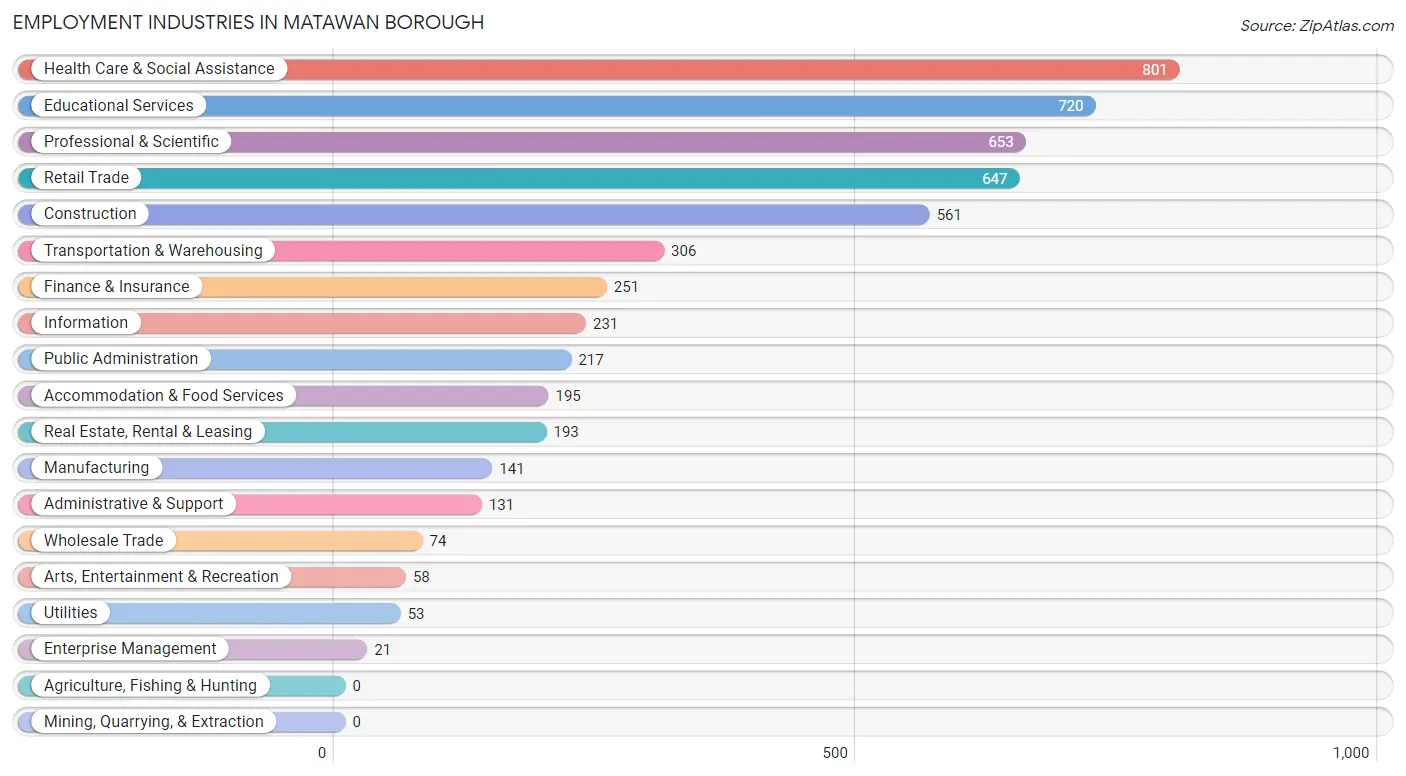
Employment Industries in Matawan borough
The major employment industries in Matawan borough include Health Care & Social Assistance (801 | 14.6%), Educational Services (720 | 13.2%), Professional & Scientific (653 | 11.9%), Retail Trade (647 | 11.8%), and Construction (561 | 10.2%).
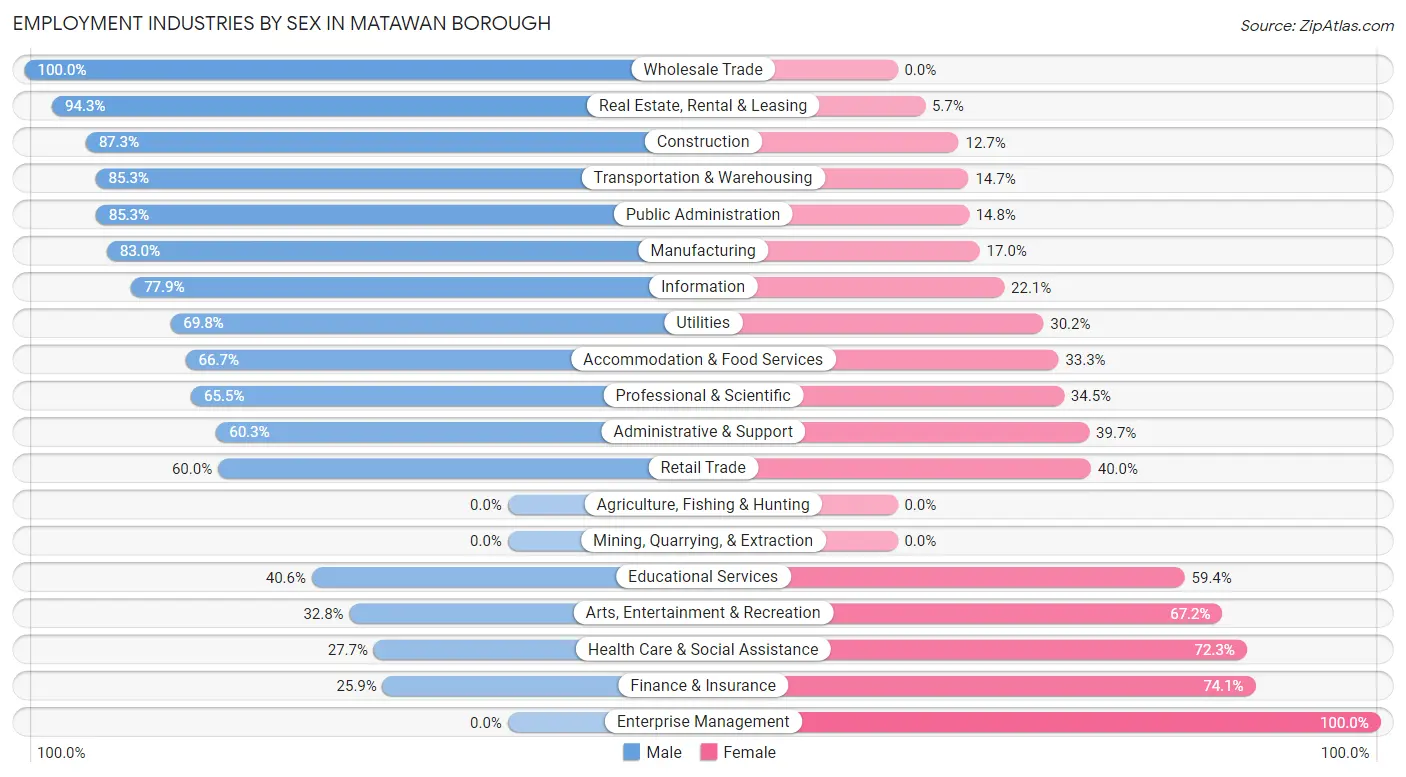
Employment Industries by Sex in Matawan borough
The Matawan borough industries that see more men than women are Wholesale Trade (100.0%), Real Estate, Rental & Leasing (94.3%), and Construction (87.3%), whereas the industries that tend to have a higher number of women are Enterprise Management (100.0%), Finance & Insurance (74.1%), and Health Care & Social Assistance (72.3%).
| Industry | Male | Female |
| Agriculture, Fishing & Hunting | 0 (0.0%) | 0 (0.0%) |
| Mining, Quarrying, & Extraction | 0 (0.0%) | 0 (0.0%) |
| Construction | 490 (87.3%) | 71 (12.7%) |
| Manufacturing | 117 (83.0%) | 24 (17.0%) |
| Wholesale Trade | 74 (100.0%) | 0 (0.0%) |
| Retail Trade | 388 (60.0%) | 259 (40.0%) |
| Transportation & Warehousing | 261 (85.3%) | 45 (14.7%) |
| Utilities | 37 (69.8%) | 16 (30.2%) |
| Information | 180 (77.9%) | 51 (22.1%) |
| Finance & Insurance | 65 (25.9%) | 186 (74.1%) |
| Real Estate, Rental & Leasing | 182 (94.3%) | 11 (5.7%) |
| Professional & Scientific | 428 (65.5%) | 225 (34.5%) |
| Enterprise Management | 0 (0.0%) | 21 (100.0%) |
| Administrative & Support | 79 (60.3%) | 52 (39.7%) |
| Educational Services | 292 (40.6%) | 428 (59.4%) |
| Health Care & Social Assistance | 222 (27.7%) | 579 (72.3%) |
| Arts, Entertainment & Recreation | 19 (32.8%) | 39 (67.2%) |
| Accommodation & Food Services | 130 (66.7%) | 65 (33.3%) |
| Public Administration | 185 (85.3%) | 32 (14.7%) |
| Total | 3,233 (59.1%) | 2,238 (40.9%) |
Education in Matawan borough
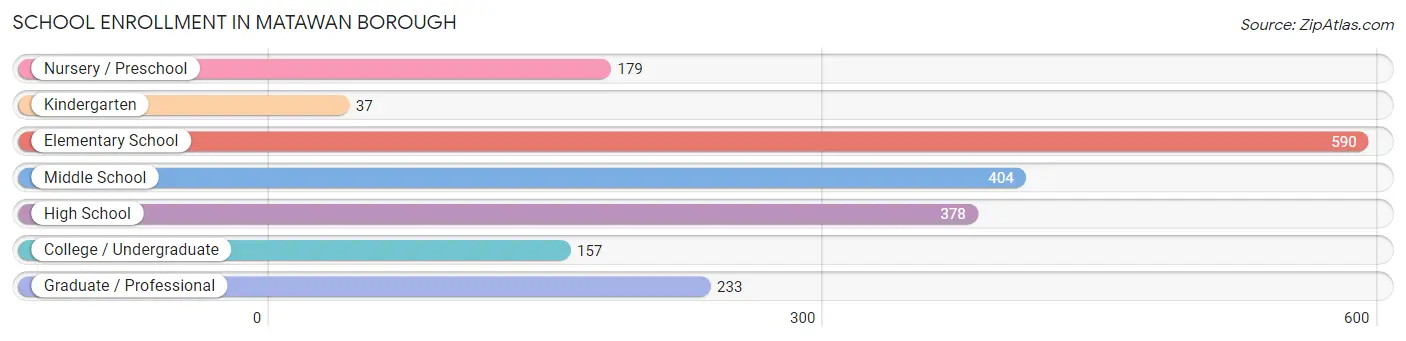
School Enrollment in Matawan borough
The most common levels of schooling among the 1,978 students in Matawan borough are elementary school (590 | 29.8%), middle school (404 | 20.4%), and high school (378 | 19.1%).
| School Level | # Students | % Students |
| Nursery / Preschool | 179 | 9.0% |
| Kindergarten | 37 | 1.9% |
| Elementary School | 590 | 29.8% |
| Middle School | 404 | 20.4% |
| High School | 378 | 19.1% |
| College / Undergraduate | 157 | 7.9% |
| Graduate / Professional | 233 | 11.8% |
| Total | 1,978 | 100.0% |
School Enrollment by Age by Funding Source in Matawan borough
Out of a total of 1,978 students who are enrolled in schools in Matawan borough, 273 (13.8%) attend a private institution, while the remaining 1,705 (86.2%) are enrolled in public schools. The age group of 25 to 34 year olds has the highest likelihood of being enrolled in private schools, with 43 (30.1% in the age bracket) enrolled. Conversely, the age group of 18 to 19 year olds has the lowest likelihood of being enrolled in a private school, with 103 (100.0% in the age bracket) attending a public institution.
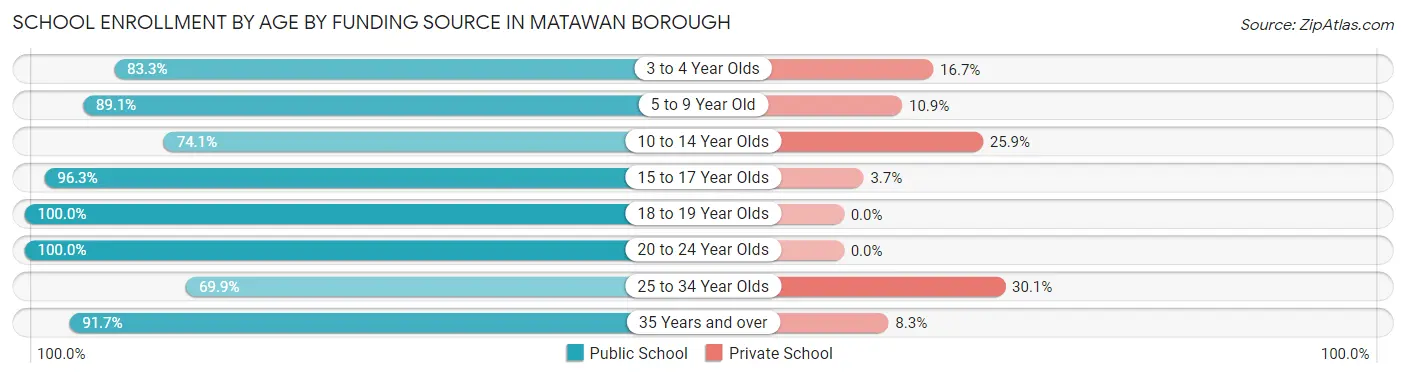
| Age Bracket | Public School | Private School |
| 3 to 4 Year Olds | 80 (83.3%) | 16 (16.7%) |
| 5 to 9 Year Old | 615 (89.1%) | 75 (10.9%) |
| 10 to 14 Year Olds | 317 (74.1%) | 111 (25.9%) |
| 15 to 17 Year Olds | 261 (96.3%) | 10 (3.7%) |
| 18 to 19 Year Olds | 103 (100.0%) | 0 (0.0%) |
| 20 to 24 Year Olds | 43 (100.0%) | 0 (0.0%) |
| 25 to 34 Year Olds | 100 (69.9%) | 43 (30.1%) |
| 35 Years and over | 187 (91.7%) | 17 (8.3%) |
| Total | 1,705 (86.2%) | 273 (13.8%) |
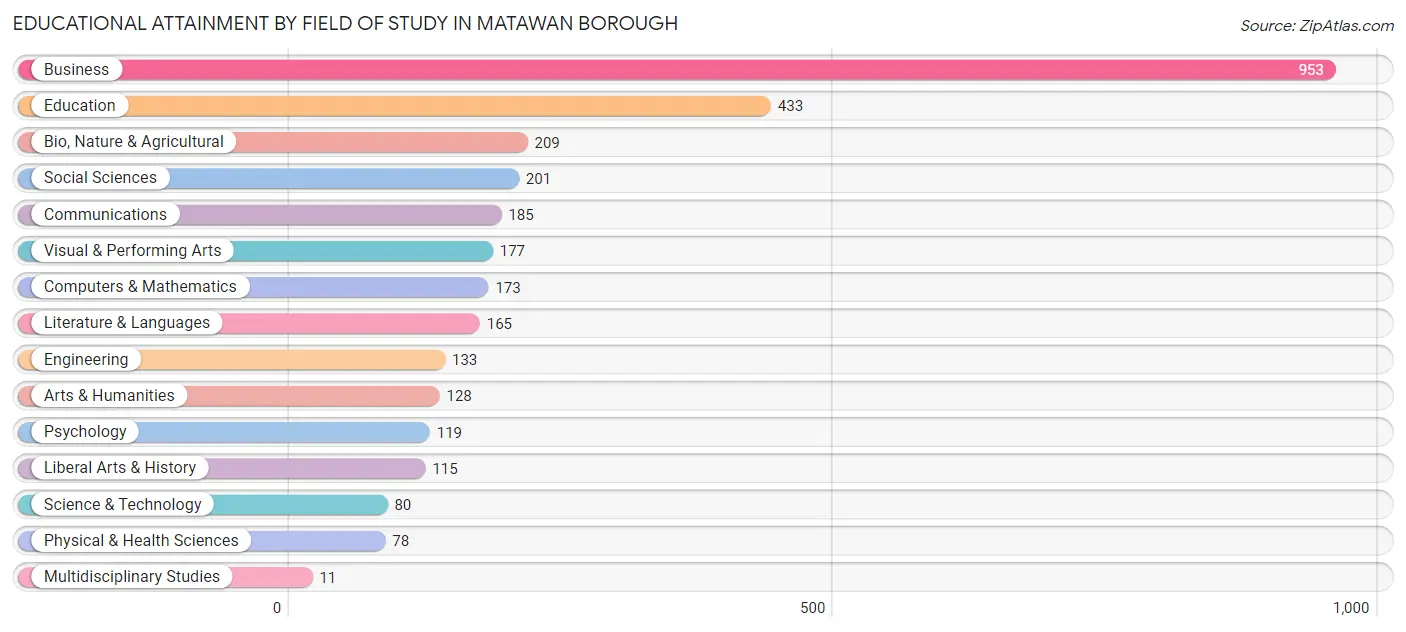
Educational Attainment by Field of Study in Matawan borough
Business (953 | 30.2%), education (433 | 13.7%), bio, nature & agricultural (209 | 6.6%), social sciences (201 | 6.4%), and communications (185 | 5.9%) are the most common fields of study among 3,160 individuals in Matawan borough who have obtained a bachelor's degree or higher.
| Field of Study | # Graduates | % Graduates |
| Computers & Mathematics | 173 | 5.5% |
| Bio, Nature & Agricultural | 209 | 6.6% |
| Physical & Health Sciences | 78 | 2.5% |
| Psychology | 119 | 3.8% |
| Social Sciences | 201 | 6.4% |
| Engineering | 133 | 4.2% |
| Multidisciplinary Studies | 11 | 0.4% |
| Science & Technology | 80 | 2.5% |
| Business | 953 | 30.2% |
| Education | 433 | 13.7% |
| Literature & Languages | 165 | 5.2% |
| Liberal Arts & History | 115 | 3.6% |
| Visual & Performing Arts | 177 | 5.6% |
| Communications | 185 | 5.9% |
| Arts & Humanities | 128 | 4.1% |
| Total | 3,160 | 100.0% |
Transportation & Commute in Matawan borough
Vehicle Availability by Sex in Matawan borough
The most prevalent vehicle ownership categories in Matawan borough are males with 2 vehicles (1,344, accounting for 41.8%) and females with 2 vehicles (1,027, making up 60.7%).
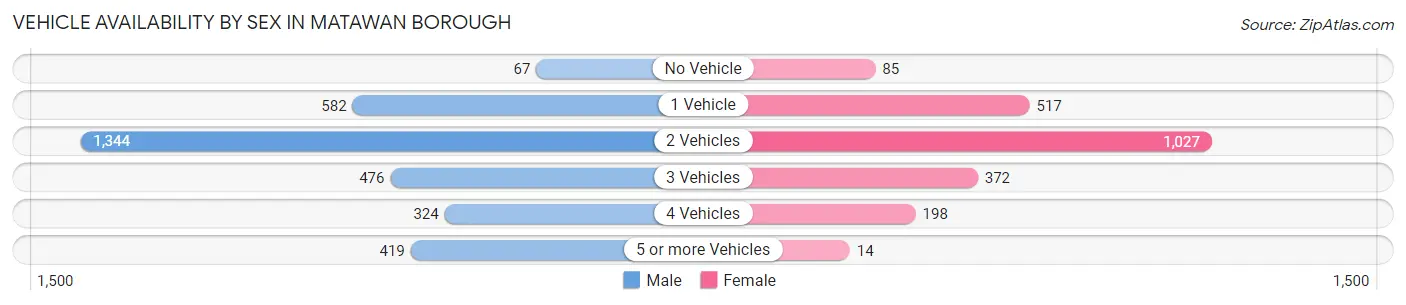
| Vehicles Available | Male | Female |
| No Vehicle | 67 (2.1%) | 85 (3.8%) |
| 1 Vehicle | 582 (18.1%) | 517 (23.4%) |
| 2 Vehicles | 1,344 (41.8%) | 1,027 (46.4%) |
| 3 Vehicles | 476 (14.8%) | 372 (16.8%) |
| 4 Vehicles | 324 (10.1%) | 198 (8.9%) |
| 5 or more Vehicles | 419 (13.0%) | 14 (0.6%) |
| Total | 3,212 (100.0%) | 2,213 (100.0%) |
Commute Time in Matawan borough
The most frequently occuring commute durations in Matawan borough are 20 to 24 minutes (755 commuters, 16.5%), 30 to 34 minutes (640 commuters, 14.0%), and 5 to 9 minutes (424 commuters, 9.3%).
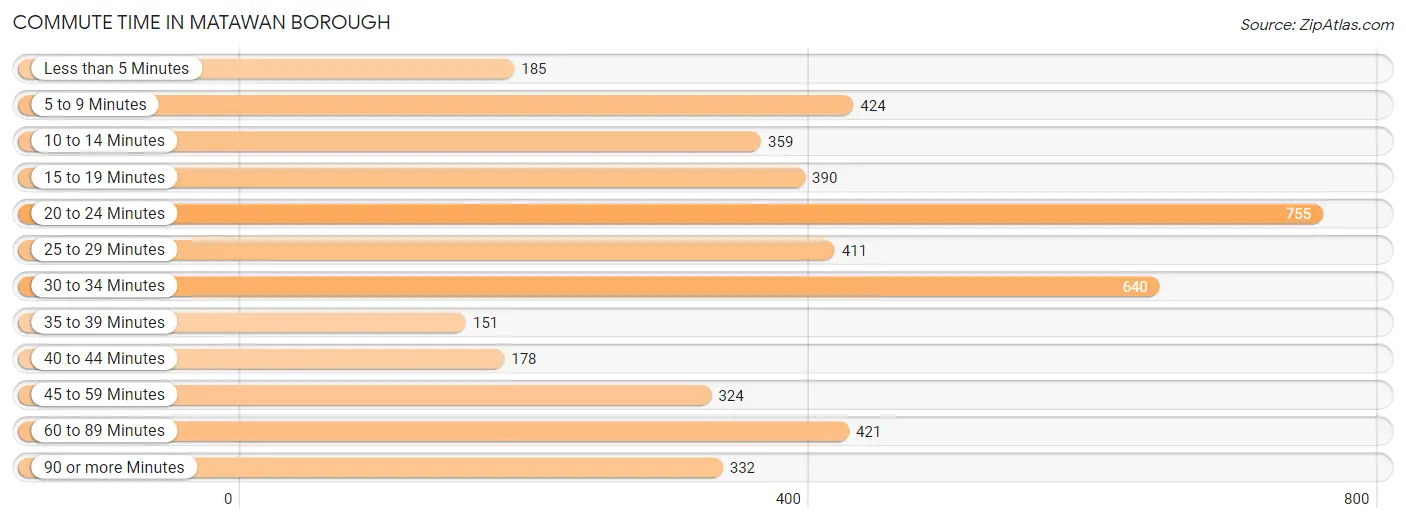
| Commute Time | # Commuters | % Commuters |
| Less than 5 Minutes | 185 | 4.1% |
| 5 to 9 Minutes | 424 | 9.3% |
| 10 to 14 Minutes | 359 | 7.9% |
| 15 to 19 Minutes | 390 | 8.5% |
| 20 to 24 Minutes | 755 | 16.5% |
| 25 to 29 Minutes | 411 | 9.0% |
| 30 to 34 Minutes | 640 | 14.0% |
| 35 to 39 Minutes | 151 | 3.3% |
| 40 to 44 Minutes | 178 | 3.9% |
| 45 to 59 Minutes | 324 | 7.1% |
| 60 to 89 Minutes | 421 | 9.2% |
| 90 or more Minutes | 332 | 7.3% |
Commute Time by Sex in Matawan borough
The most common commute times in Matawan borough are 20 to 24 minutes (435 commuters, 16.2%) for males and 30 to 34 minutes (366 commuters, 19.5%) for females.
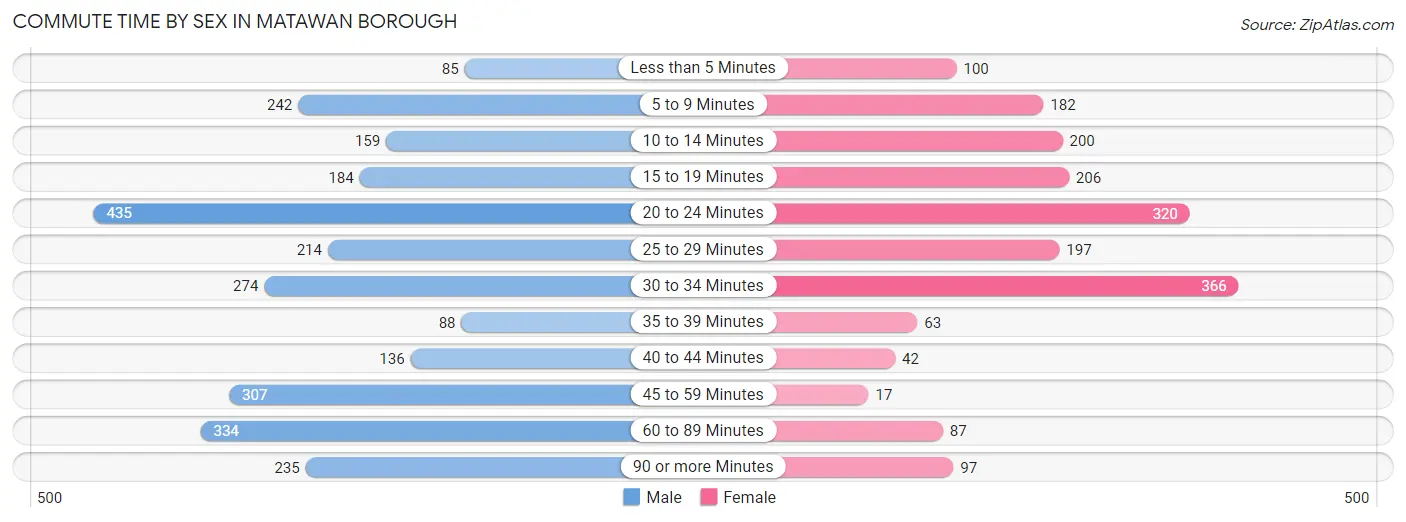
| Commute Time | Male | Female |
| Less than 5 Minutes | 85 (3.2%) | 100 (5.3%) |
| 5 to 9 Minutes | 242 (9.0%) | 182 (9.7%) |
| 10 to 14 Minutes | 159 (5.9%) | 200 (10.7%) |
| 15 to 19 Minutes | 184 (6.8%) | 206 (11.0%) |
| 20 to 24 Minutes | 435 (16.2%) | 320 (17.1%) |
| 25 to 29 Minutes | 214 (8.0%) | 197 (10.5%) |
| 30 to 34 Minutes | 274 (10.2%) | 366 (19.5%) |
| 35 to 39 Minutes | 88 (3.3%) | 63 (3.4%) |
| 40 to 44 Minutes | 136 (5.1%) | 42 (2.2%) |
| 45 to 59 Minutes | 307 (11.4%) | 17 (0.9%) |
| 60 to 89 Minutes | 334 (12.4%) | 87 (4.6%) |
| 90 or more Minutes | 235 (8.7%) | 97 (5.2%) |
Time of Departure to Work by Sex in Matawan borough
The most frequent times of departure to work in Matawan borough are 7:00 AM to 7:29 AM (423, 15.7%) for males and 7:00 AM to 7:29 AM (350, 18.6%) for females.
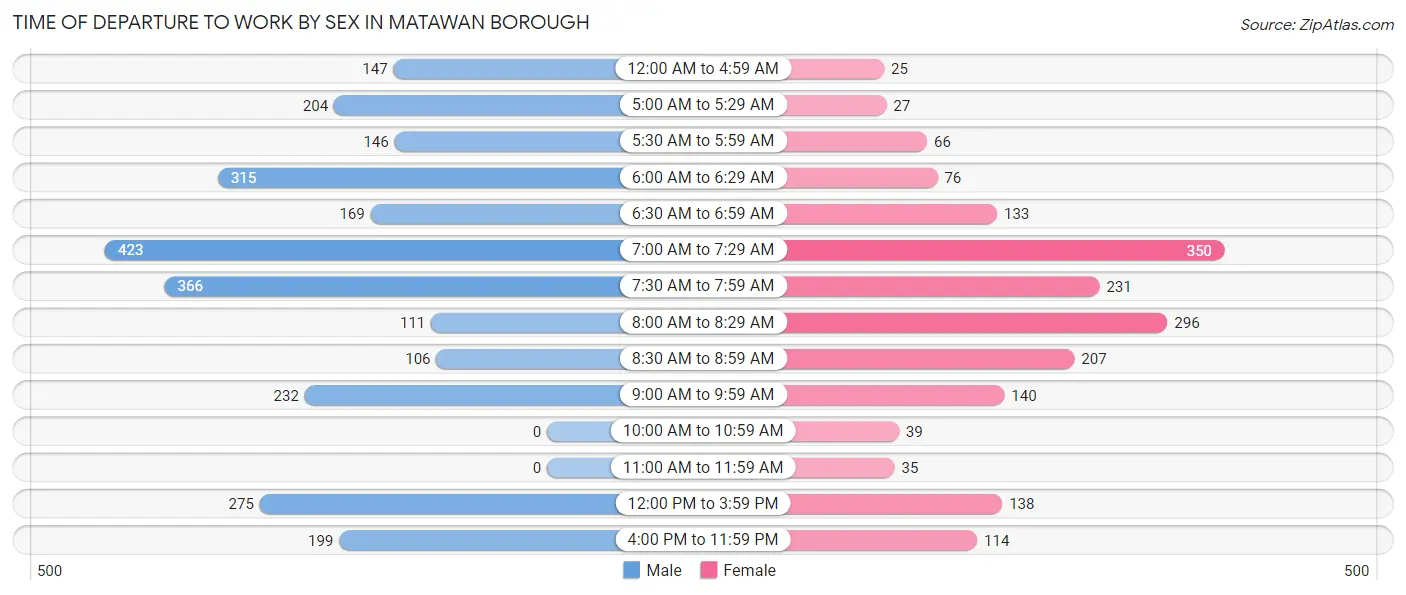
| Time of Departure | Male | Female |
| 12:00 AM to 4:59 AM | 147 (5.5%) | 25 (1.3%) |
| 5:00 AM to 5:29 AM | 204 (7.6%) | 27 (1.4%) |
| 5:30 AM to 5:59 AM | 146 (5.4%) | 66 (3.5%) |
| 6:00 AM to 6:29 AM | 315 (11.7%) | 76 (4.1%) |
| 6:30 AM to 6:59 AM | 169 (6.3%) | 133 (7.1%) |
| 7:00 AM to 7:29 AM | 423 (15.7%) | 350 (18.6%) |
| 7:30 AM to 7:59 AM | 366 (13.6%) | 231 (12.3%) |
| 8:00 AM to 8:29 AM | 111 (4.1%) | 296 (15.8%) |
| 8:30 AM to 8:59 AM | 106 (3.9%) | 207 (11.0%) |
| 9:00 AM to 9:59 AM | 232 (8.6%) | 140 (7.5%) |
| 10:00 AM to 10:59 AM | 0 (0.0%) | 39 (2.1%) |
| 11:00 AM to 11:59 AM | 0 (0.0%) | 35 (1.9%) |
| 12:00 PM to 3:59 PM | 275 (10.2%) | 138 (7.3%) |
| 4:00 PM to 11:59 PM | 199 (7.4%) | 114 (6.1%) |
| Total | 2,693 (100.0%) | 1,877 (100.0%) |
Housing Occupancy in Matawan borough
Occupancy by Ownership in Matawan borough
Of the total 3,775 dwellings in Matawan borough, owner-occupied units account for 2,349 (62.2%), while renter-occupied units make up 1,426 (37.8%).
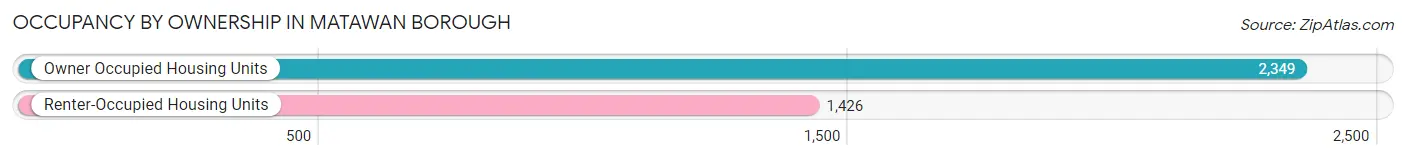
| Occupancy | # Housing Units | % Housing Units |
| Owner Occupied Housing Units | 2,349 | 62.2% |
| Renter-Occupied Housing Units | 1,426 | 37.8% |
| Total Occupied Housing Units | 3,775 | 100.0% |
Occupancy by Household Size in Matawan borough
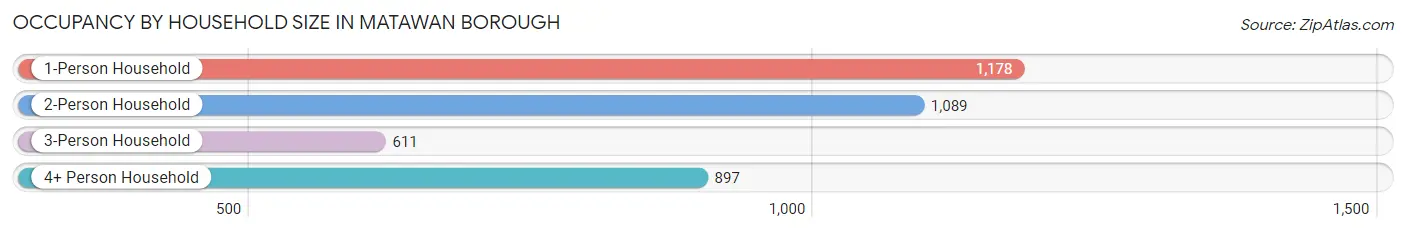
| Household Size | # Housing Units | % Housing Units |
| 1-Person Household | 1,178 | 31.2% |
| 2-Person Household | 1,089 | 28.8% |
| 3-Person Household | 611 | 16.2% |
| 4+ Person Household | 897 | 23.8% |
| Total Housing Units | 3,775 | 100.0% |
Occupancy by Ownership by Household Size in Matawan borough
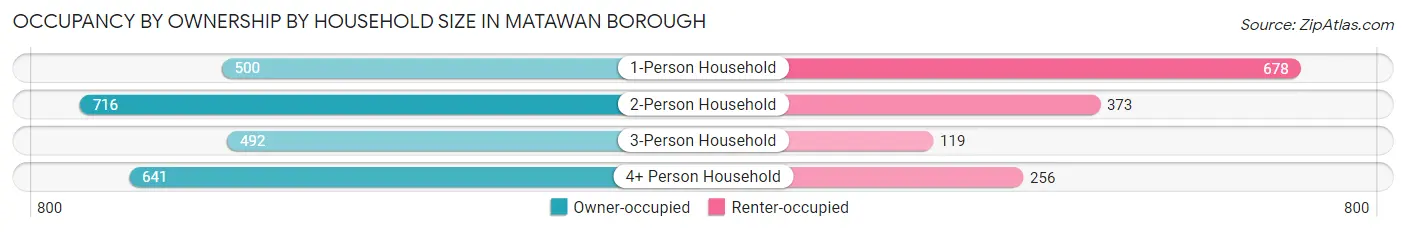
| Household Size | Owner-occupied | Renter-occupied |
| 1-Person Household | 500 (42.4%) | 678 (57.6%) |
| 2-Person Household | 716 (65.7%) | 373 (34.3%) |
| 3-Person Household | 492 (80.5%) | 119 (19.5%) |
| 4+ Person Household | 641 (71.5%) | 256 (28.5%) |
| Total Housing Units | 2,349 (62.2%) | 1,426 (37.8%) |
Occupancy by Educational Attainment in Matawan borough
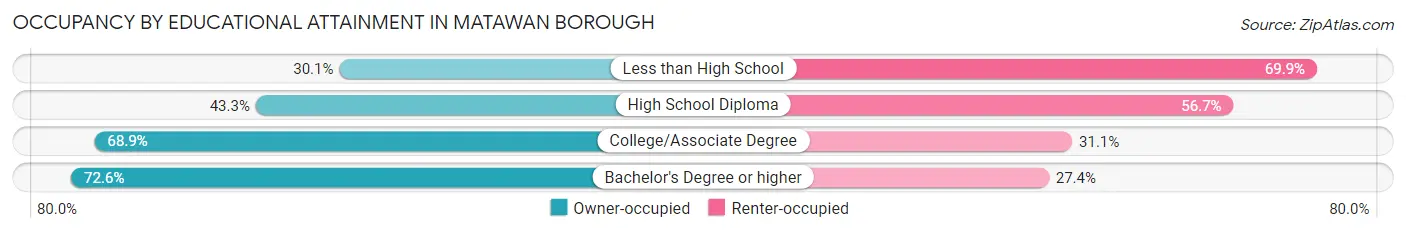
| Household Size | Owner-occupied | Renter-occupied |
| Less than High School | 34 (30.1%) | 79 (69.9%) |
| High School Diploma | 452 (43.3%) | 591 (56.7%) |
| College/Associate Degree | 725 (68.9%) | 327 (31.1%) |
| Bachelor's Degree or higher | 1,138 (72.6%) | 429 (27.4%) |
Occupancy by Age of Householder in Matawan borough
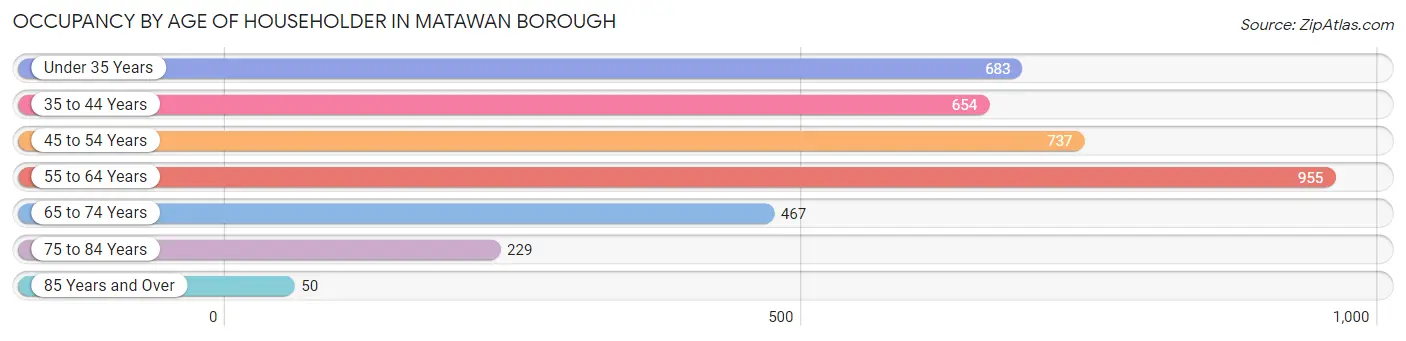
| Age Bracket | # Households | % Households |
| Under 35 Years | 683 | 18.1% |
| 35 to 44 Years | 654 | 17.3% |
| 45 to 54 Years | 737 | 19.5% |
| 55 to 64 Years | 955 | 25.3% |
| 65 to 74 Years | 467 | 12.4% |
| 75 to 84 Years | 229 | 6.1% |
| 85 Years and Over | 50 | 1.3% |
| Total | 3,775 | 100.0% |
Housing Finances in Matawan borough
Median Income by Occupancy in Matawan borough
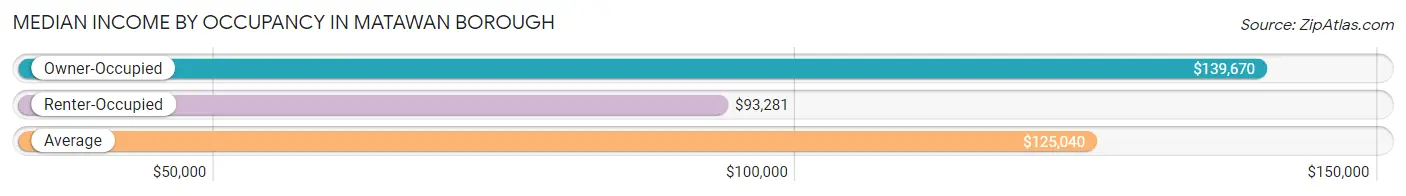
| Occupancy Type | # Households | Median Income |
| Owner-Occupied | 2,349 (62.2%) | $139,670 |
| Renter-Occupied | 1,426 (37.8%) | $93,281 |
| Average | 3,775 (100.0%) | $125,040 |
Occupancy by Householder Income Bracket in Matawan borough
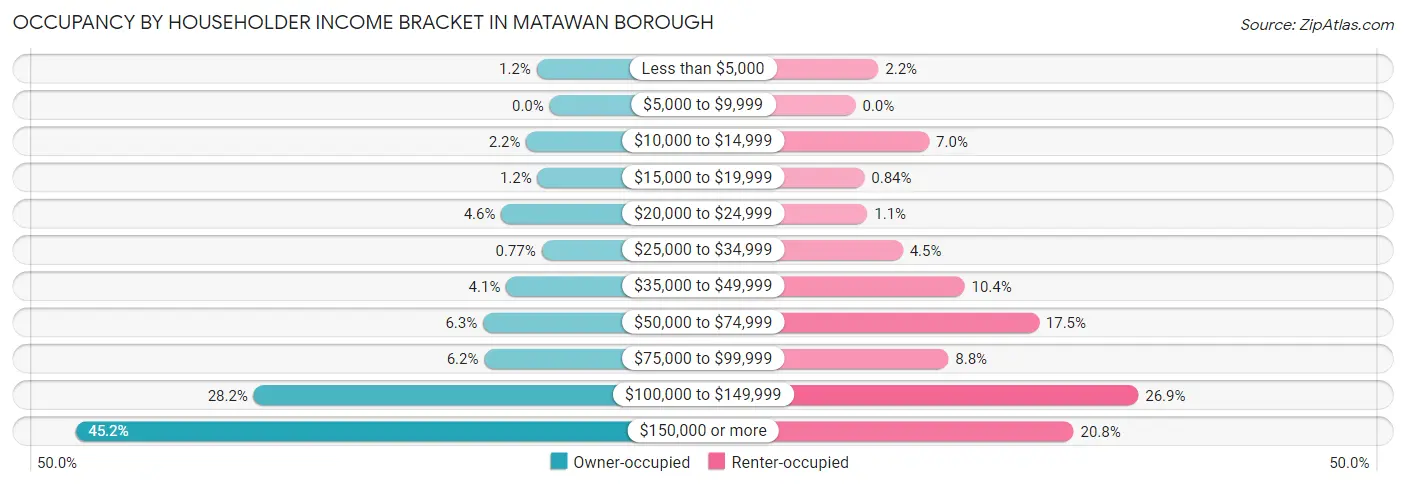
| Income Bracket | Owner-occupied | Renter-occupied |
| Less than $5,000 | 29 (1.2%) | 31 (2.2%) |
| $5,000 to $9,999 | 0 (0.0%) | 0 (0.0%) |
| $10,000 to $14,999 | 52 (2.2%) | 100 (7.0%) |
| $15,000 to $19,999 | 27 (1.1%) | 12 (0.8%) |
| $20,000 to $24,999 | 108 (4.6%) | 16 (1.1%) |
| $25,000 to $34,999 | 18 (0.8%) | 64 (4.5%) |
| $35,000 to $49,999 | 97 (4.1%) | 148 (10.4%) |
| $50,000 to $74,999 | 149 (6.3%) | 249 (17.5%) |
| $75,000 to $99,999 | 146 (6.2%) | 126 (8.8%) |
| $100,000 to $149,999 | 662 (28.2%) | 384 (26.9%) |
| $150,000 or more | 1,061 (45.2%) | 296 (20.8%) |
| Total | 2,349 (100.0%) | 1,426 (100.0%) |
Monthly Housing Cost Tiers in Matawan borough
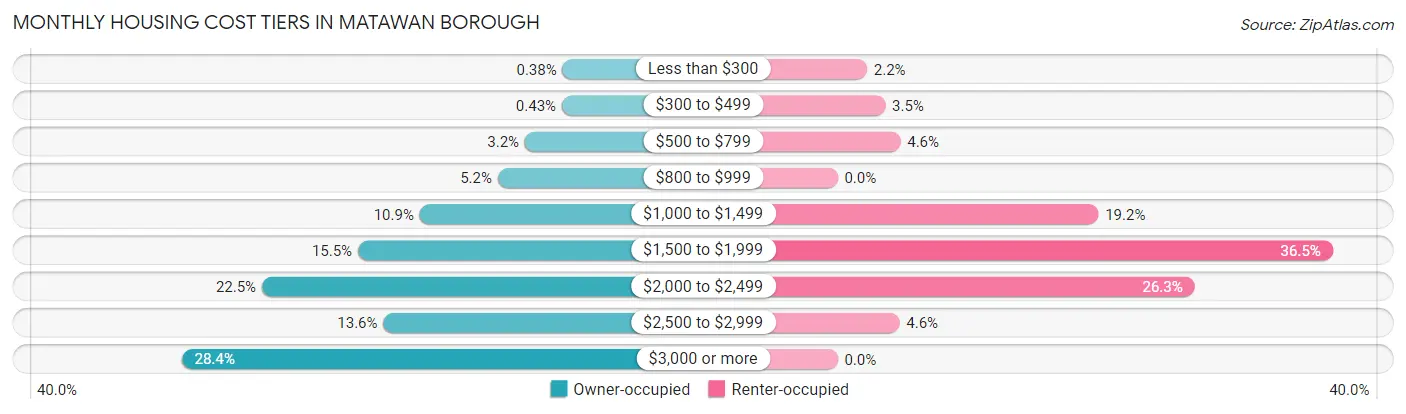
| Monthly Cost | Owner-occupied | Renter-occupied |
| Less than $300 | 9 (0.4%) | 31 (2.2%) |
| $300 to $499 | 10 (0.4%) | 50 (3.5%) |
| $500 to $799 | 74 (3.2%) | 66 (4.6%) |
| $800 to $999 | 121 (5.1%) | 0 (0.0%) |
| $1,000 to $1,499 | 256 (10.9%) | 274 (19.2%) |
| $1,500 to $1,999 | 363 (15.4%) | 520 (36.5%) |
| $2,000 to $2,499 | 529 (22.5%) | 375 (26.3%) |
| $2,500 to $2,999 | 319 (13.6%) | 65 (4.6%) |
| $3,000 or more | 668 (28.4%) | 0 (0.0%) |
| Total | 2,349 (100.0%) | 1,426 (100.0%) |
Physical Housing Characteristics in Matawan borough
Housing Structures in Matawan borough
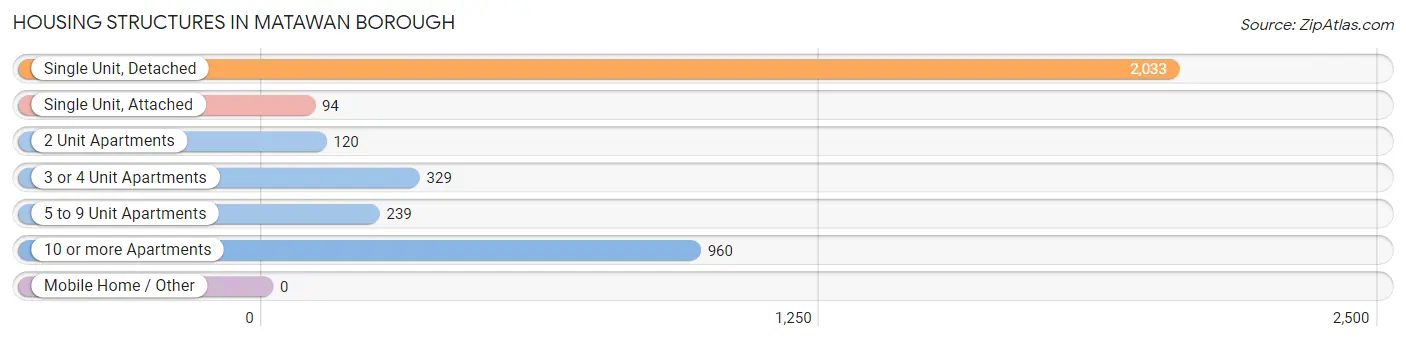
| Structure Type | # Housing Units | % Housing Units |
| Single Unit, Detached | 2,033 | 53.8% |
| Single Unit, Attached | 94 | 2.5% |
| 2 Unit Apartments | 120 | 3.2% |
| 3 or 4 Unit Apartments | 329 | 8.7% |
| 5 to 9 Unit Apartments | 239 | 6.3% |
| 10 or more Apartments | 960 | 25.4% |
| Mobile Home / Other | 0 | 0.0% |
| Total | 3,775 | 100.0% |
Housing Structures by Occupancy in Matawan borough
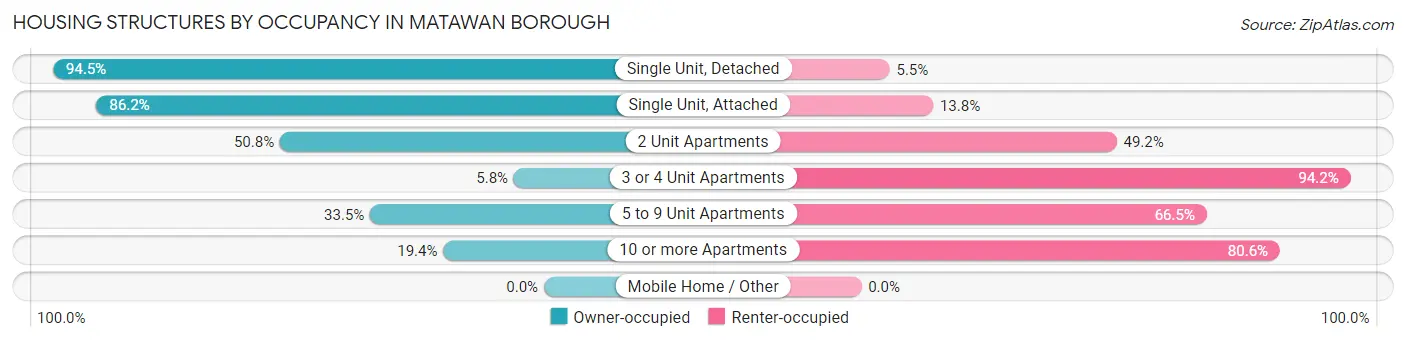
| Structure Type | Owner-occupied | Renter-occupied |
| Single Unit, Detached | 1,922 (94.5%) | 111 (5.5%) |
| Single Unit, Attached | 81 (86.2%) | 13 (13.8%) |
| 2 Unit Apartments | 61 (50.8%) | 59 (49.2%) |
| 3 or 4 Unit Apartments | 19 (5.8%) | 310 (94.2%) |
| 5 to 9 Unit Apartments | 80 (33.5%) | 159 (66.5%) |
| 10 or more Apartments | 186 (19.4%) | 774 (80.6%) |
| Mobile Home / Other | 0 (0.0%) | 0 (0.0%) |
| Total | 2,349 (62.2%) | 1,426 (37.8%) |
Housing Structures by Number of Rooms in Matawan borough
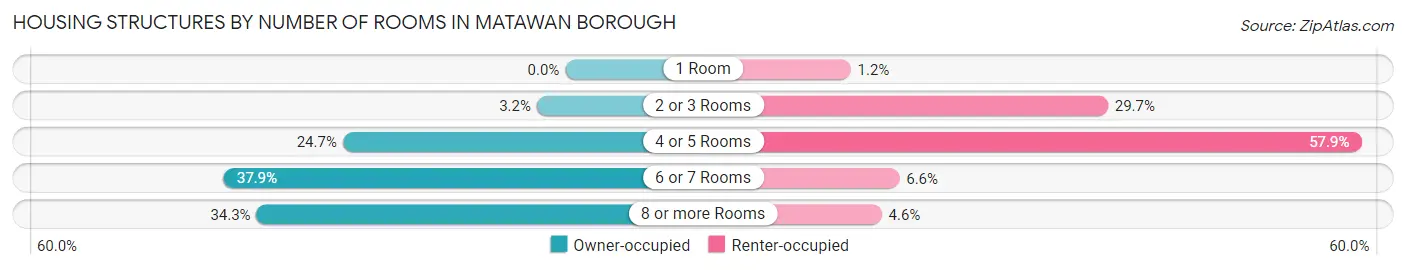
| Number of Rooms | Owner-occupied | Renter-occupied |
| 1 Room | 0 (0.0%) | 17 (1.2%) |
| 2 or 3 Rooms | 74 (3.2%) | 424 (29.7%) |
| 4 or 5 Rooms | 580 (24.7%) | 825 (57.9%) |
| 6 or 7 Rooms | 890 (37.9%) | 94 (6.6%) |
| 8 or more Rooms | 805 (34.3%) | 66 (4.6%) |
| Total | 2,349 (100.0%) | 1,426 (100.0%) |
Housing Structure by Heating Type in Matawan borough
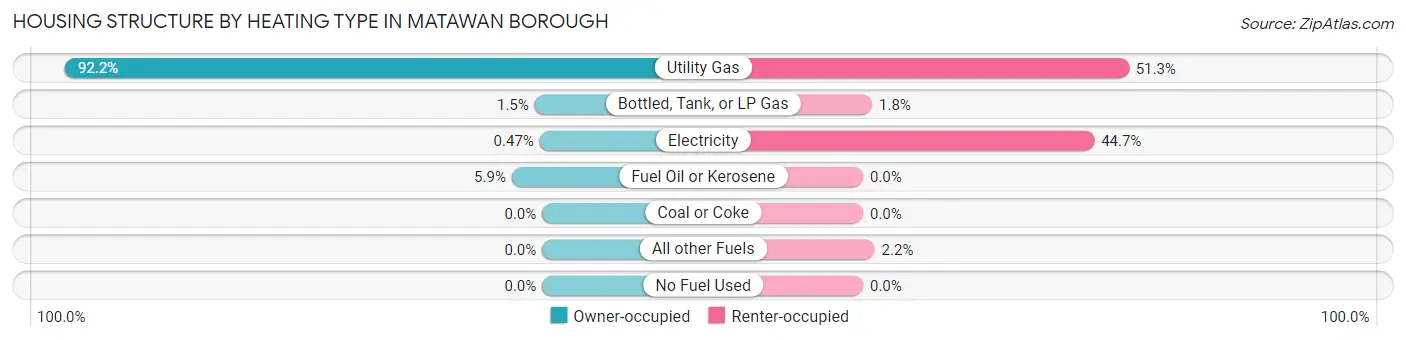
| Heating Type | Owner-occupied | Renter-occupied |
| Utility Gas | 2,166 (92.2%) | 732 (51.3%) |
| Bottled, Tank, or LP Gas | 34 (1.5%) | 25 (1.8%) |
| Electricity | 11 (0.5%) | 637 (44.7%) |
| Fuel Oil or Kerosene | 138 (5.9%) | 0 (0.0%) |
| Coal or Coke | 0 (0.0%) | 0 (0.0%) |
| All other Fuels | 0 (0.0%) | 32 (2.2%) |
| No Fuel Used | 0 (0.0%) | 0 (0.0%) |
| Total | 2,349 (100.0%) | 1,426 (100.0%) |
Household Vehicle Usage in Matawan borough
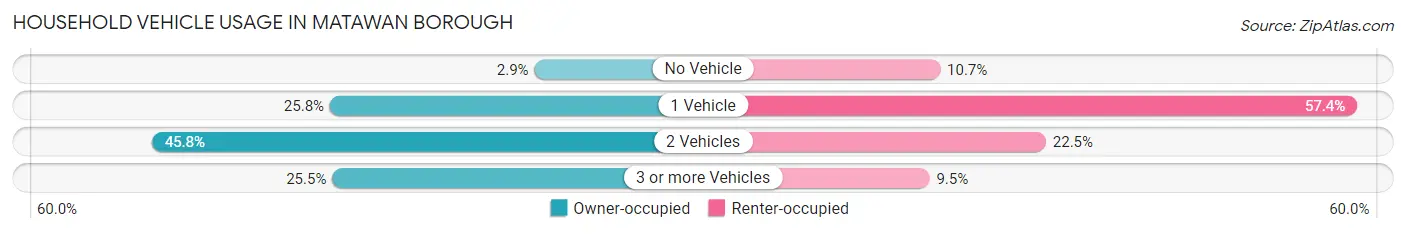
| Vehicles per Household | Owner-occupied | Renter-occupied |
| No Vehicle | 68 (2.9%) | 152 (10.7%) |
| 1 Vehicle | 606 (25.8%) | 818 (57.4%) |
| 2 Vehicles | 1,075 (45.8%) | 321 (22.5%) |
| 3 or more Vehicles | 600 (25.5%) | 135 (9.5%) |
| Total | 2,349 (100.0%) | 1,426 (100.0%) |
Real Estate & Mortgages in Matawan borough
Real Estate and Mortgage Overview in Matawan borough
| Characteristic | Without Mortgage | With Mortgage |
| Housing Units | 661 | 1,688 |
| Median Property Value | $419,000 | $402,500 |
| Median Household Income | $115,120 | $883 |
| Monthly Housing Costs | $1,250 | $668 |
| Real Estate Taxes | $10,001 | $0 |
Property Value by Mortgage Status in Matawan borough
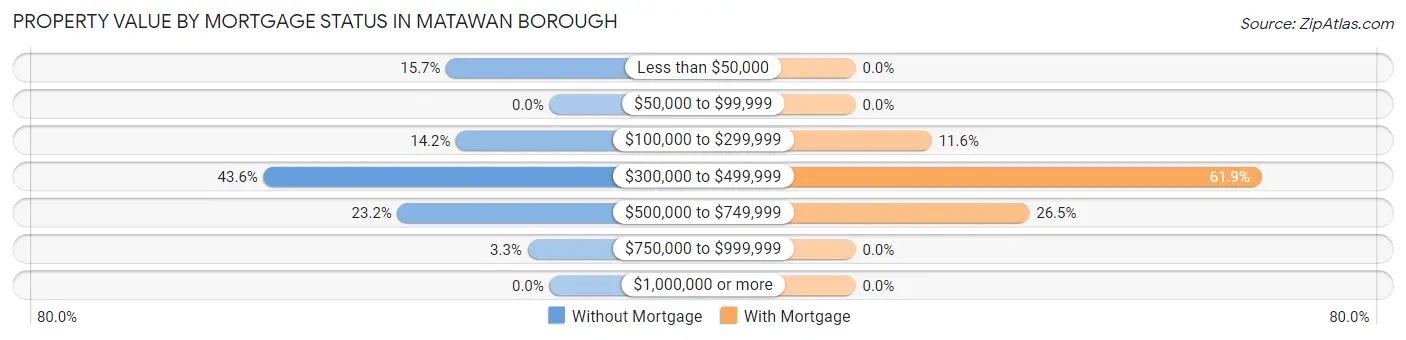
| Property Value | Without Mortgage | With Mortgage |
| Less than $50,000 | 104 (15.7%) | 0 (0.0%) |
| $50,000 to $99,999 | 0 (0.0%) | 0 (0.0%) |
| $100,000 to $299,999 | 94 (14.2%) | 196 (11.6%) |
| $300,000 to $499,999 | 288 (43.6%) | 1,045 (61.9%) |
| $500,000 to $749,999 | 153 (23.2%) | 447 (26.5%) |
| $750,000 to $999,999 | 22 (3.3%) | 0 (0.0%) |
| $1,000,000 or more | 0 (0.0%) | 0 (0.0%) |
| Total | 661 (100.0%) | 1,688 (100.0%) |
Household Income by Mortgage Status in Matawan borough
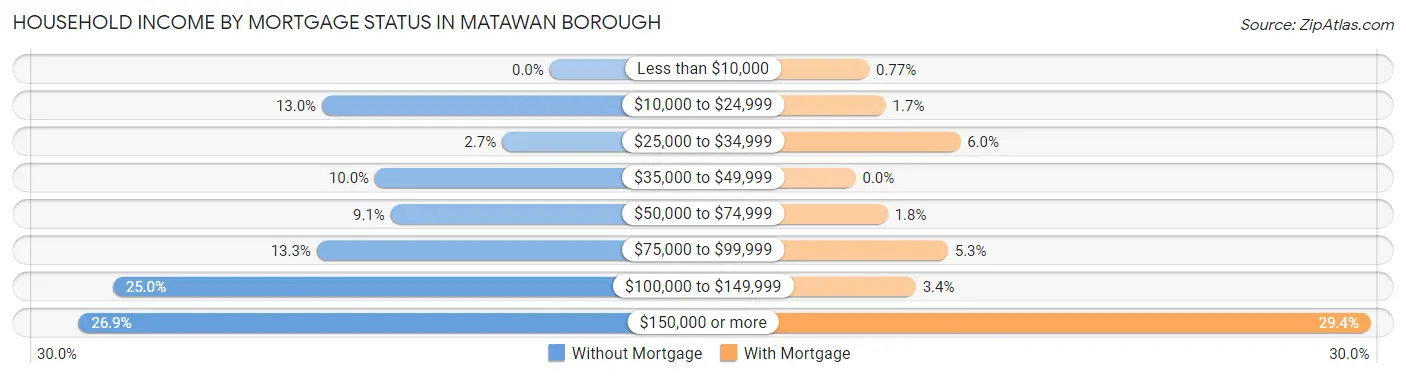
| Household Income | Without Mortgage | With Mortgage |
| Less than $10,000 | 0 (0.0%) | 13 (0.8%) |
| $10,000 to $24,999 | 86 (13.0%) | 29 (1.7%) |
| $25,000 to $34,999 | 18 (2.7%) | 101 (6.0%) |
| $35,000 to $49,999 | 66 (10.0%) | 0 (0.0%) |
| $50,000 to $74,999 | 60 (9.1%) | 31 (1.8%) |
| $75,000 to $99,999 | 88 (13.3%) | 89 (5.3%) |
| $100,000 to $149,999 | 165 (25.0%) | 58 (3.4%) |
| $150,000 or more | 178 (26.9%) | 497 (29.4%) |
| Total | 661 (100.0%) | 1,688 (100.0%) |
Property Value to Household Income Ratio in Matawan borough
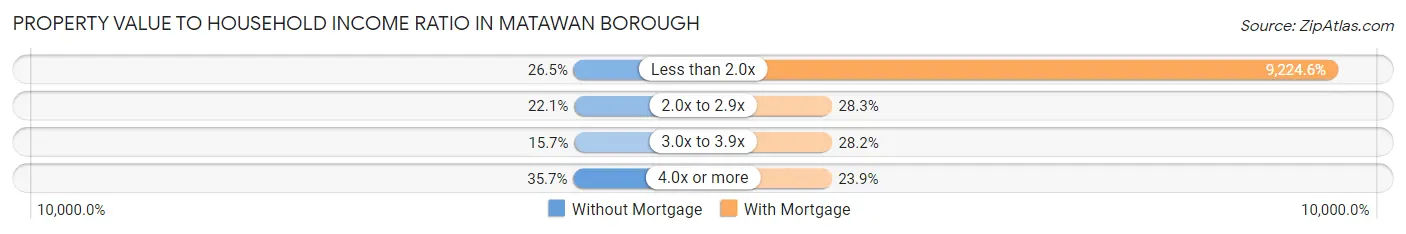
| Value-to-Income Ratio | Without Mortgage | With Mortgage |
| Less than 2.0x | 175 (26.5%) | 155,712 (9,224.6%) |
| 2.0x to 2.9x | 146 (22.1%) | 477 (28.3%) |
| 3.0x to 3.9x | 104 (15.7%) | 476 (28.2%) |
| 4.0x or more | 236 (35.7%) | 404 (23.9%) |
| Total | 661 (100.0%) | 1,688 (100.0%) |
Real Estate Taxes by Mortgage Status in Matawan borough
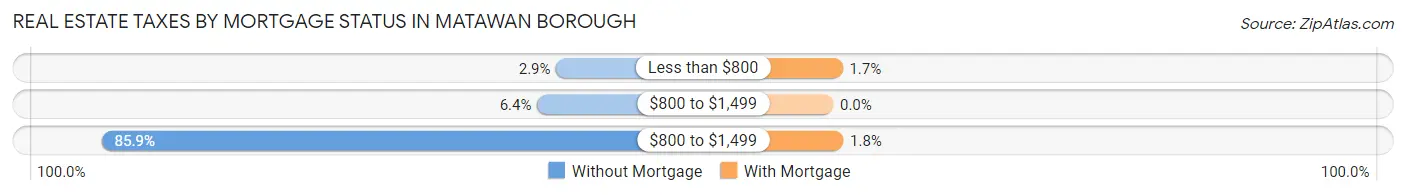
| Property Taxes | Without Mortgage | With Mortgage |
| Less than $800 | 19 (2.9%) | 29 (1.7%) |
| $800 to $1,499 | 42 (6.4%) | 0 (0.0%) |
| $800 to $1,499 | 568 (85.9%) | 31 (1.8%) |
| Total | 661 (100.0%) | 1,688 (100.0%) |
Health & Disability in Matawan borough
Health Insurance Coverage by Age in Matawan borough
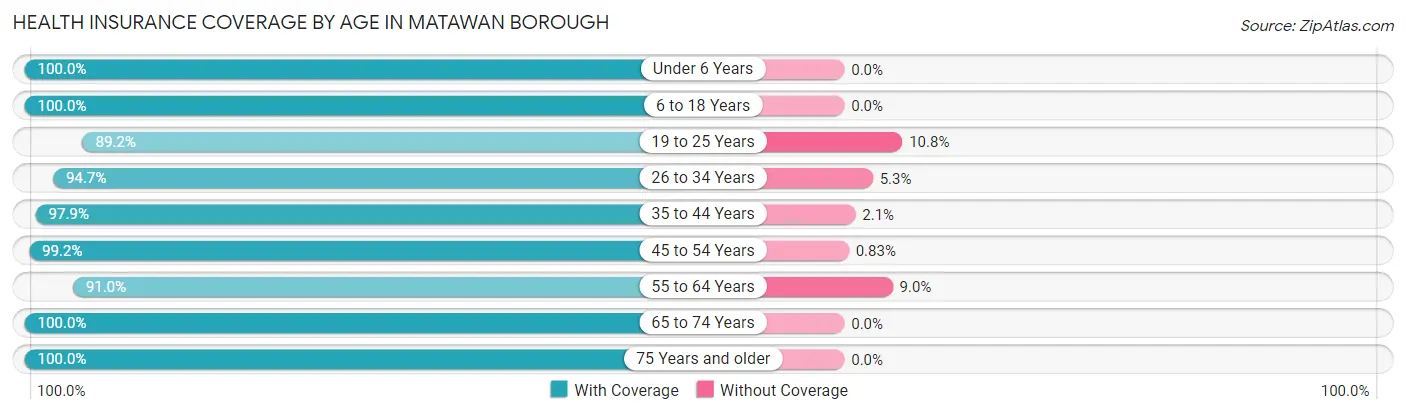
| Age Bracket | With Coverage | Without Coverage |
| Under 6 Years | 785 (100.0%) | 0 (0.0%) |
| 6 to 18 Years | 1,472 (100.0%) | 0 (0.0%) |
| 19 to 25 Years | 363 (89.2%) | 44 (10.8%) |
| 26 to 34 Years | 1,466 (94.7%) | 82 (5.3%) |
| 35 to 44 Years | 1,382 (97.9%) | 29 (2.1%) |
| 45 to 54 Years | 1,307 (99.2%) | 11 (0.8%) |
| 55 to 64 Years | 1,242 (91.0%) | 123 (9.0%) |
| 65 to 74 Years | 734 (100.0%) | 0 (0.0%) |
| 75 Years and older | 419 (100.0%) | 0 (0.0%) |
| Total | 9,170 (96.9%) | 289 (3.1%) |
Health Insurance Coverage by Citizenship Status in Matawan borough
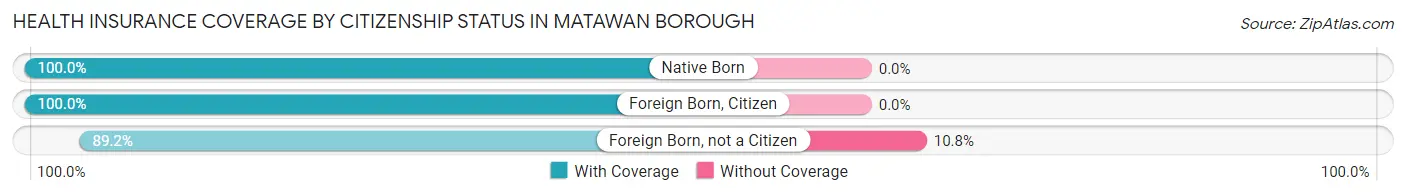
| Citizenship Status | With Coverage | Without Coverage |
| Native Born | 785 (100.0%) | 0 (0.0%) |
| Foreign Born, Citizen | 1,472 (100.0%) | 0 (0.0%) |
| Foreign Born, not a Citizen | 363 (89.2%) | 44 (10.8%) |
Health Insurance Coverage by Household Income in Matawan borough
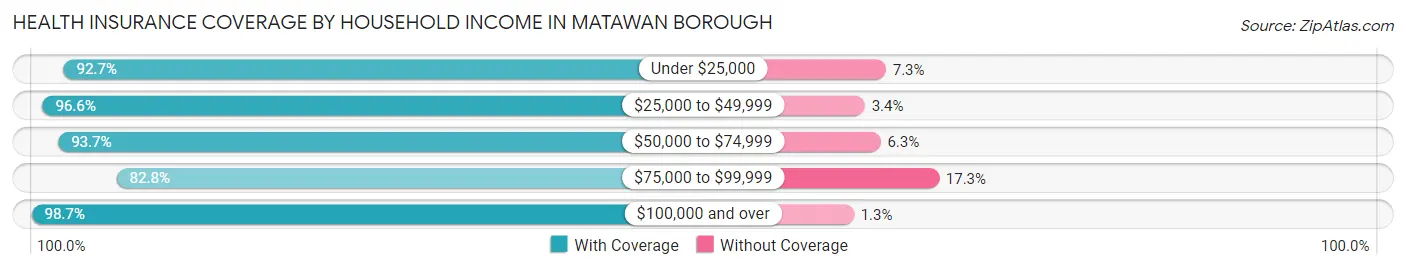
| Household Income | With Coverage | Without Coverage |
| Under $25,000 | 545 (92.7%) | 43 (7.3%) |
| $25,000 to $49,999 | 489 (96.6%) | 17 (3.4%) |
| $50,000 to $74,999 | 727 (93.7%) | 49 (6.3%) |
| $75,000 to $99,999 | 422 (82.8%) | 88 (17.2%) |
| $100,000 and over | 6,982 (98.7%) | 92 (1.3%) |
Public vs Private Health Insurance Coverage by Age in Matawan borough
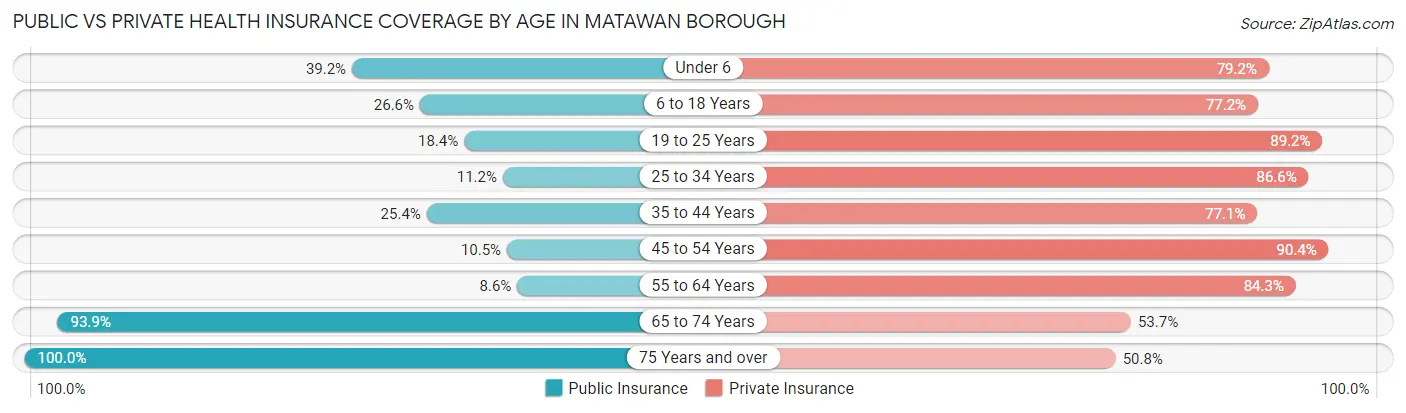
| Age Bracket | Public Insurance | Private Insurance |
| Under 6 | 308 (39.2%) | 622 (79.2%) |
| 6 to 18 Years | 392 (26.6%) | 1,137 (77.2%) |
| 19 to 25 Years | 75 (18.4%) | 363 (89.2%) |
| 25 to 34 Years | 174 (11.2%) | 1,341 (86.6%) |
| 35 to 44 Years | 358 (25.4%) | 1,088 (77.1%) |
| 45 to 54 Years | 138 (10.5%) | 1,191 (90.4%) |
| 55 to 64 Years | 117 (8.6%) | 1,150 (84.3%) |
| 65 to 74 Years | 689 (93.9%) | 394 (53.7%) |
| 75 Years and over | 419 (100.0%) | 213 (50.8%) |
| Total | 2,670 (28.2%) | 7,499 (79.3%) |
Disability Status by Sex by Age in Matawan borough
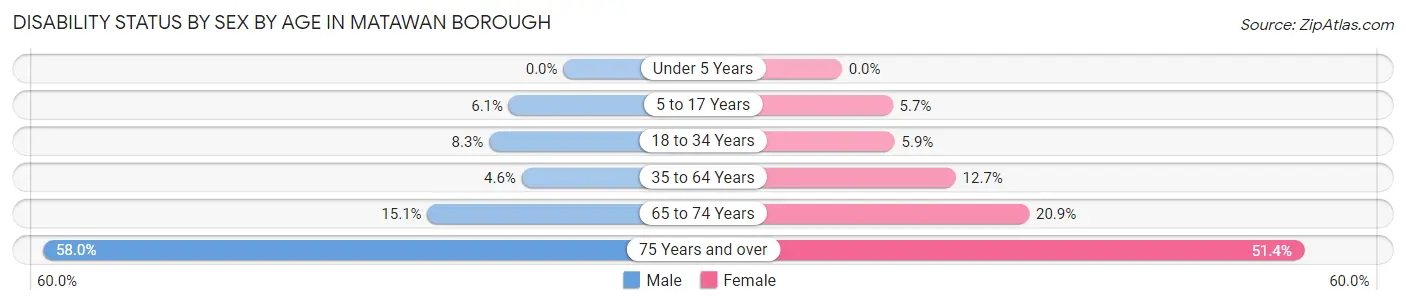
| Age Bracket | Male | Female |
| Under 5 Years | 0 (0.0%) | 0 (0.0%) |
| 5 to 17 Years | 43 (6.1%) | 42 (5.7%) |
| 18 to 34 Years | 101 (8.3%) | 51 (5.9%) |
| 35 to 64 Years | 98 (4.6%) | 251 (12.7%) |
| 65 to 74 Years | 61 (15.1%) | 69 (20.8%) |
| 75 Years and over | 102 (58.0%) | 125 (51.4%) |
Disability Class by Sex by Age in Matawan borough
Disability Class: Hearing Difficulty
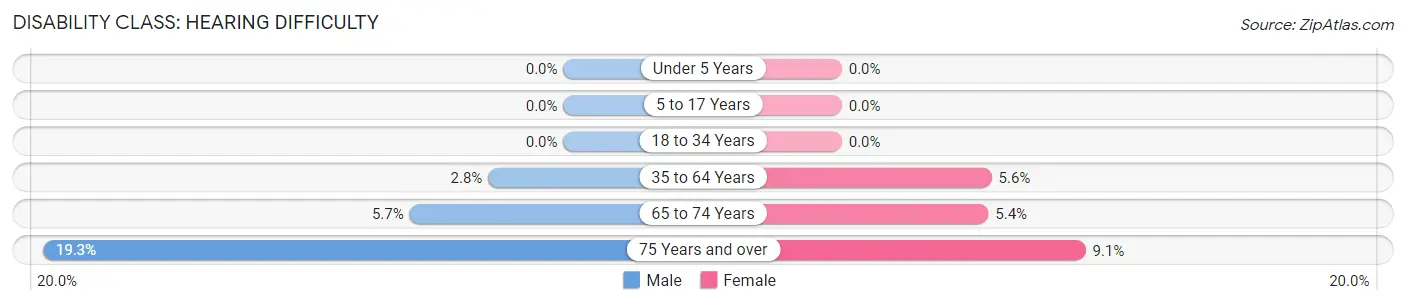
| Age Bracket | Male | Female |
| Under 5 Years | 0 (0.0%) | 0 (0.0%) |
| 5 to 17 Years | 0 (0.0%) | 0 (0.0%) |
| 18 to 34 Years | 0 (0.0%) | 0 (0.0%) |
| 35 to 64 Years | 59 (2.8%) | 110 (5.6%) |
| 65 to 74 Years | 23 (5.7%) | 18 (5.4%) |
| 75 Years and over | 34 (19.3%) | 22 (9.0%) |
Disability Class: Vision Difficulty
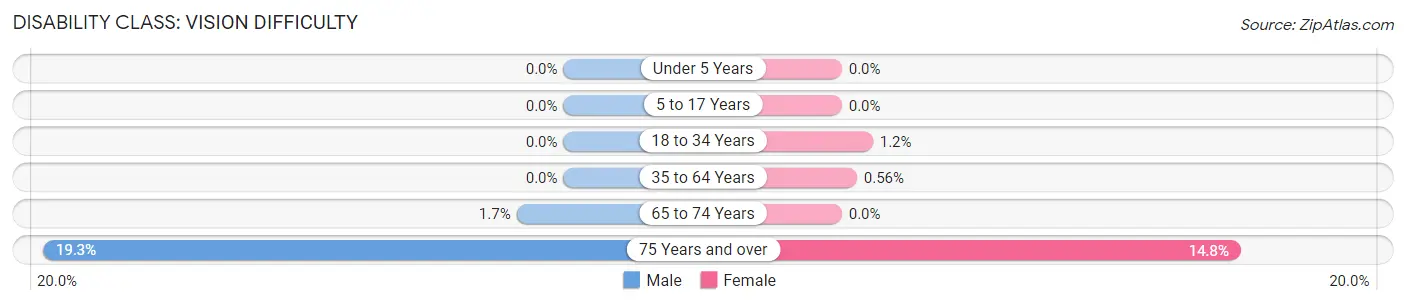
| Age Bracket | Male | Female |
| Under 5 Years | 0 (0.0%) | 0 (0.0%) |
| 5 to 17 Years | 0 (0.0%) | 0 (0.0%) |
| 18 to 34 Years | 0 (0.0%) | 10 (1.1%) |
| 35 to 64 Years | 0 (0.0%) | 11 (0.6%) |
| 65 to 74 Years | 7 (1.7%) | 0 (0.0%) |
| 75 Years and over | 34 (19.3%) | 36 (14.8%) |
Disability Class: Cognitive Difficulty
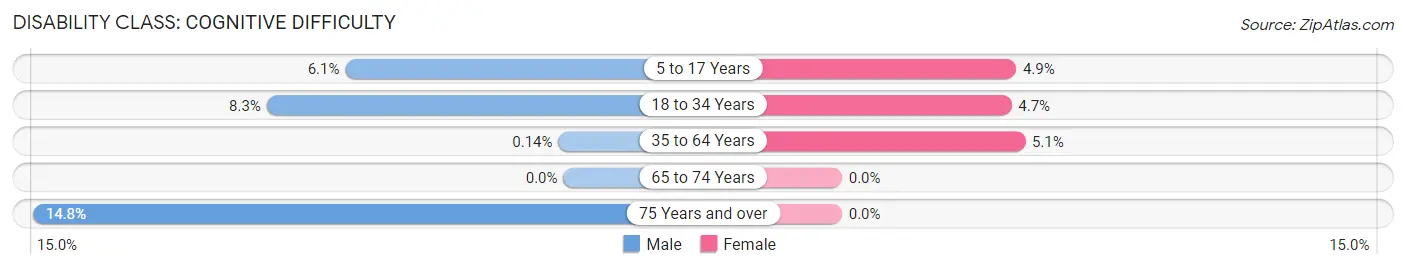
| Age Bracket | Male | Female |
| 5 to 17 Years | 43 (6.1%) | 36 (4.9%) |
| 18 to 34 Years | 101 (8.3%) | 41 (4.7%) |
| 35 to 64 Years | 3 (0.1%) | 101 (5.1%) |
| 65 to 74 Years | 0 (0.0%) | 0 (0.0%) |
| 75 Years and over | 26 (14.8%) | 0 (0.0%) |
Disability Class: Ambulatory Difficulty
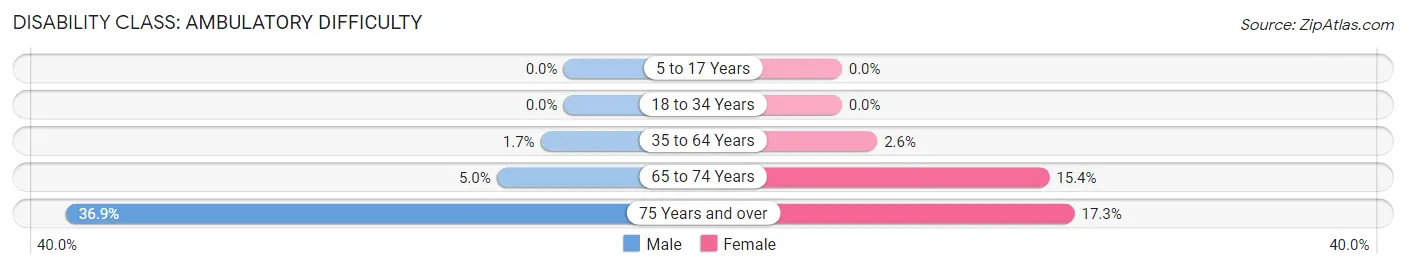
| Age Bracket | Male | Female |
| 5 to 17 Years | 0 (0.0%) | 0 (0.0%) |
| 18 to 34 Years | 0 (0.0%) | 0 (0.0%) |
| 35 to 64 Years | 36 (1.7%) | 52 (2.6%) |
| 65 to 74 Years | 20 (5.0%) | 51 (15.4%) |
| 75 Years and over | 65 (36.9%) | 42 (17.3%) |
Disability Class: Self-Care Difficulty
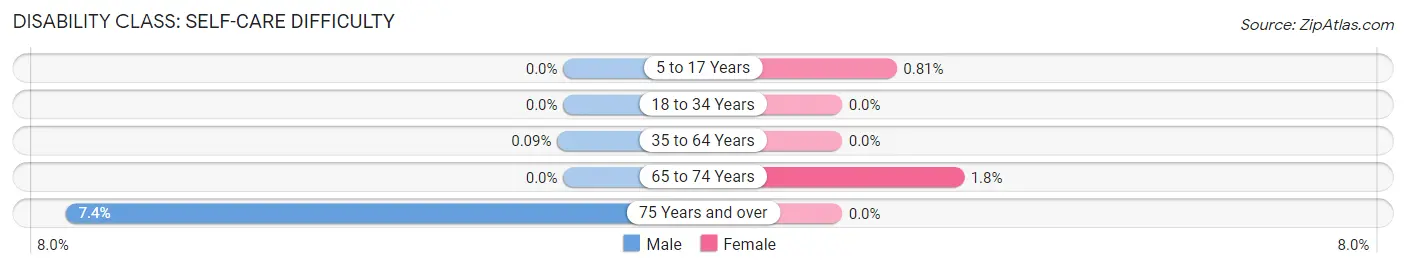
| Age Bracket | Male | Female |
| 5 to 17 Years | 0 (0.0%) | 6 (0.8%) |
| 18 to 34 Years | 0 (0.0%) | 0 (0.0%) |
| 35 to 64 Years | 2 (0.1%) | 0 (0.0%) |
| 65 to 74 Years | 0 (0.0%) | 6 (1.8%) |
| 75 Years and over | 13 (7.4%) | 0 (0.0%) |
Technology Access in Matawan borough
Computing Device Access in Matawan borough
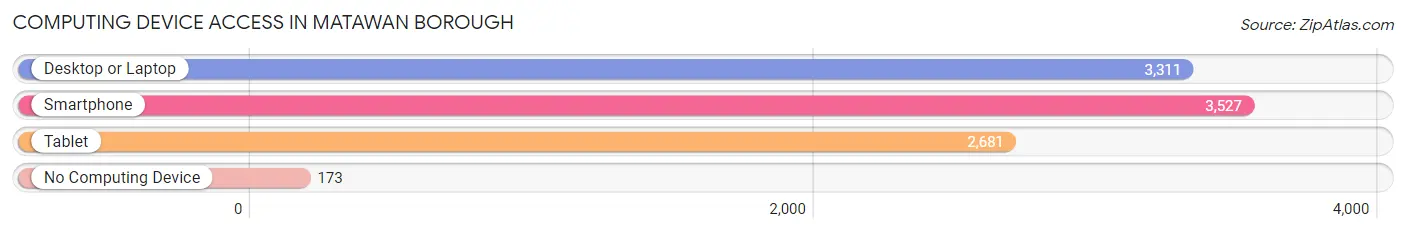
| Device Type | # Households | % Households |
| Desktop or Laptop | 3,311 | 87.7% |
| Smartphone | 3,527 | 93.4% |
| Tablet | 2,681 | 71.0% |
| No Computing Device | 173 | 4.6% |
| Total | 3,775 | 100.0% |
Internet Access in Matawan borough
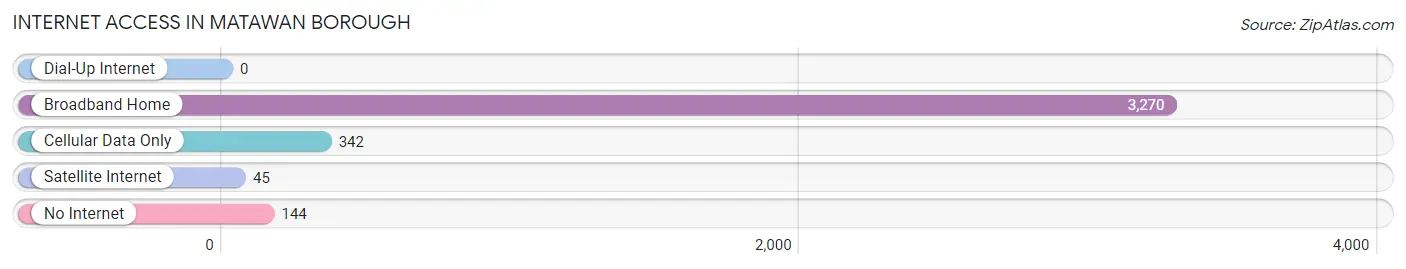
| Internet Type | # Households | % Households |
| Dial-Up Internet | 0 | 0.0% |
| Broadband Home | 3,270 | 86.6% |
| Cellular Data Only | 342 | 9.1% |
| Satellite Internet | 45 | 1.2% |
| No Internet | 144 | 3.8% |
| Total | 3,775 | 100.0% |
Matawan borough Summary
Matawan Borough is a small borough located in Monmouth County, New Jersey. It is situated on the Raritan Bay, and is part of the Bayshore region of the state. The borough is bordered by Aberdeen Township to the north, Old Bridge Township to the east, Marlboro Township to the south, and Keyport to the west. Matawan Borough is home to a population of 8,810 people, according to the 2010 United States Census.
History
Matawan Borough was originally part of the Matawan Township, which was established in 1848. The borough was incorporated in 1895, and was named after the Matawan Creek, which was named after the Lenape word for “where two rivers meet”. The borough was originally a farming community, and was known for its cranberry bogs. In 1916, the Matawan-Aberdeen Railroad was built, connecting the borough to the rest of the state.
In 1916, the Matawan Creek became the site of a series of shark attacks, which were later immortalized in the movie Jaws. The attacks resulted in the deaths of four people, and the capture of a large great white shark. The attacks caused a panic in the area, and led to the closure of the beaches in the area.
Geography
Matawan Borough is located at 40°25'17" North, 74°13'45" West (40.4214, -74.2292). According to the United States Census Bureau, the borough has a total area of 2.2 square miles, all of which is land. The borough is located on the Raritan Bay, and is part of the Bayshore region of the state.
Economy
Matawan Borough has a diverse economy, with a variety of businesses and industries. The borough is home to a number of retail stores, restaurants, and other businesses. The borough is also home to a number of manufacturing and industrial businesses, including a plastics factory, a printing company, and a metal fabrication plant.
Demographics
As of the 2010 United States Census, there were 8,810 people, 3,541 households, and 2,323 families residing in the borough. The population density was 4,037.2 people per square mile. The racial makeup of the borough was 79.2% White, 11.2% African American, 0.3% Native American, 3.2% Asian, 0.1% Pacific Islander, 3.3% from other races, and 2.9% from two or more races. Hispanic or Latino of any race were 8.7% of the population.
The median income for a household in the borough was $71,944, and the median income for a family was $87,917. The per capita income for the borough was $32,945. About 4.2% of families and 5.7% of the population were below the poverty line, including 6.7% of those under age 18 and 5.2% of those age 65 or over.
Common Questions
What is Per Capita Income in Matawan borough?
Per Capita income in Matawan borough is $53,663.
What is the Median Family Income in Matawan borough?
Median Family Income in Matawan borough is $137,179.
What is the Median Household income in Matawan borough?
Median Household Income in Matawan borough is $125,040.
What is Income or Wage Gap in Matawan borough?
Income or Wage Gap in Matawan borough is 24.6%.
Women in Matawan borough earn 75.4 cents for every dollar earned by a man.
What is Inequality or Gini Index in Matawan borough?
Inequality or Gini Index in Matawan borough is 0.38.
What is the Total Population of Matawan borough?
Total Population of Matawan borough is 9,546.
What is the Total Male Population of Matawan borough?
Total Male Population of Matawan borough is 5,081.
What is the Total Female Population of Matawan borough?
Total Female Population of Matawan borough is 4,465.
What is the Ratio of Males per 100 Females in Matawan borough?
There are 113.80 Males per 100 Females in Matawan borough.
What is the Ratio of Females per 100 Males in Matawan borough?
There are 87.88 Females per 100 Males in Matawan borough.
What is the Median Population Age in Matawan borough?
Median Population Age in Matawan borough is 38.0 Years.
What is the Average Family Size in Matawan borough
Average Family Size in Matawan borough is 3.2 People.
What is the Average Household Size in Matawan borough
Average Household Size in Matawan borough is 2.5 People.
How Large is the Labor Force in Matawan borough?
There are 5,716 People in the Labor Forcein in Matawan borough.
What is the Percentage of People in the Labor Force in Matawan borough?
75.0% of People are in the Labor Force in Matawan borough.
What is the Unemployment Rate in Matawan borough?
Unemployment Rate in Matawan borough is 4.3%.