Belford, NJ Map & Demographics
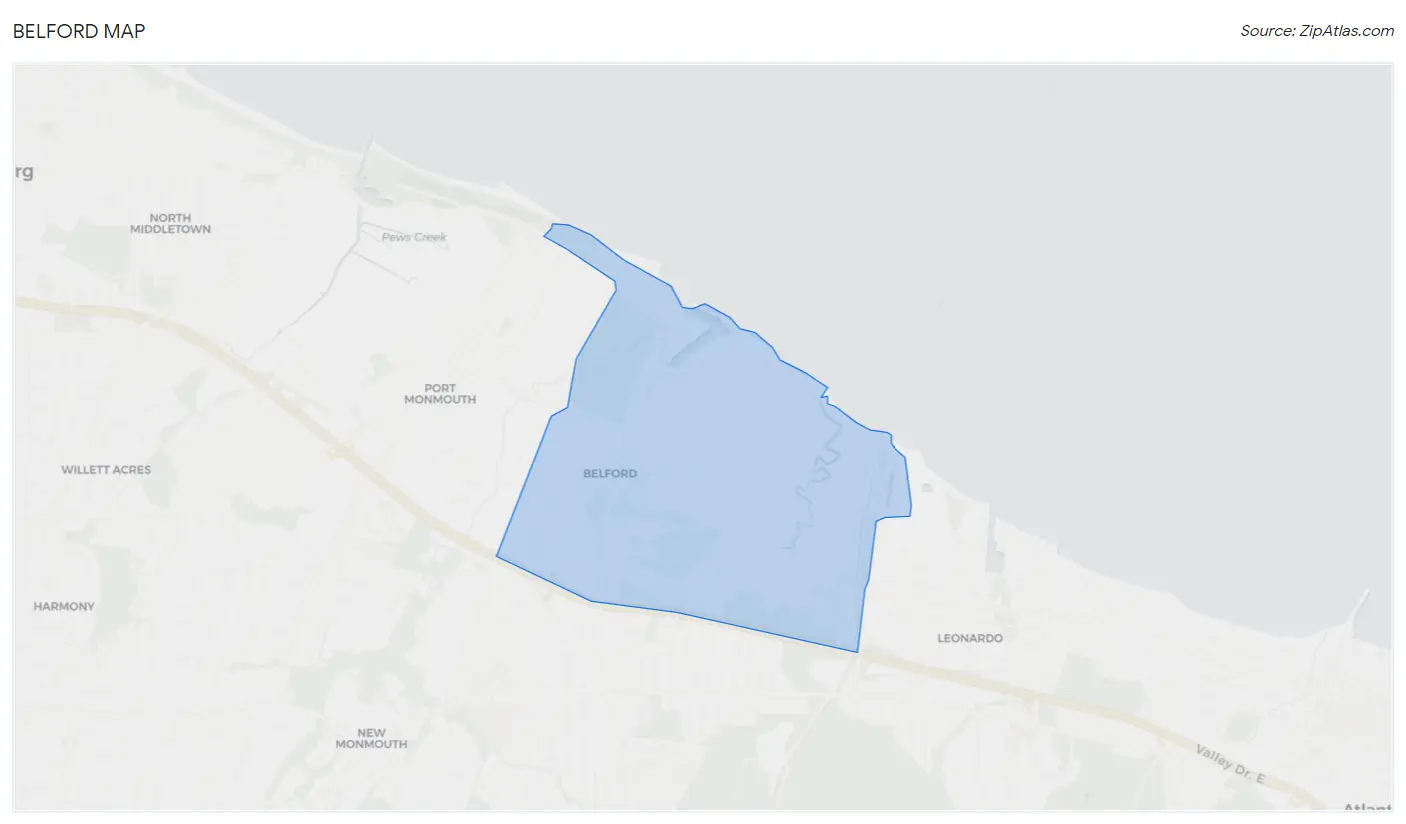
Belford Map
Belford Overview
$57,367
PER CAPITA INCOME
$136,111
AVG FAMILY INCOME
$131,875
AVG HOUSEHOLD INCOME
26.1%
WAGE / INCOME GAP [ % ]
73.9¢/ $1
WAGE / INCOME GAP [ $ ]
0.39
INEQUALITY / GINI INDEX
1,935
TOTAL POPULATION
1,059
MALE POPULATION
876
FEMALE POPULATION
120.89
MALES / 100 FEMALES
82.72
FEMALES / 100 MALES
39.0
MEDIAN AGE
3.5
AVG FAMILY SIZE
3.0
AVG HOUSEHOLD SIZE
949
LABOR FORCE [ PEOPLE ]
65.6%
PERCENT IN LABOR FORCE
9.0%
UNEMPLOYMENT RATE
Belford Zip Codes
Income in Belford
Income Overview in Belford
Per Capita Income in Belford is $57,367, while median incomes of families and households are $136,111 and $131,875 respectively.
| Characteristic | Number | Measure |
| Per Capita Income | 1,935 | $57,367 |
| Median Family Income | 468 | $136,111 |
| Mean Family Income | 468 | $173,087 |
| Median Household Income | 636 | $131,875 |
| Mean Household Income | 636 | $170,979 |
| Income Deficit | 468 | $0 |
| Wage / Income Gap (%) | 1,935 | 26.13% |
| Wage / Income Gap ($) | 1,935 | 73.87¢ per $1 |
| Gini / Inequality Index | 1,935 | 0.39 |
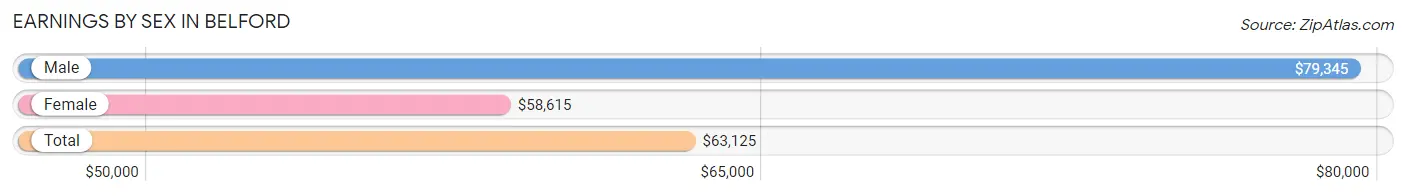
Earnings by Sex in Belford
Average Earnings in Belford are $63,125, $79,345 for men and $58,615 for women, a difference of 26.1%.
| Sex | Number | Average Earnings |
| Male | 519 (54.8%) | $79,345 |
| Female | 428 (45.2%) | $58,615 |
| Total | 947 (100.0%) | $63,125 |
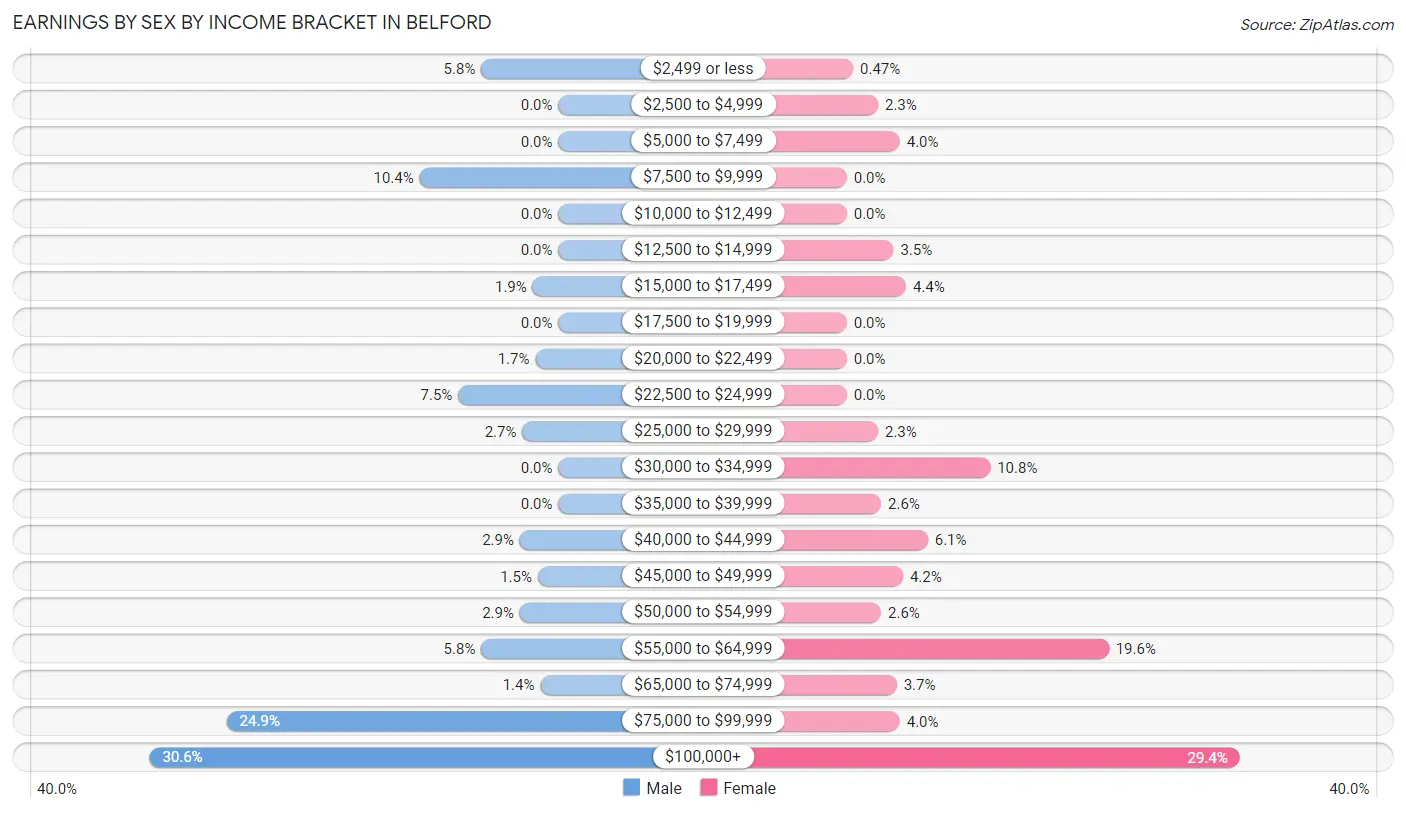
Earnings by Sex by Income Bracket in Belford
The most common earnings brackets in Belford are $100,000+ for men (159 | 30.6%) and $100,000+ for women (126 | 29.4%).
| Income | Male | Female |
| $2,499 or less | 30 (5.8%) | 2 (0.5%) |
| $2,500 to $4,999 | 0 (0.0%) | 10 (2.3%) |
| $5,000 to $7,499 | 0 (0.0%) | 17 (4.0%) |
| $7,500 to $9,999 | 54 (10.4%) | 0 (0.0%) |
| $10,000 to $12,499 | 0 (0.0%) | 0 (0.0%) |
| $12,500 to $14,999 | 0 (0.0%) | 15 (3.5%) |
| $15,000 to $17,499 | 10 (1.9%) | 19 (4.4%) |
| $17,500 to $19,999 | 0 (0.0%) | 0 (0.0%) |
| $20,000 to $22,499 | 9 (1.7%) | 0 (0.0%) |
| $22,500 to $24,999 | 39 (7.5%) | 0 (0.0%) |
| $25,000 to $29,999 | 14 (2.7%) | 10 (2.3%) |
| $30,000 to $34,999 | 0 (0.0%) | 46 (10.7%) |
| $35,000 to $39,999 | 0 (0.0%) | 11 (2.6%) |
| $40,000 to $44,999 | 15 (2.9%) | 26 (6.1%) |
| $45,000 to $49,999 | 8 (1.5%) | 18 (4.2%) |
| $50,000 to $54,999 | 15 (2.9%) | 11 (2.6%) |
| $55,000 to $64,999 | 30 (5.8%) | 84 (19.6%) |
| $65,000 to $74,999 | 7 (1.3%) | 16 (3.7%) |
| $75,000 to $99,999 | 129 (24.9%) | 17 (4.0%) |
| $100,000+ | 159 (30.6%) | 126 (29.4%) |
| Total | 519 (100.0%) | 428 (100.0%) |
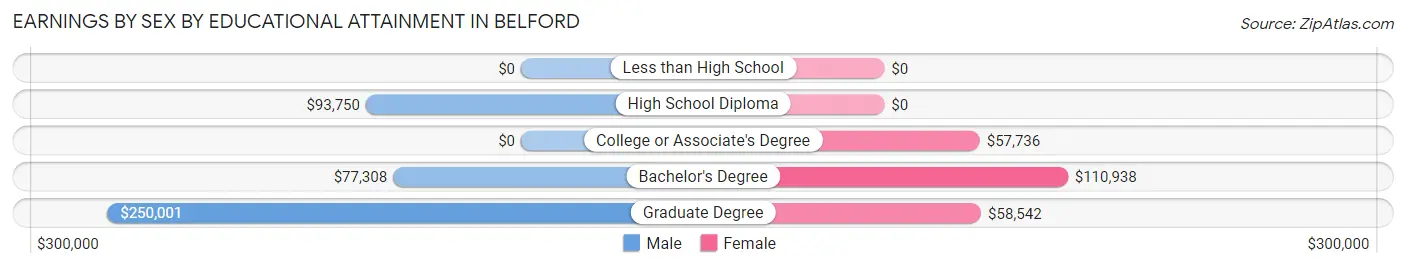
Earnings by Sex by Educational Attainment in Belford
Average earnings in Belford are $88,375 for men and $58,615 for women, a difference of 33.7%. Men with an educational attainment of graduate degree enjoy the highest average annual earnings of $250,001, while those with bachelor's degree education earn the least with $77,308. Women with an educational attainment of bachelor's degree earn the most with the average annual earnings of $110,938, while those with college or associate's degree education have the smallest earnings of $57,736.
| Educational Attainment | Male Income | Female Income |
| Less than High School | - | - |
| High School Diploma | $93,750 | $0 |
| College or Associate's Degree | - | - |
| Bachelor's Degree | $77,308 | $110,938 |
| Graduate Degree | $250,001 | $58,542 |
| Total | $88,375 | $58,615 |
Family Income in Belford
Family Income Brackets in Belford
According to the Belford family income data, there are 169 families falling into the $200,000+ income range, which is the most common income bracket and makes up 36.1% of all families.
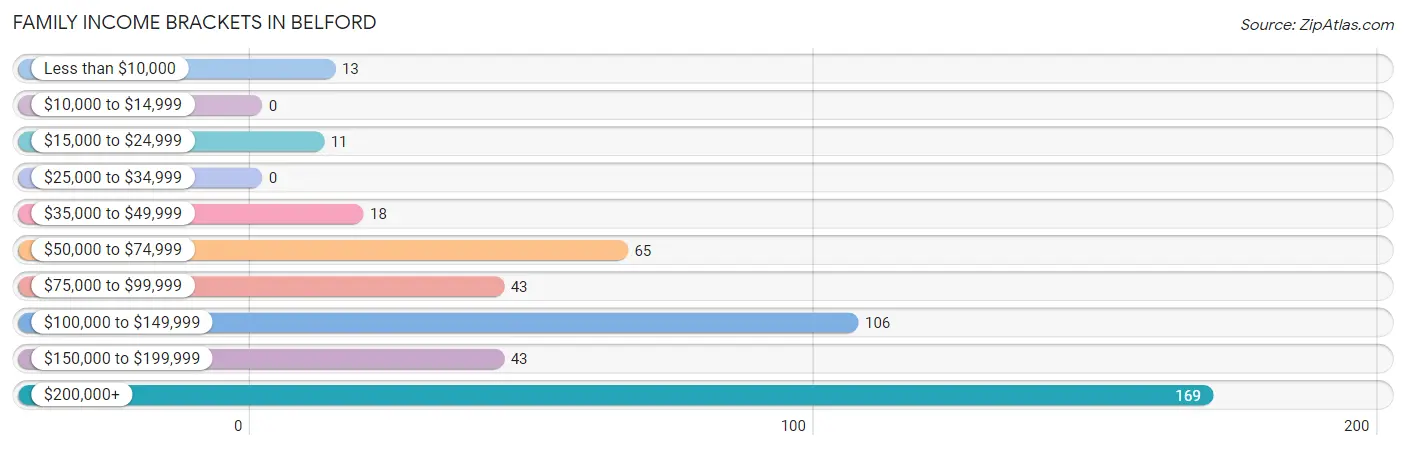
| Income Bracket | # Families | % Families |
| Less than $10,000 | 13 | 2.8% |
| $10,000 to $14,999 | 0 | 0.0% |
| $15,000 to $24,999 | 11 | 2.4% |
| $25,000 to $34,999 | 0 | 0.0% |
| $35,000 to $49,999 | 18 | 3.8% |
| $50,000 to $74,999 | 65 | 13.9% |
| $75,000 to $99,999 | 43 | 9.2% |
| $100,000 to $149,999 | 106 | 22.6% |
| $150,000 to $199,999 | 43 | 9.2% |
| $200,000+ | 169 | 36.1% |
Family Income by Famaliy Size in Belford
4-person families (145 | 31.0%) account for the highest median family income in Belford with $245,536 per family, while 4-person families (145 | 31.0%) have the highest median income of $61,384 per family member.
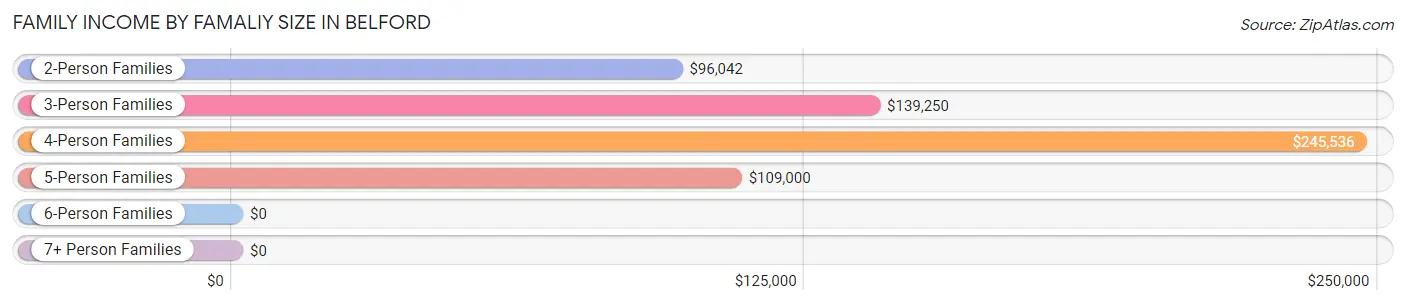
| Income Bracket | # Families | Median Income |
| 2-Person Families | 188 (40.2%) | $96,042 |
| 3-Person Families | 66 (14.1%) | $139,250 |
| 4-Person Families | 145 (31.0%) | $245,536 |
| 5-Person Families | 28 (6.0%) | $109,000 |
| 6-Person Families | 0 (0.0%) | $0 |
| 7+ Person Families | 41 (8.8%) | $0 |
| Total | 468 (100.0%) | $136,111 |
Family Income by Number of Earners in Belford
The median family income in Belford is $136,111, with families comprising 3+ earners (80) having the highest median family income of $247,143, while families with no earners (29) have the lowest median family income of $53,875, accounting for 17.1% and 6.2% of families, respectively.
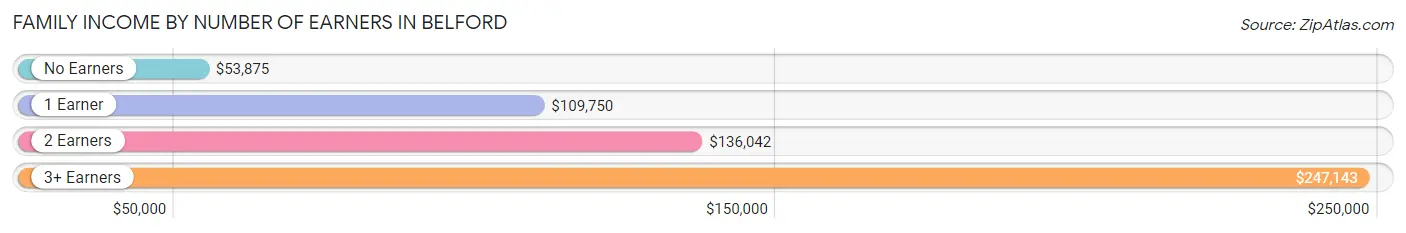
| Number of Earners | # Families | Median Income |
| No Earners | 29 (6.2%) | $53,875 |
| 1 Earner | 148 (31.6%) | $109,750 |
| 2 Earners | 211 (45.1%) | $136,042 |
| 3+ Earners | 80 (17.1%) | $247,143 |
| Total | 468 (100.0%) | $136,111 |
Household Income in Belford
Household Income Brackets in Belford
With 232 households falling in the category, the $200,000+ income range is the most frequent in Belford, accounting for 36.5% of all households.
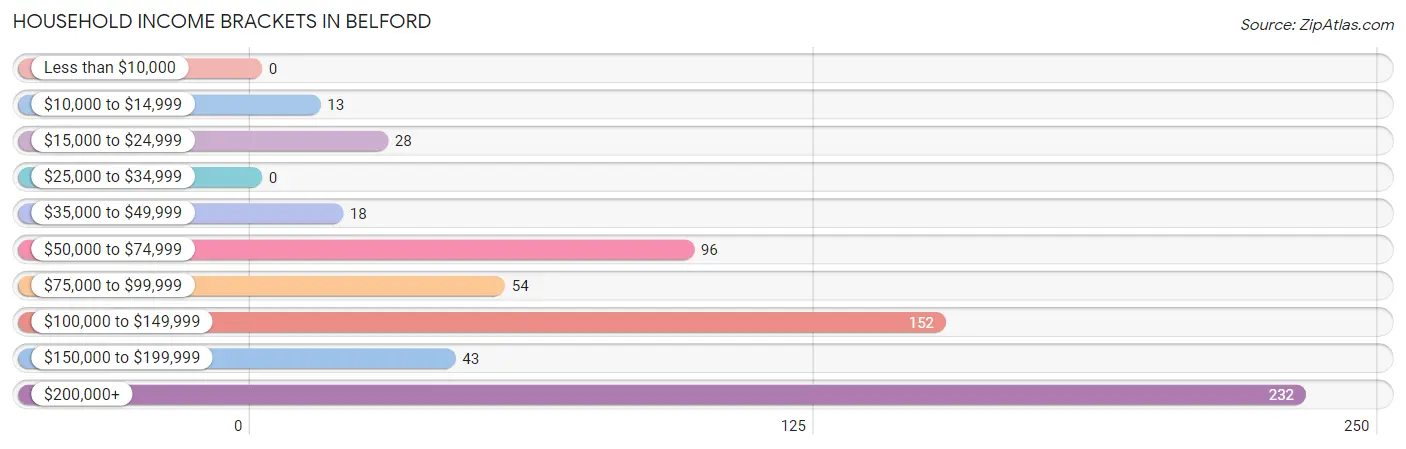
| Income Bracket | # Households | % Households |
| Less than $10,000 | 0 | 0.0% |
| $10,000 to $14,999 | 13 | 2.0% |
| $15,000 to $24,999 | 28 | 4.4% |
| $25,000 to $34,999 | 0 | 0.0% |
| $35,000 to $49,999 | 18 | 2.8% |
| $50,000 to $74,999 | 96 | 15.1% |
| $75,000 to $99,999 | 54 | 8.5% |
| $100,000 to $149,999 | 152 | 23.9% |
| $150,000 to $199,999 | 43 | 6.8% |
| $200,000+ | 232 | 36.5% |
Household Income by Householder Age in Belford
The median household income in Belford is $131,875, with the highest median household income of $208,814 found in the 45 to 64 years age bracket for the primary householder. A total of 323 households (50.8%) fall into this category.
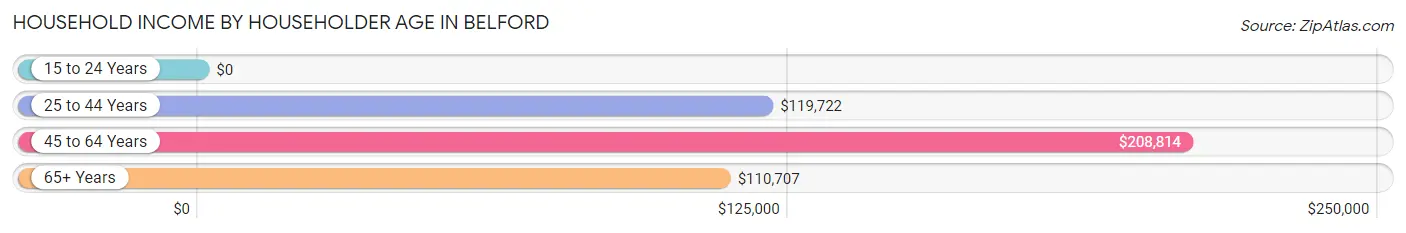
| Income Bracket | # Households | Median Income |
| 15 to 24 Years | 0 (0.0%) | $0 |
| 25 to 44 Years | 168 (26.4%) | $119,722 |
| 45 to 64 Years | 323 (50.8%) | $208,814 |
| 65+ Years | 145 (22.8%) | $110,707 |
| Total | 636 (100.0%) | $131,875 |
Poverty in Belford
Income Below Poverty by Sex and Age in Belford
With 6.0% poverty level for males and 9.4% for females among the residents of Belford, 15 year old males and 18 to 24 year old females are the most vulnerable to poverty, with 13 males (46.4%) and 15 females (100.0%) in their respective age groups living below the poverty level.
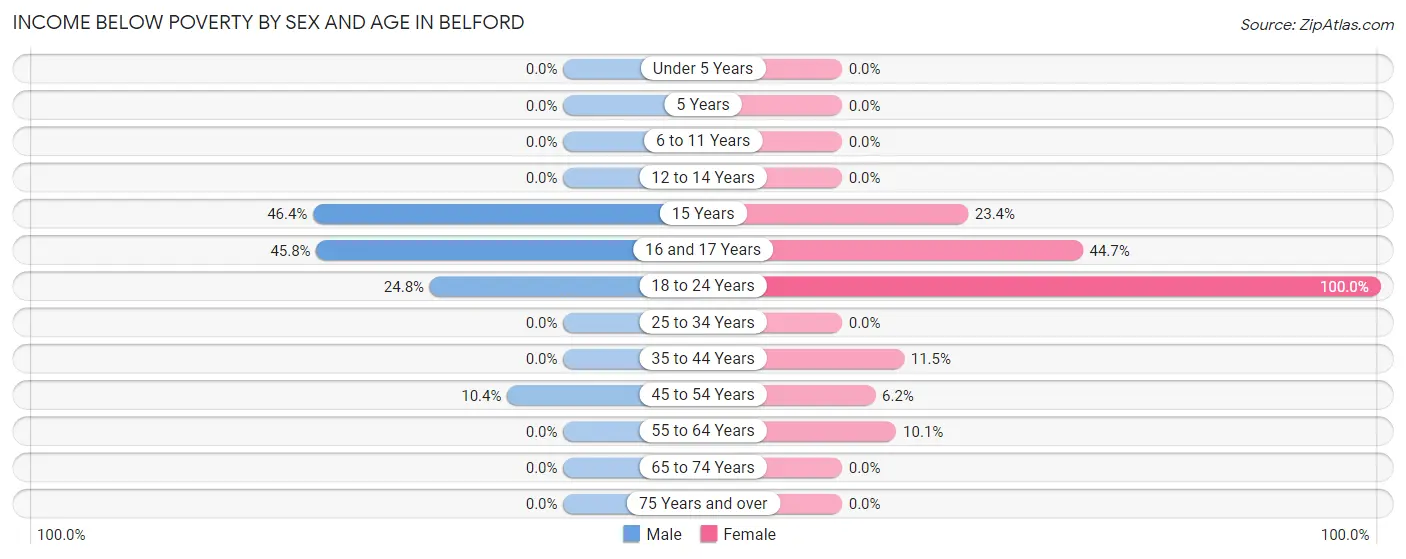
| Age Bracket | Male | Female |
| Under 5 Years | 0 (0.0%) | 0 (0.0%) |
| 5 Years | 0 (0.0%) | 0 (0.0%) |
| 6 to 11 Years | 0 (0.0%) | 0 (0.0%) |
| 12 to 14 Years | 0 (0.0%) | 0 (0.0%) |
| 15 Years | 13 (46.4%) | 11 (23.4%) |
| 16 and 17 Years | 11 (45.8%) | 21 (44.7%) |
| 18 to 24 Years | 27 (24.8%) | 15 (100.0%) |
| 25 to 34 Years | 0 (0.0%) | 0 (0.0%) |
| 35 to 44 Years | 0 (0.0%) | 13 (11.5%) |
| 45 to 54 Years | 13 (10.4%) | 11 (6.2%) |
| 55 to 64 Years | 0 (0.0%) | 11 (10.1%) |
| 65 to 74 Years | 0 (0.0%) | 0 (0.0%) |
| 75 Years and over | 0 (0.0%) | 0 (0.0%) |
| Total | 64 (6.0%) | 82 (9.4%) |
Income Above Poverty by Sex and Age in Belford
According to the poverty statistics in Belford, males aged under 5 years and females aged under 5 years are the age groups that are most secure financially, with 100.0% of males and 100.0% of females in these age groups living above the poverty line.
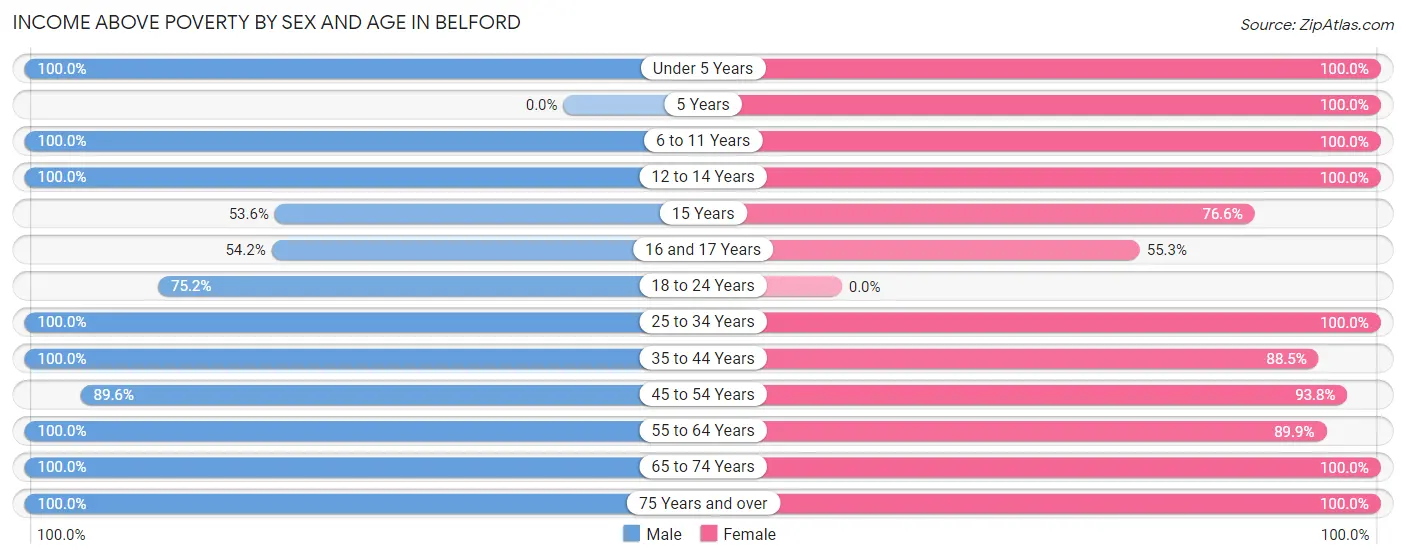
| Age Bracket | Male | Female |
| Under 5 Years | 162 (100.0%) | 36 (100.0%) |
| 5 Years | 0 (0.0%) | 4 (100.0%) |
| 6 to 11 Years | 85 (100.0%) | 47 (100.0%) |
| 12 to 14 Years | 62 (100.0%) | 18 (100.0%) |
| 15 Years | 15 (53.6%) | 36 (76.6%) |
| 16 and 17 Years | 13 (54.2%) | 26 (55.3%) |
| 18 to 24 Years | 82 (75.2%) | 0 (0.0%) |
| 25 to 34 Years | 78 (100.0%) | 116 (100.0%) |
| 35 to 44 Years | 176 (100.0%) | 100 (88.5%) |
| 45 to 54 Years | 112 (89.6%) | 167 (93.8%) |
| 55 to 64 Years | 135 (100.0%) | 98 (89.9%) |
| 65 to 74 Years | 24 (100.0%) | 114 (100.0%) |
| 75 Years and over | 51 (100.0%) | 32 (100.0%) |
| Total | 995 (94.0%) | 794 (90.6%) |
Income Below Poverty Among Married-Couple Families in Belford
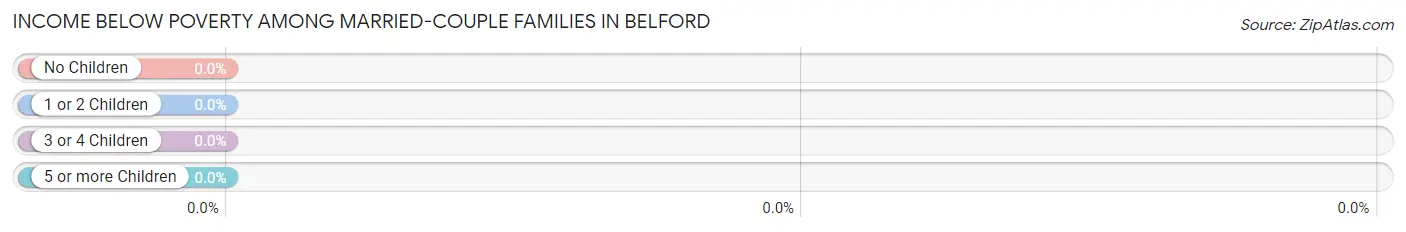
| Children | Above Poverty | Below Poverty |
| No Children | 162 (100.0%) | 0 (0.0%) |
| 1 or 2 Children | 164 (100.0%) | 0 (0.0%) |
| 3 or 4 Children | 20 (100.0%) | 0 (0.0%) |
| 5 or more Children | 39 (100.0%) | 0 (0.0%) |
| Total | 385 (100.0%) | 0 (0.0%) |
Income Below Poverty Among Single-Parent Households in Belford
According to the poverty data in Belford, 24.1% or 13 single-father households and 37.9% or 11 single-mother households are living below the poverty line. Among single-father households, those with 1 or 2 children have the highest poverty rate, with 13 households (100.0%) experiencing poverty. Likewise, among single-mother households, those with no children have the highest poverty rate, with 11 households (37.9%) falling below the poverty line.
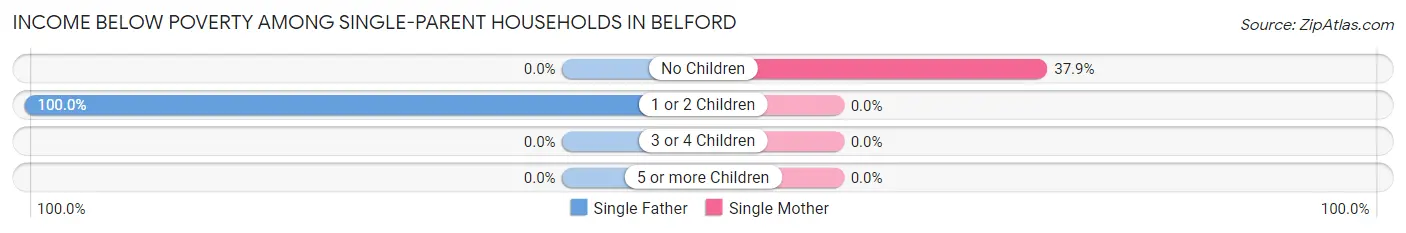
| Children | Single Father | Single Mother |
| No Children | 0 (0.0%) | 11 (37.9%) |
| 1 or 2 Children | 13 (100.0%) | 0 (0.0%) |
| 3 or 4 Children | 0 (0.0%) | 0 (0.0%) |
| 5 or more Children | 0 (0.0%) | 0 (0.0%) |
| Total | 13 (24.1%) | 11 (37.9%) |
Income Below Poverty Among Married-Couple vs Single-Parent Households in Belford
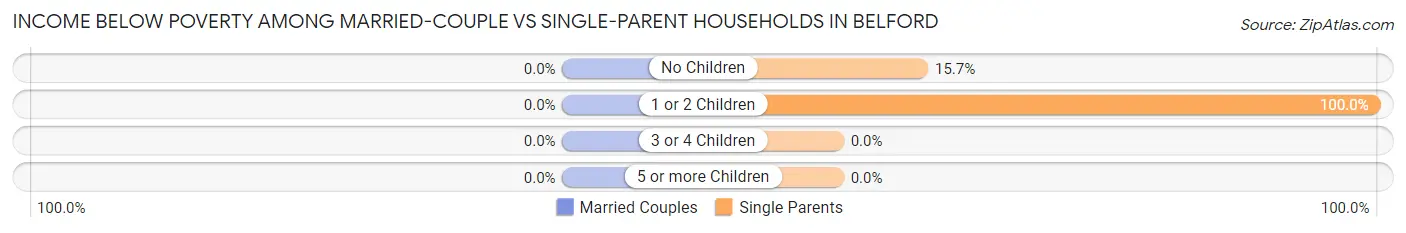
| Children | Married-Couple Families | Single-Parent Households |
| No Children | 0 (0.0%) | 11 (15.7%) |
| 1 or 2 Children | 0 (0.0%) | 13 (100.0%) |
| 3 or 4 Children | 0 (0.0%) | 0 (0.0%) |
| 5 or more Children | 0 (0.0%) | 0 (0.0%) |
| Total | 0 (0.0%) | 24 (28.9%) |
Race in Belford
The most populous races in Belford are White / Caucasian (1,640 | 84.8%), Two or more Races (274 | 14.2%), and Hispanic or Latino (194 | 10.0%).
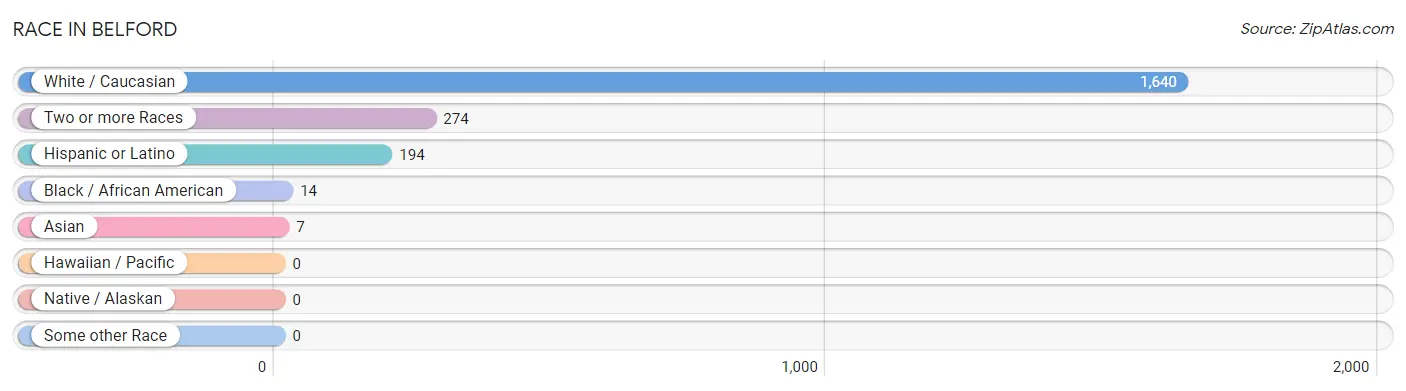
| Race | # Population | % Population |
| Asian | 7 | 0.4% |
| Black / African American | 14 | 0.7% |
| Hawaiian / Pacific | 0 | 0.0% |
| Hispanic or Latino | 194 | 10.0% |
| Native / Alaskan | 0 | 0.0% |
| White / Caucasian | 1,640 | 84.8% |
| Two or more Races | 274 | 14.2% |
| Some other Race | 0 | 0.0% |
| Total | 1,935 | 100.0% |
Ancestry in Belford
The most populous ancestries reported in Belford are Irish (807 | 41.7%), German (538 | 27.8%), Italian (310 | 16.0%), Polish (267 | 13.8%), and English (196 | 10.1%), together accounting for 109.5% of all Belford residents.
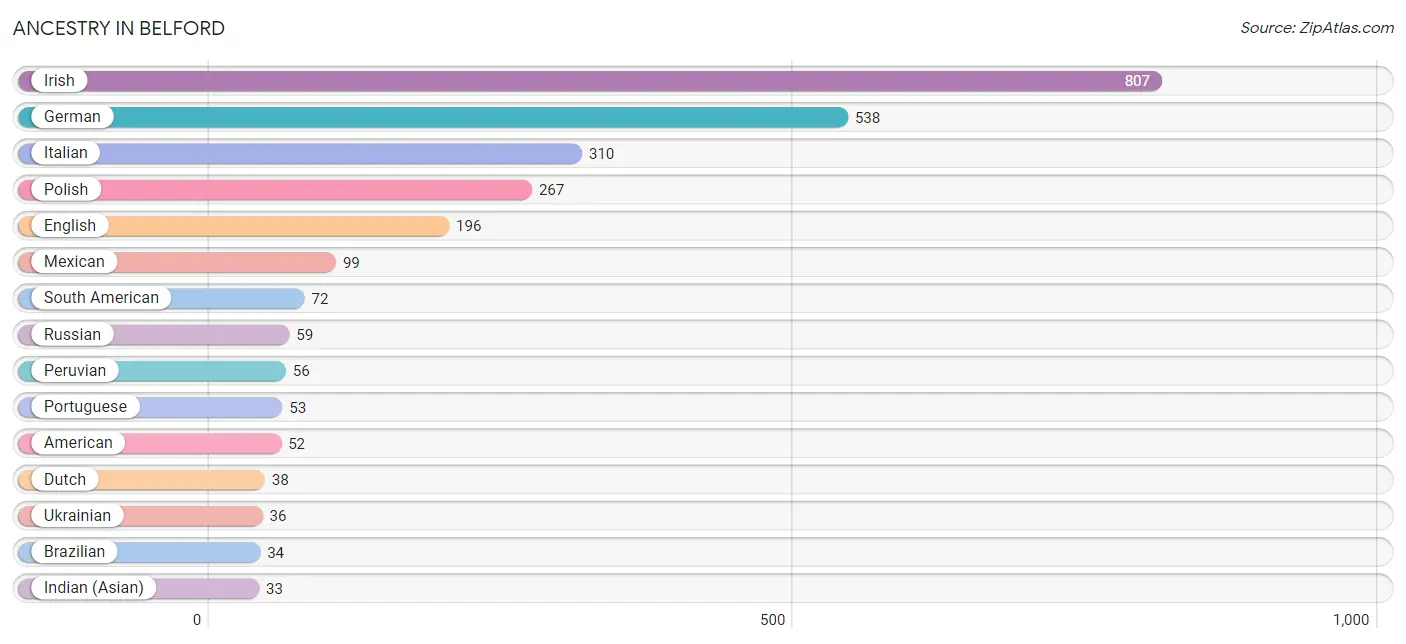
| Ancestry | # Population | % Population |
| American | 52 | 2.7% |
| Apache | 14 | 0.7% |
| Arab | 7 | 0.4% |
| Brazilian | 34 | 1.8% |
| Burmese | 24 | 1.2% |
| Cambodian | 14 | 0.7% |
| Croatian | 8 | 0.4% |
| Delaware | 14 | 0.7% |
| Dutch | 38 | 2.0% |
| Ecuadorian | 16 | 0.8% |
| Egyptian | 7 | 0.4% |
| English | 196 | 10.1% |
| European | 23 | 1.2% |
| French | 32 | 1.7% |
| German | 538 | 27.8% |
| Hungarian | 13 | 0.7% |
| Indian (Asian) | 33 | 1.7% |
| Irish | 807 | 41.7% |
| Italian | 310 | 16.0% |
| Korean | 19 | 1.0% |
| Mexican | 99 | 5.1% |
| Norwegian | 19 | 1.0% |
| Peruvian | 56 | 2.9% |
| Polish | 267 | 13.8% |
| Portuguese | 53 | 2.7% |
| Puerto Rican | 9 | 0.5% |
| Russian | 59 | 3.0% |
| Scottish | 19 | 1.0% |
| South American | 72 | 3.7% |
| Spaniard | 14 | 0.7% |
| Thai | 8 | 0.4% |
| Ukrainian | 36 | 1.9% | View All 32 Rows |
Immigrants in Belford
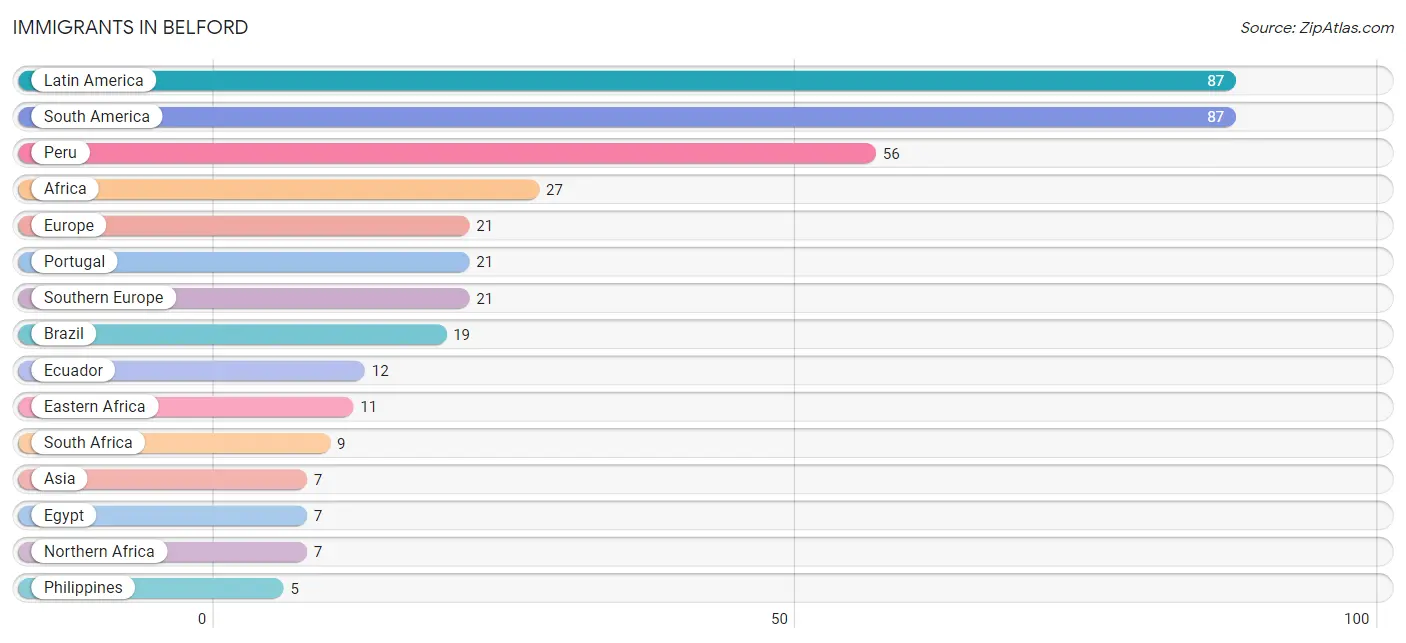
The most numerous immigrant groups reported in Belford came from Latin America (87 | 4.5%), South America (87 | 4.5%), Peru (56 | 2.9%), Africa (27 | 1.4%), and Europe (21 | 1.1%), together accounting for 14.4% of all Belford residents.
| Immigration Origin | # Population | % Population |
| Africa | 27 | 1.4% |
| Asia | 7 | 0.4% |
| Brazil | 19 | 1.0% |
| Eastern Africa | 11 | 0.6% |
| Eastern Asia | 2 | 0.1% |
| Ecuador | 12 | 0.6% |
| Egypt | 7 | 0.4% |
| Europe | 21 | 1.1% |
| Korea | 2 | 0.1% |
| Latin America | 87 | 4.5% |
| Northern Africa | 7 | 0.4% |
| Peru | 56 | 2.9% |
| Philippines | 5 | 0.3% |
| Portugal | 21 | 1.1% |
| South Africa | 9 | 0.5% |
| South America | 87 | 4.5% |
| South Eastern Asia | 5 | 0.3% |
| Southern Europe | 21 | 1.1% | View All 18 Rows |
Sex and Age in Belford
Sex and Age in Belford
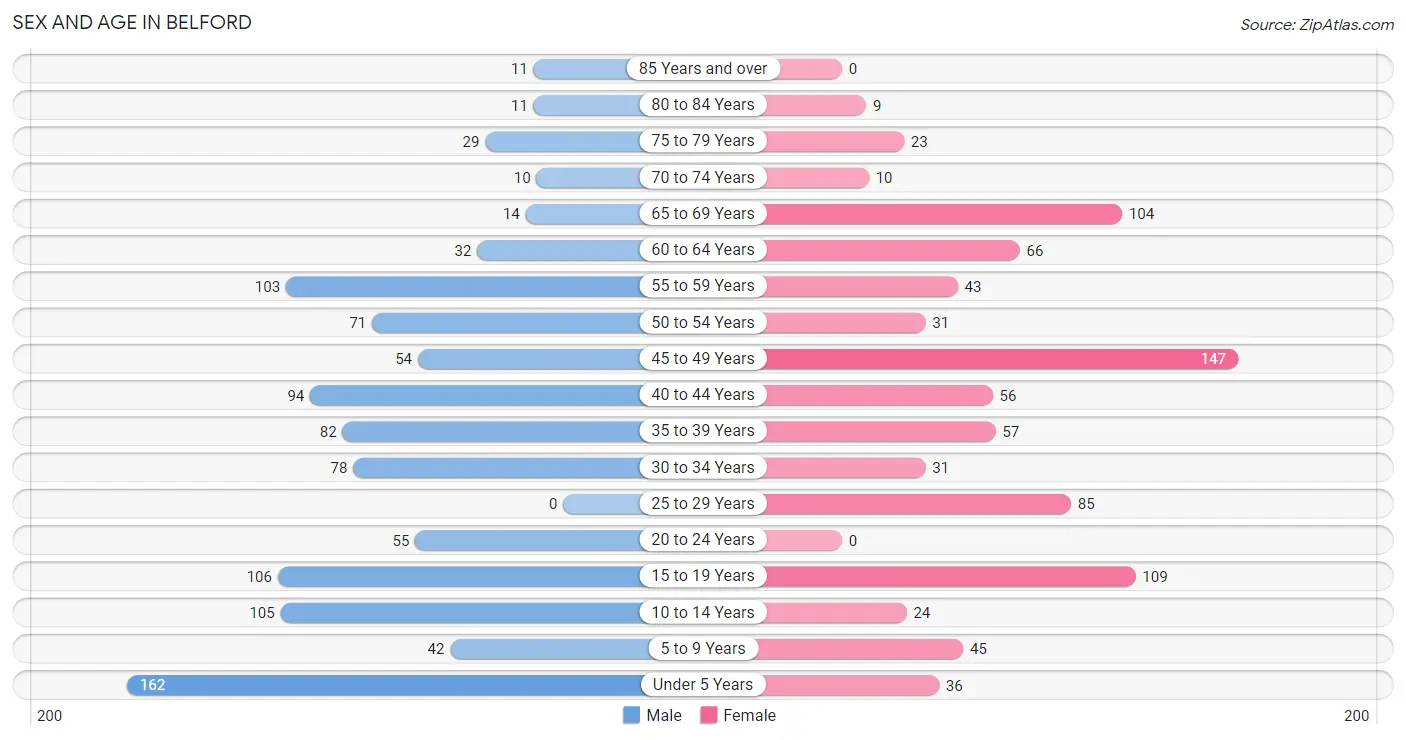
The most populous age groups in Belford are Under 5 Years (162 | 15.3%) for men and 45 to 49 Years (147 | 16.8%) for women.
| Age Bracket | Male | Female |
| Under 5 Years | 162 (15.3%) | 36 (4.1%) |
| 5 to 9 Years | 42 (4.0%) | 45 (5.1%) |
| 10 to 14 Years | 105 (9.9%) | 24 (2.7%) |
| 15 to 19 Years | 106 (10.0%) | 109 (12.4%) |
| 20 to 24 Years | 55 (5.2%) | 0 (0.0%) |
| 25 to 29 Years | 0 (0.0%) | 85 (9.7%) |
| 30 to 34 Years | 78 (7.4%) | 31 (3.5%) |
| 35 to 39 Years | 82 (7.7%) | 57 (6.5%) |
| 40 to 44 Years | 94 (8.9%) | 56 (6.4%) |
| 45 to 49 Years | 54 (5.1%) | 147 (16.8%) |
| 50 to 54 Years | 71 (6.7%) | 31 (3.5%) |
| 55 to 59 Years | 103 (9.7%) | 43 (4.9%) |
| 60 to 64 Years | 32 (3.0%) | 66 (7.5%) |
| 65 to 69 Years | 14 (1.3%) | 104 (11.9%) |
| 70 to 74 Years | 10 (0.9%) | 10 (1.1%) |
| 75 to 79 Years | 29 (2.7%) | 23 (2.6%) |
| 80 to 84 Years | 11 (1.0%) | 9 (1.0%) |
| 85 Years and over | 11 (1.0%) | 0 (0.0%) |
| Total | 1,059 (100.0%) | 876 (100.0%) |
Families and Households in Belford
Median Family Size in Belford
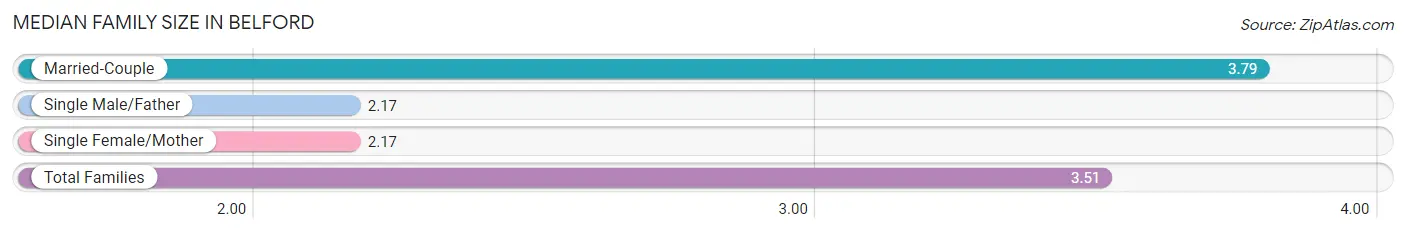
The median family size in Belford is 3.51 persons per family, with married-couple families (385 | 82.3%) accounting for the largest median family size of 3.79 persons per family. On the other hand, single male/father families (54 | 11.5%) represent the smallest median family size with 2.17 persons per family.
| Family Type | # Families | Family Size |
| Married-Couple | 385 (82.3%) | 3.79 |
| Single Male/Father | 54 (11.5%) | 2.17 |
| Single Female/Mother | 29 (6.2%) | 2.17 |
| Total Families | 468 (100.0%) | 3.51 |
Median Household Size in Belford
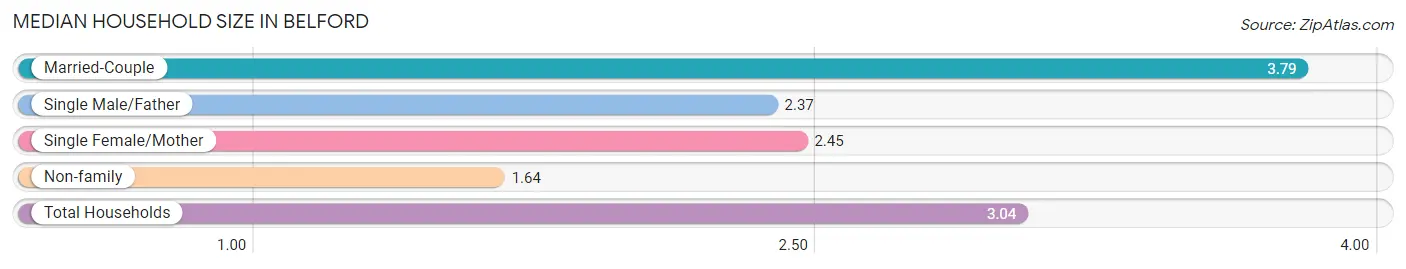
The median household size in Belford is 3.04 persons per household, with married-couple households (385 | 60.5%) accounting for the largest median household size of 3.79 persons per household. non-family households (168 | 26.4%) represent the smallest median household size with 1.64 persons per household.
| Household Type | # Households | Household Size |
| Married-Couple | 385 (60.5%) | 3.79 |
| Single Male/Father | 54 (8.5%) | 2.37 |
| Single Female/Mother | 29 (4.6%) | 2.45 |
| Non-family | 168 (26.4%) | 1.64 |
| Total Households | 636 (100.0%) | 3.04 |
Household Size by Marriage Status in Belford
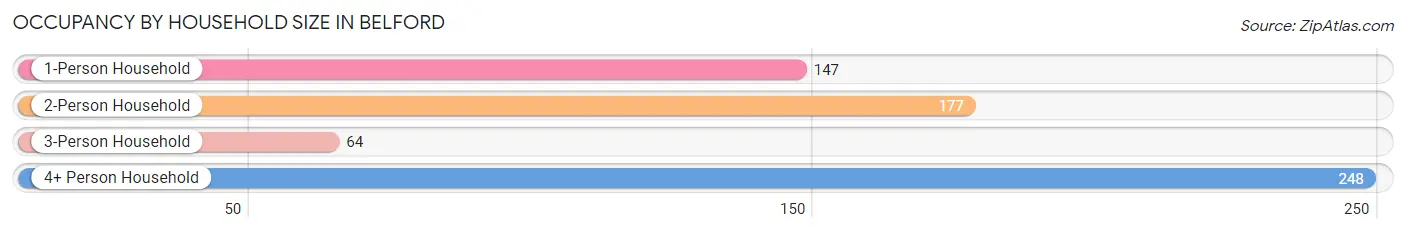
Out of a total of 636 households in Belford, 468 (73.6%) are family households, while 168 (26.4%) are nonfamily households. The most numerous type of family households are 2-person households, comprising 177, and the most common type of nonfamily households are 1-person households, comprising 147.
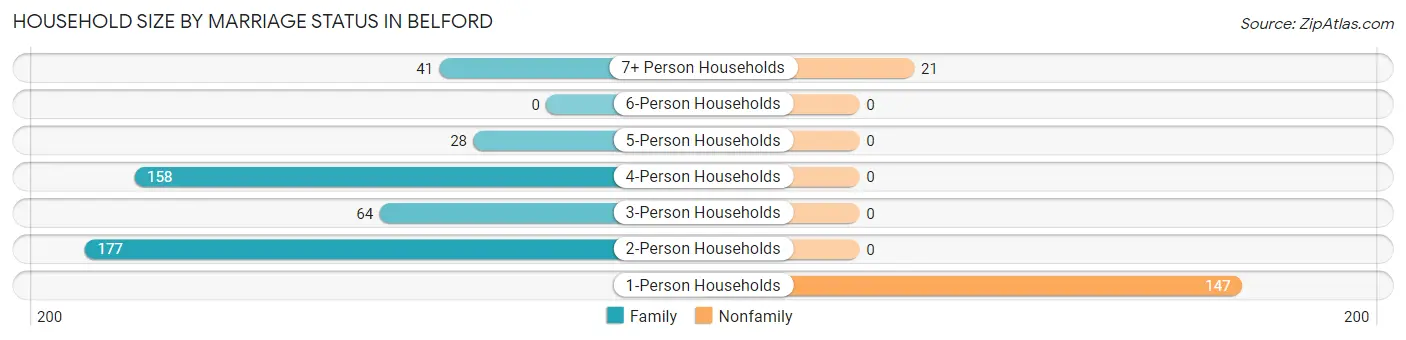
| Household Size | Family Households | Nonfamily Households |
| 1-Person Households | - | 147 (23.1%) |
| 2-Person Households | 177 (27.8%) | 0 (0.0%) |
| 3-Person Households | 64 (10.1%) | 0 (0.0%) |
| 4-Person Households | 158 (24.8%) | 0 (0.0%) |
| 5-Person Households | 28 (4.4%) | 0 (0.0%) |
| 6-Person Households | 0 (0.0%) | 0 (0.0%) |
| 7+ Person Households | 41 (6.5%) | 21 (3.3%) |
| Total | 468 (73.6%) | 168 (26.4%) |
Female Fertility in Belford
Fertility by Age in Belford
| Age Bracket | Women with Births | Births / 1,000 Women |
| 15 to 19 years | 0 (0.0%) | 0.0 |
| 20 to 34 years | 0 (0.0%) | 0.0 |
| 35 to 50 years | 0 (0.0%) | 0.0 |
| Total | 0 (0.0%) | 0.0 |
Fertility by Age by Marriage Status in Belford
| Age Bracket | Married | Unmarried |
| 15 to 19 years | 0 (0.0%) | 0 (0.0%) |
| 20 to 34 years | 0 (0.0%) | 0 (0.0%) |
| 35 to 50 years | 0 (0.0%) | 0 (0.0%) |
| Total | 0 (0.0%) | 0 (0.0%) |
Fertility by Education in Belford
| Educational Attainment | Women with Births | Births / 1,000 Women |
| Less than High School | 0 (0.0%) | 0.0 |
| High School Diploma | 0 (0.0%) | 0.0 |
| College or Associate's Degree | 0 (0.0%) | 0.0 |
| Bachelor's Degree | 0 (0.0%) | 0.0 |
| Graduate Degree | 0 (0.0%) | 0.0 |
| Total | 0 (0.0%) | 0.0 |
Fertility by Education by Marriage Status in Belford
| Educational Attainment | Married | Unmarried |
| Less than High School | 0 (0.0%) | 0 (0.0%) |
| High School Diploma | 0 (0.0%) | 0 (0.0%) |
| College or Associate's Degree | 0 (0.0%) | 0 (0.0%) |
| Bachelor's Degree | 0 (0.0%) | 0 (0.0%) |
| Graduate Degree | 0 (0.0%) | 0 (0.0%) |
| Total | 0 (0.0%) | 0 (0.0%) |
Employment Characteristics in Belford
Employment by Class of Employer in Belford
Among the 864 employed individuals in Belford, private company employees (731 | 84.6%), self-employed (not incorporated) (41 | 4.8%), and not-for-profit organizations (33 | 3.8%) make up the most common classes of employment.
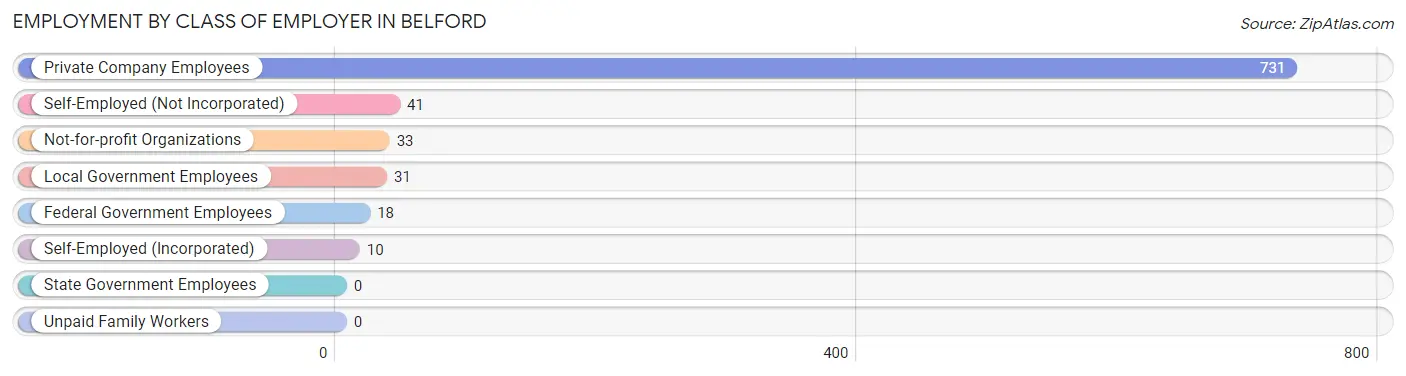
| Employer Class | # Employees | % Employees |
| Private Company Employees | 731 | 84.6% |
| Self-Employed (Incorporated) | 10 | 1.2% |
| Self-Employed (Not Incorporated) | 41 | 4.8% |
| Not-for-profit Organizations | 33 | 3.8% |
| Local Government Employees | 31 | 3.6% |
| State Government Employees | 0 | 0.0% |
| Federal Government Employees | 18 | 2.1% |
| Unpaid Family Workers | 0 | 0.0% |
| Total | 864 | 100.0% |
Employment Status by Age in Belford
According to the labor force statistics for Belford, out of the total population over 16 years of age (1,446), 65.6% or 949 individuals are in the labor force, with 9.0% or 85 of them unemployed. The age group with the highest labor force participation rate is 25 to 29 years, with 100.0% or 85 individuals in the labor force. Within the labor force, the 55 to 59 years age range has the highest percentage of unemployed individuals, with 40.2% or 45 of them being unemployed.
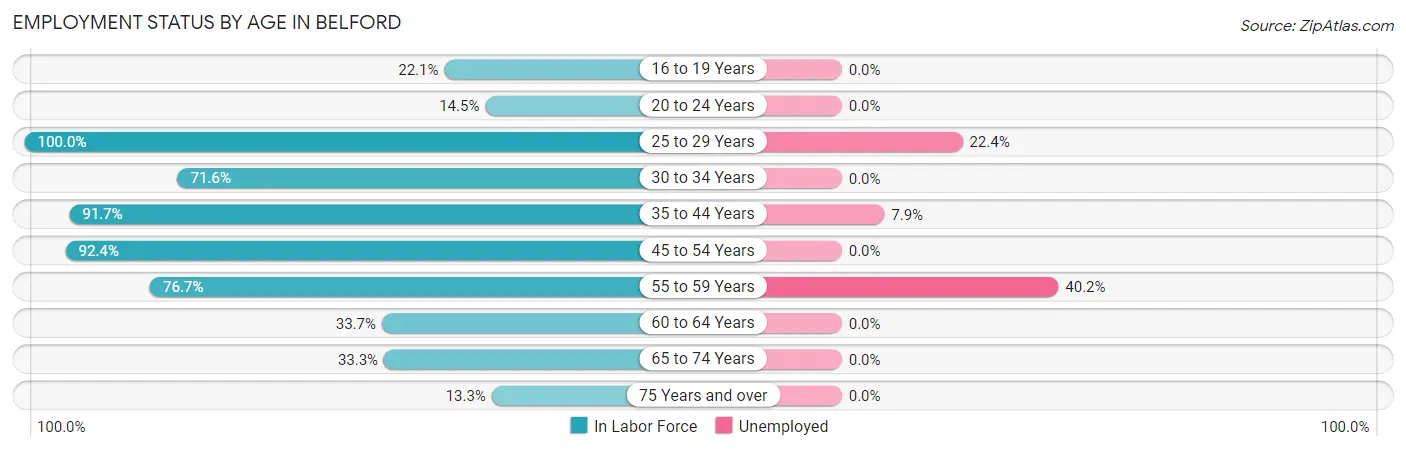
| Age Bracket | In Labor Force | Unemployed |
| 16 to 19 Years | 31 (22.1%) | 0 (0.0%) |
| 20 to 24 Years | 8 (14.5%) | 0 (0.0%) |
| 25 to 29 Years | 85 (100.0%) | 19 (22.4%) |
| 30 to 34 Years | 78 (71.6%) | 0 (0.0%) |
| 35 to 44 Years | 265 (91.7%) | 21 (7.9%) |
| 45 to 54 Years | 280 (92.4%) | 0 (0.0%) |
| 55 to 59 Years | 112 (76.7%) | 45 (40.2%) |
| 60 to 64 Years | 33 (33.7%) | 0 (0.0%) |
| 65 to 74 Years | 46 (33.3%) | 0 (0.0%) |
| 75 Years and over | 11 (13.3%) | 0 (0.0%) |
| Total | 949 (65.6%) | 85 (9.0%) |
Employment Status by Educational Attainment in Belford
According to labor force statistics for Belford, 82.8% of individuals (853) out of the total population between 25 and 64 years of age (1,030) are in the labor force, with 10.0% or 85 of them being unemployed. The group with the highest labor force participation rate are those with the educational attainment of college / associate degree, with 93.8% or 270 individuals in the labor force. Within the labor force, individuals with bachelor's degree or higher education have the highest percentage of unemployment, with 15.9% or 64 of them being unemployed.
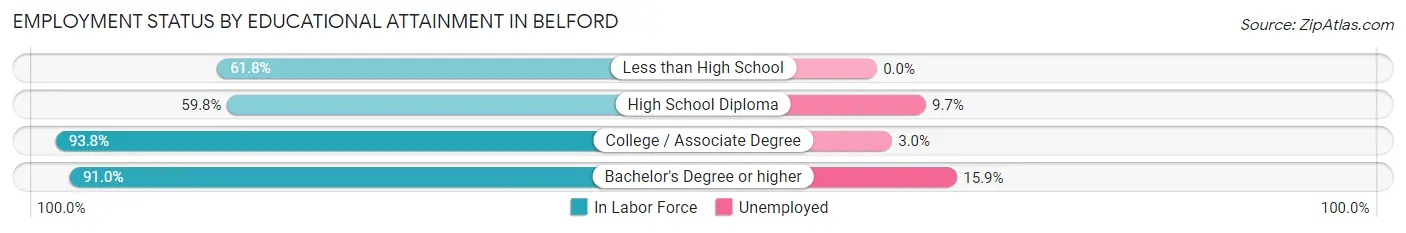
| Educational Attainment | In Labor Force | Unemployed |
| Less than High School | 47 (61.8%) | 0 (0.0%) |
| High School Diploma | 134 (59.8%) | 22 (9.7%) |
| College / Associate Degree | 270 (93.8%) | 9 (3.0%) |
| Bachelor's Degree or higher | 402 (91.0%) | 70 (15.9%) |
| Total | 853 (82.8%) | 103 (10.0%) |
Employment Occupations by Sex in Belford
Management, Business, Science and Arts Occupations
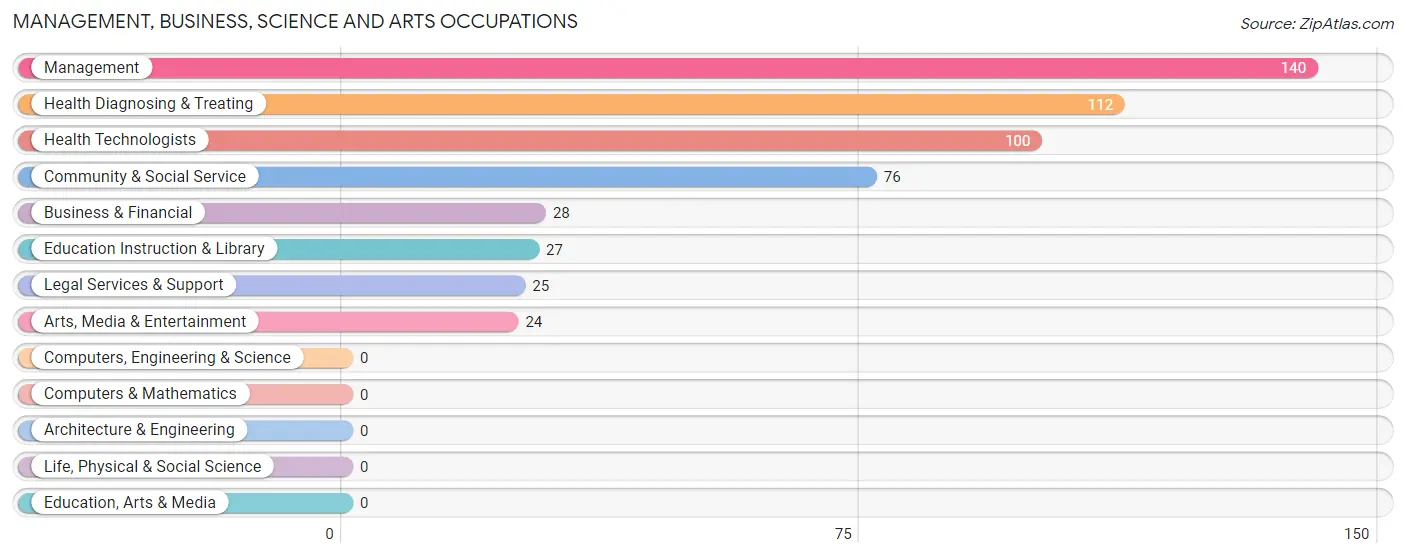
The most common Management, Business, Science and Arts occupations in Belford are Management (140 | 16.2%), Health Diagnosing & Treating (112 | 13.0%), Health Technologists (100 | 11.6%), Community & Social Service (76 | 8.8%), and Business & Financial (28 | 3.2%).
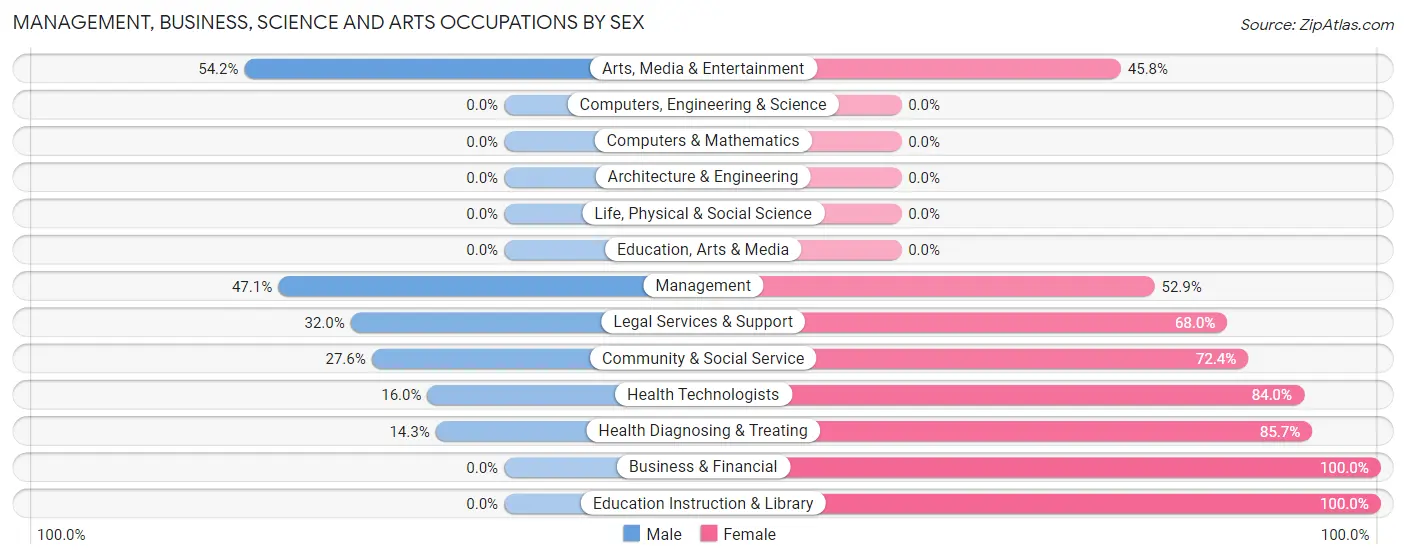
Management, Business, Science and Arts Occupations by Sex
Within the Management, Business, Science and Arts occupations in Belford, the most male-oriented occupations are Arts, Media & Entertainment (54.2%), Management (47.1%), and Legal Services & Support (32.0%), while the most female-oriented occupations are Business & Financial (100.0%), Education Instruction & Library (100.0%), and Health Diagnosing & Treating (85.7%).
| Occupation | Male | Female |
| Management | 66 (47.1%) | 74 (52.9%) |
| Business & Financial | 0 (0.0%) | 28 (100.0%) |
| Computers, Engineering & Science | 0 (0.0%) | 0 (0.0%) |
| Computers & Mathematics | 0 (0.0%) | 0 (0.0%) |
| Architecture & Engineering | 0 (0.0%) | 0 (0.0%) |
| Life, Physical & Social Science | 0 (0.0%) | 0 (0.0%) |
| Community & Social Service | 21 (27.6%) | 55 (72.4%) |
| Education, Arts & Media | 0 (0.0%) | 0 (0.0%) |
| Legal Services & Support | 8 (32.0%) | 17 (68.0%) |
| Education Instruction & Library | 0 (0.0%) | 27 (100.0%) |
| Arts, Media & Entertainment | 13 (54.2%) | 11 (45.8%) |
| Health Diagnosing & Treating | 16 (14.3%) | 96 (85.7%) |
| Health Technologists | 16 (16.0%) | 84 (84.0%) |
| Total (Category) | 103 (28.9%) | 253 (71.1%) |
| Total (Overall) | 454 (52.5%) | 410 (47.4%) |
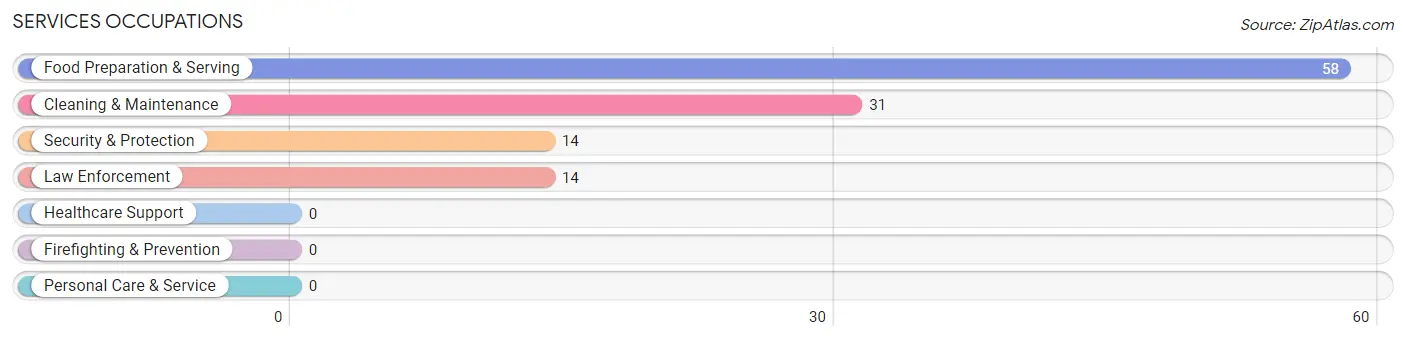
Services Occupations
The most common Services occupations in Belford are Food Preparation & Serving (58 | 6.7%), Cleaning & Maintenance (31 | 3.6%), Security & Protection (14 | 1.6%), and Law Enforcement (14 | 1.6%).
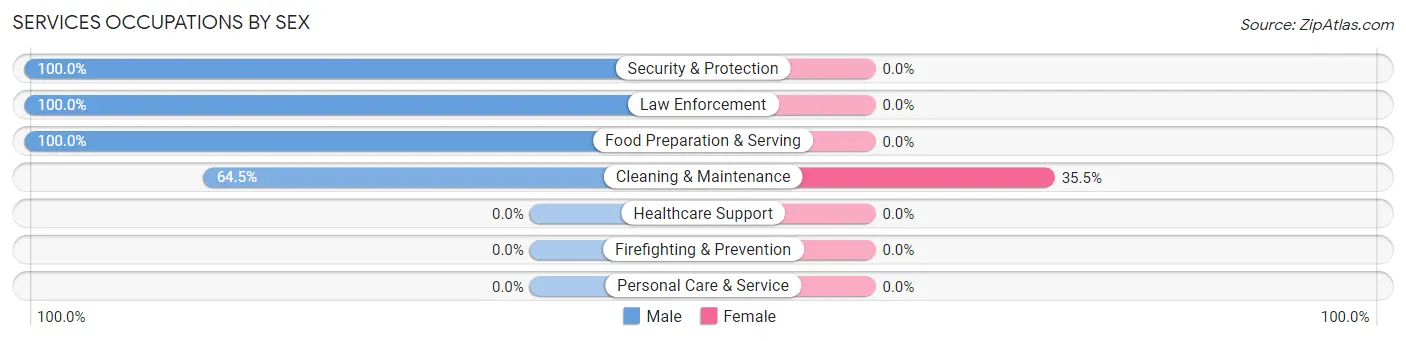
Services Occupations by Sex
| Occupation | Male | Female |
| Healthcare Support | 0 (0.0%) | 0 (0.0%) |
| Security & Protection | 14 (100.0%) | 0 (0.0%) |
| Firefighting & Prevention | 0 (0.0%) | 0 (0.0%) |
| Law Enforcement | 14 (100.0%) | 0 (0.0%) |
| Food Preparation & Serving | 58 (100.0%) | 0 (0.0%) |
| Cleaning & Maintenance | 20 (64.5%) | 11 (35.5%) |
| Personal Care & Service | 0 (0.0%) | 0 (0.0%) |
| Total (Category) | 92 (89.3%) | 11 (10.7%) |
| Total (Overall) | 454 (52.5%) | 410 (47.4%) |
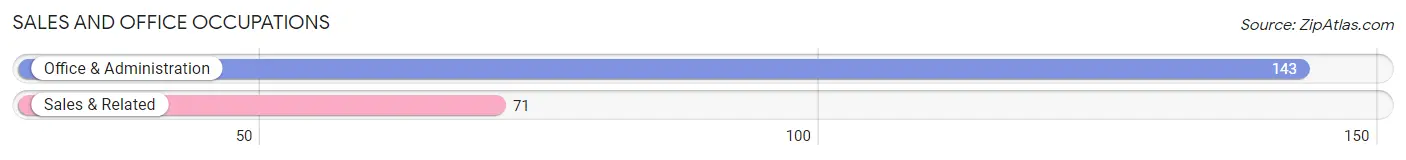
Sales and Office Occupations
The most common Sales and Office occupations in Belford are Office & Administration (143 | 16.6%), and Sales & Related (71 | 8.2%).
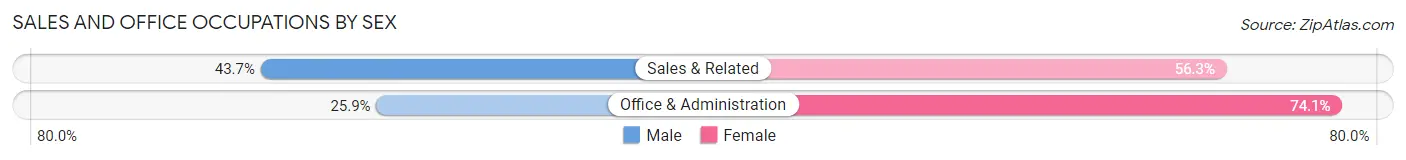
Sales and Office Occupations by Sex
| Occupation | Male | Female |
| Sales & Related | 31 (43.7%) | 40 (56.3%) |
| Office & Administration | 37 (25.9%) | 106 (74.1%) |
| Total (Category) | 68 (31.8%) | 146 (68.2%) |
| Total (Overall) | 454 (52.5%) | 410 (47.4%) |
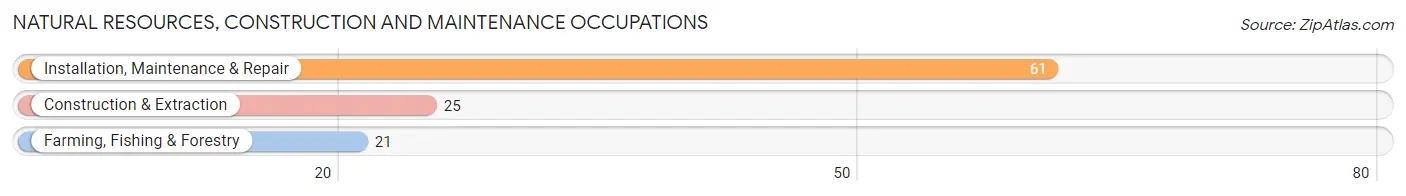
Natural Resources, Construction and Maintenance Occupations
The most common Natural Resources, Construction and Maintenance occupations in Belford are Installation, Maintenance & Repair (61 | 7.1%), Construction & Extraction (25 | 2.9%), and Farming, Fishing & Forestry (21 | 2.4%).
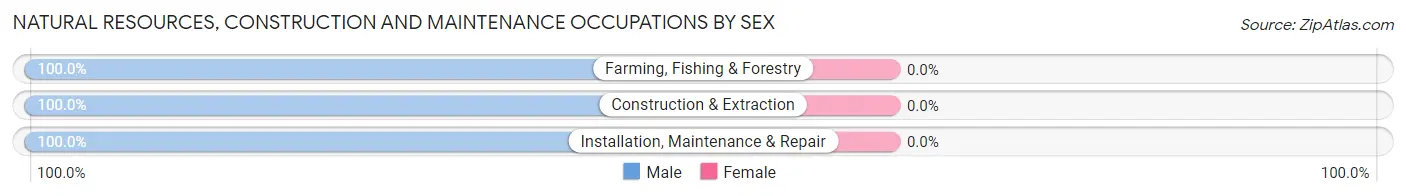
Natural Resources, Construction and Maintenance Occupations by Sex
| Occupation | Male | Female |
| Farming, Fishing & Forestry | 21 (100.0%) | 0 (0.0%) |
| Construction & Extraction | 25 (100.0%) | 0 (0.0%) |
| Installation, Maintenance & Repair | 61 (100.0%) | 0 (0.0%) |
| Total (Category) | 107 (100.0%) | 0 (0.0%) |
| Total (Overall) | 454 (52.5%) | 410 (47.4%) |
Production, Transportation and Moving Occupations
The most common Production, Transportation and Moving occupations in Belford are Transportation (42 | 4.9%), Production (30 | 3.5%), and Material Moving (12 | 1.4%).
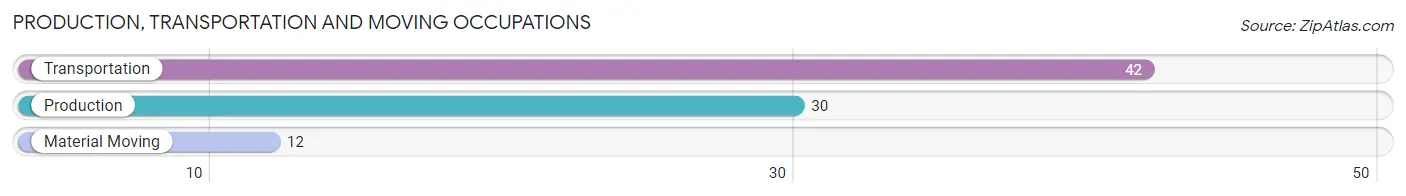
Production, Transportation and Moving Occupations by Sex
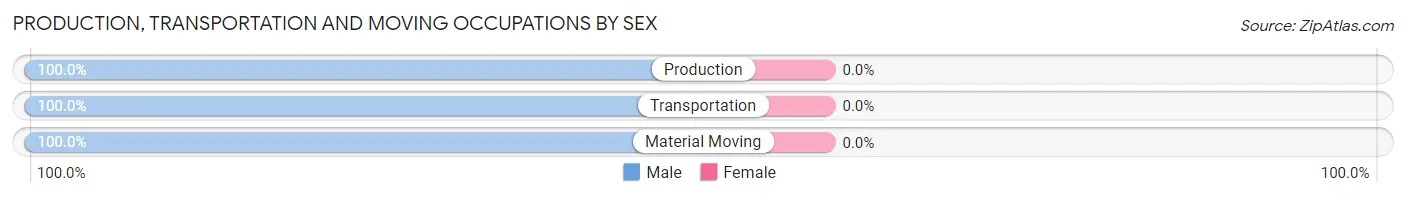
| Occupation | Male | Female |
| Production | 30 (100.0%) | 0 (0.0%) |
| Transportation | 42 (100.0%) | 0 (0.0%) |
| Material Moving | 12 (100.0%) | 0 (0.0%) |
| Total (Category) | 84 (100.0%) | 0 (0.0%) |
| Total (Overall) | 454 (52.5%) | 410 (47.4%) |
Employment Industries by Sex in Belford
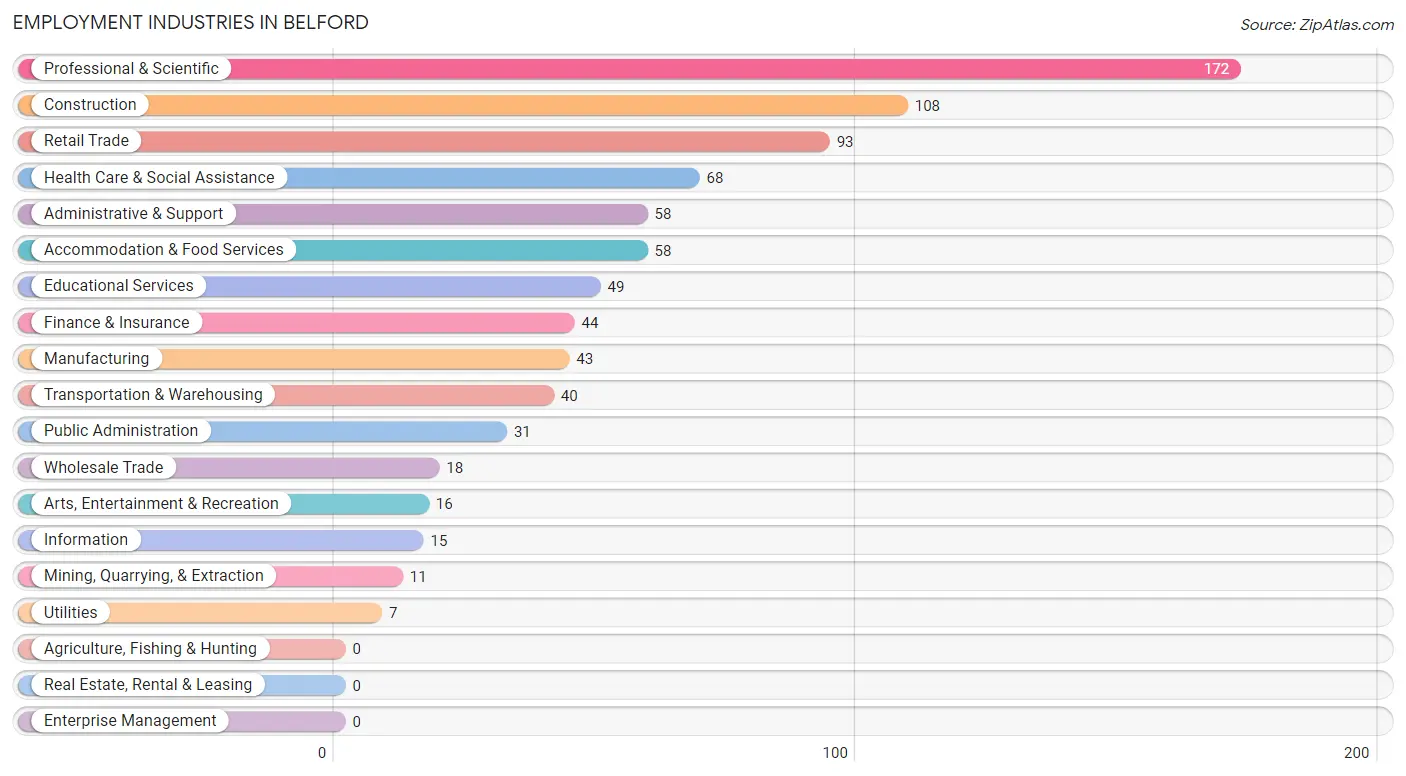
Employment Industries in Belford
The major employment industries in Belford include Professional & Scientific (172 | 19.9%), Construction (108 | 12.5%), Retail Trade (93 | 10.8%), Health Care & Social Assistance (68 | 7.9%), and Administrative & Support (58 | 6.7%).
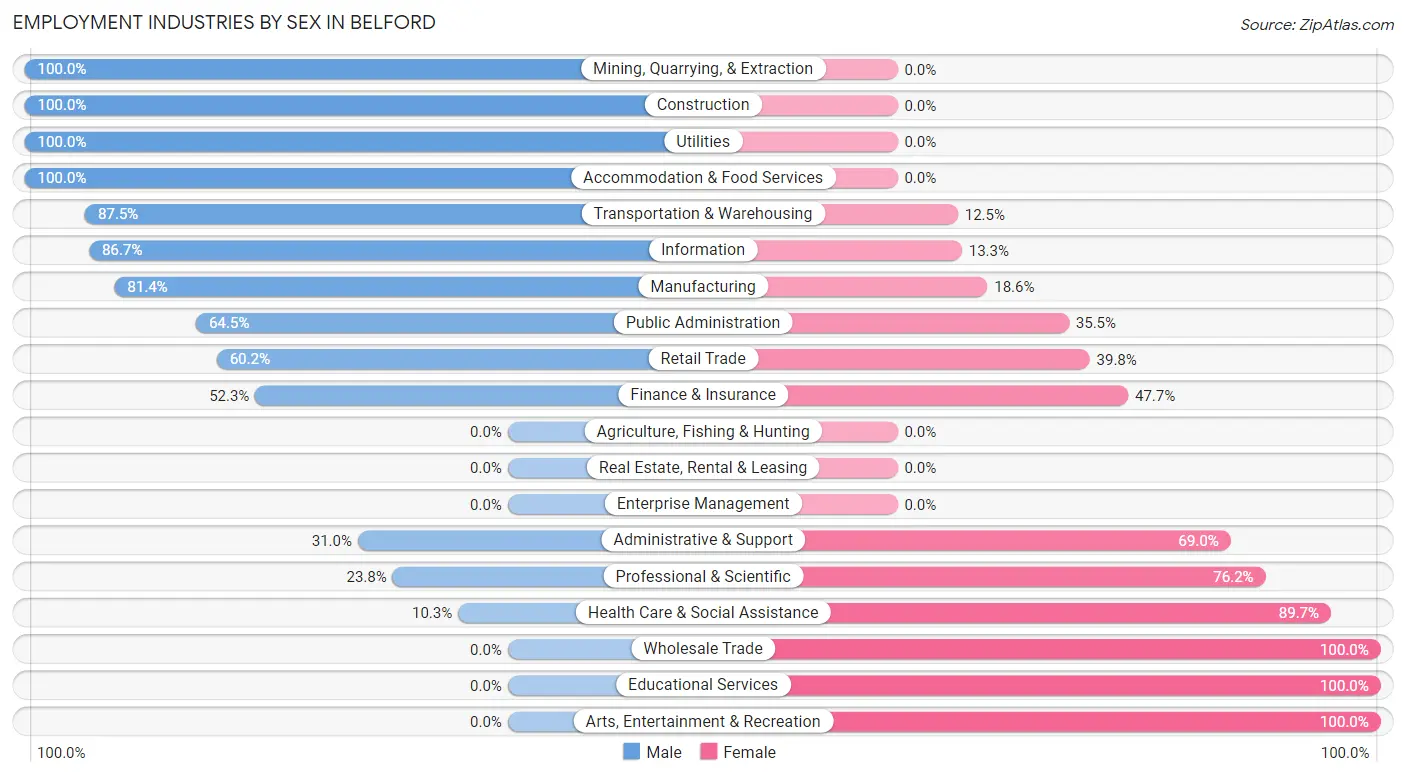
Employment Industries by Sex in Belford
The Belford industries that see more men than women are Mining, Quarrying, & Extraction (100.0%), Construction (100.0%), and Utilities (100.0%), whereas the industries that tend to have a higher number of women are Wholesale Trade (100.0%), Educational Services (100.0%), and Arts, Entertainment & Recreation (100.0%).
| Industry | Male | Female |
| Agriculture, Fishing & Hunting | 0 (0.0%) | 0 (0.0%) |
| Mining, Quarrying, & Extraction | 11 (100.0%) | 0 (0.0%) |
| Construction | 108 (100.0%) | 0 (0.0%) |
| Manufacturing | 35 (81.4%) | 8 (18.6%) |
| Wholesale Trade | 0 (0.0%) | 18 (100.0%) |
| Retail Trade | 56 (60.2%) | 37 (39.8%) |
| Transportation & Warehousing | 35 (87.5%) | 5 (12.5%) |
| Utilities | 7 (100.0%) | 0 (0.0%) |
| Information | 13 (86.7%) | 2 (13.3%) |
| Finance & Insurance | 23 (52.3%) | 21 (47.7%) |
| Real Estate, Rental & Leasing | 0 (0.0%) | 0 (0.0%) |
| Professional & Scientific | 41 (23.8%) | 131 (76.2%) |
| Enterprise Management | 0 (0.0%) | 0 (0.0%) |
| Administrative & Support | 18 (31.0%) | 40 (69.0%) |
| Educational Services | 0 (0.0%) | 49 (100.0%) |
| Health Care & Social Assistance | 7 (10.3%) | 61 (89.7%) |
| Arts, Entertainment & Recreation | 0 (0.0%) | 16 (100.0%) |
| Accommodation & Food Services | 58 (100.0%) | 0 (0.0%) |
| Public Administration | 20 (64.5%) | 11 (35.5%) |
| Total | 454 (52.5%) | 410 (47.4%) |
Education in Belford
School Enrollment in Belford
The most common levels of schooling among the 574 students in Belford are high school (182 | 31.7%), middle school (137 | 23.9%), and nursery / preschool (79 | 13.8%).
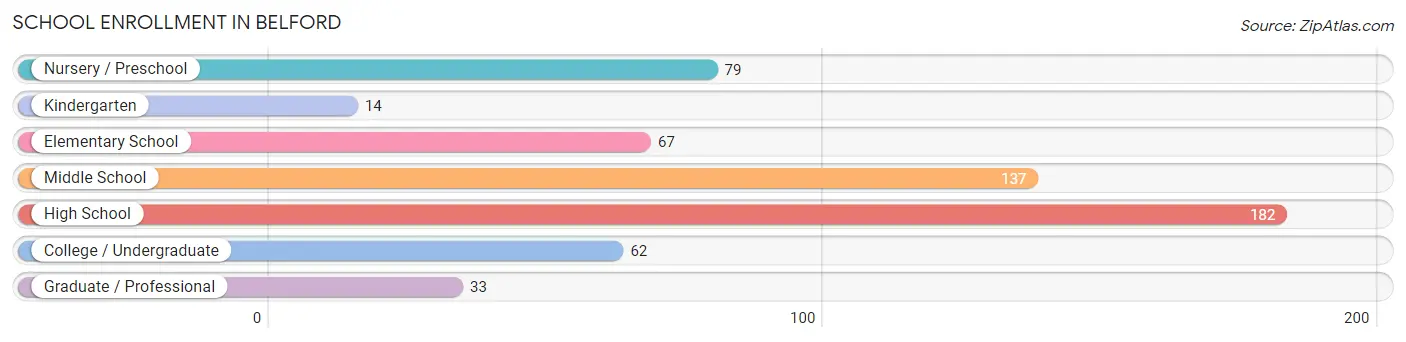
| School Level | # Students | % Students |
| Nursery / Preschool | 79 | 13.8% |
| Kindergarten | 14 | 2.4% |
| Elementary School | 67 | 11.7% |
| Middle School | 137 | 23.9% |
| High School | 182 | 31.7% |
| College / Undergraduate | 62 | 10.8% |
| Graduate / Professional | 33 | 5.8% |
| Total | 574 | 100.0% |
School Enrollment by Age by Funding Source in Belford
Out of a total of 574 students who are enrolled in schools in Belford, 282 (49.1%) attend a private institution, while the remaining 292 (50.9%) are enrolled in public schools. The age group of 20 to 24 year olds has the highest likelihood of being enrolled in private schools, with 47 (100.0% in the age bracket) enrolled. Conversely, the age group of 18 to 19 year olds has the lowest likelihood of being enrolled in a private school, with 59 (100.0% in the age bracket) attending a public institution.
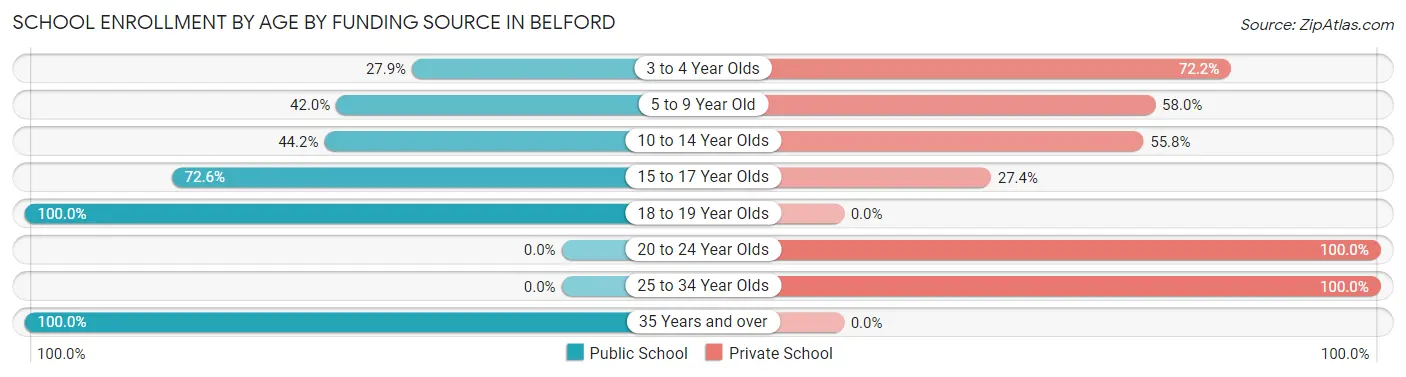
| Age Bracket | Public School | Private School |
| 3 to 4 Year Olds | 22 (27.9%) | 57 (72.2%) |
| 5 to 9 Year Old | 34 (42.0%) | 47 (58.0%) |
| 10 to 14 Year Olds | 57 (44.2%) | 72 (55.8%) |
| 15 to 17 Year Olds | 106 (72.6%) | 40 (27.4%) |
| 18 to 19 Year Olds | 59 (100.0%) | 0 (0.0%) |
| 20 to 24 Year Olds | 0 (0.0%) | 47 (100.0%) |
| 25 to 34 Year Olds | 0 (0.0%) | 19 (100.0%) |
| 35 Years and over | 14 (100.0%) | 0 (0.0%) |
| Total | 292 (50.9%) | 282 (49.1%) |
Educational Attainment by Field of Study in Belford
Business (114 | 20.3%), communications (82 | 14.6%), science & technology (68 | 12.1%), psychology (66 | 11.7%), and engineering (57 | 10.1%) are the most common fields of study among 562 individuals in Belford who have obtained a bachelor's degree or higher.
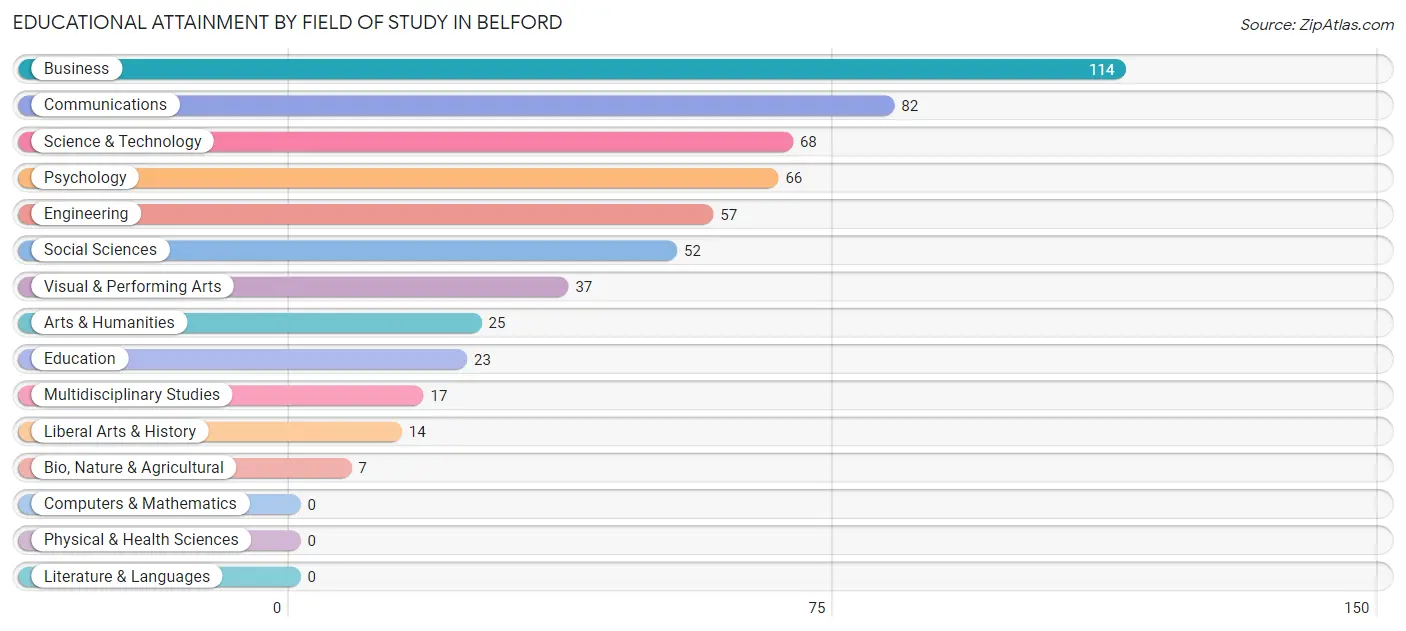
| Field of Study | # Graduates | % Graduates |
| Computers & Mathematics | 0 | 0.0% |
| Bio, Nature & Agricultural | 7 | 1.3% |
| Physical & Health Sciences | 0 | 0.0% |
| Psychology | 66 | 11.7% |
| Social Sciences | 52 | 9.2% |
| Engineering | 57 | 10.1% |
| Multidisciplinary Studies | 17 | 3.0% |
| Science & Technology | 68 | 12.1% |
| Business | 114 | 20.3% |
| Education | 23 | 4.1% |
| Literature & Languages | 0 | 0.0% |
| Liberal Arts & History | 14 | 2.5% |
| Visual & Performing Arts | 37 | 6.6% |
| Communications | 82 | 14.6% |
| Arts & Humanities | 25 | 4.4% |
| Total | 562 | 100.0% |
Transportation & Commute in Belford
Vehicle Availability by Sex in Belford
The most prevalent vehicle ownership categories in Belford are males with 2 vehicles (190, accounting for 41.8%) and females with 2 vehicles (138, making up 46.3%).
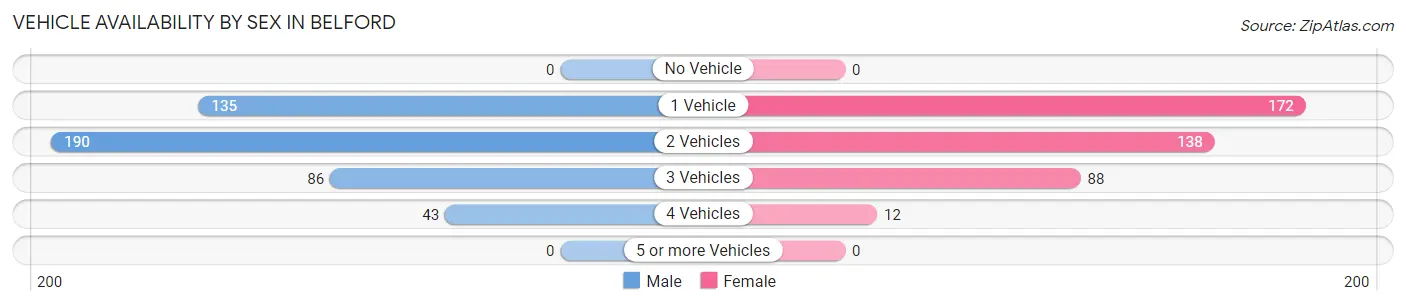
| Vehicles Available | Male | Female |
| No Vehicle | 0 (0.0%) | 0 (0.0%) |
| 1 Vehicle | 135 (29.7%) | 172 (41.9%) |
| 2 Vehicles | 190 (41.8%) | 138 (33.7%) |
| 3 Vehicles | 86 (18.9%) | 88 (21.5%) |
| 4 Vehicles | 43 (9.5%) | 12 (2.9%) |
| 5 or more Vehicles | 0 (0.0%) | 0 (0.0%) |
| Total | 454 (100.0%) | 410 (100.0%) |
Commute Time in Belford
The most frequently occuring commute durations in Belford are 60 to 89 minutes (112 commuters, 14.8%), 90 or more minutes (107 commuters, 14.1%), and 40 to 44 minutes (106 commuters, 14.0%).
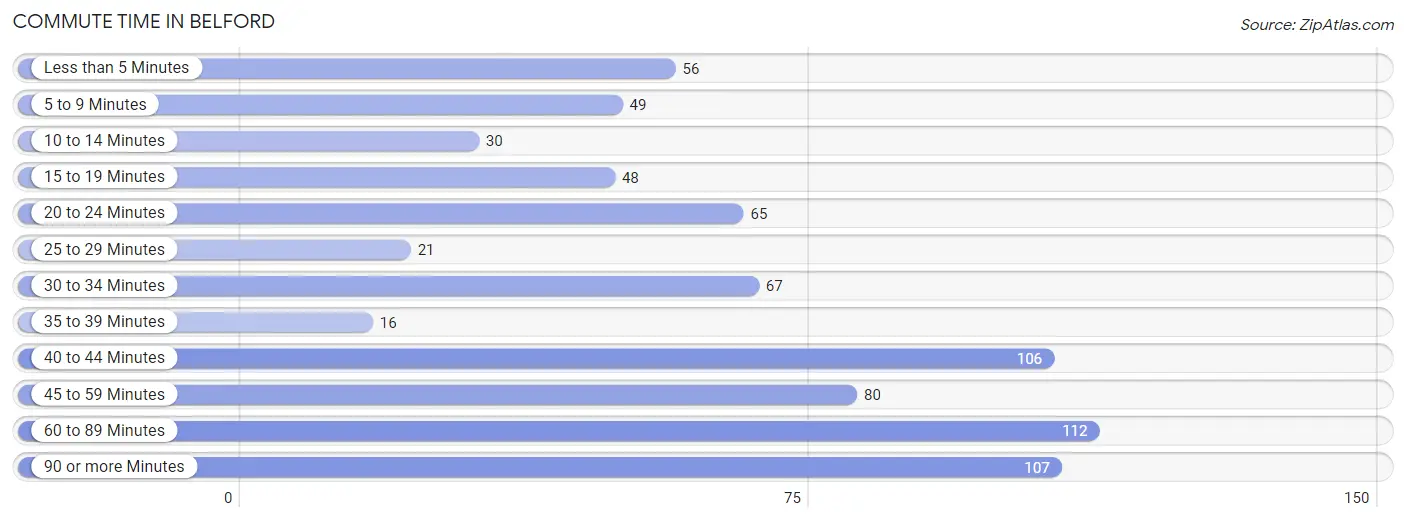
| Commute Time | # Commuters | % Commuters |
| Less than 5 Minutes | 56 | 7.4% |
| 5 to 9 Minutes | 49 | 6.5% |
| 10 to 14 Minutes | 30 | 4.0% |
| 15 to 19 Minutes | 48 | 6.3% |
| 20 to 24 Minutes | 65 | 8.6% |
| 25 to 29 Minutes | 21 | 2.8% |
| 30 to 34 Minutes | 67 | 8.8% |
| 35 to 39 Minutes | 16 | 2.1% |
| 40 to 44 Minutes | 106 | 14.0% |
| 45 to 59 Minutes | 80 | 10.6% |
| 60 to 89 Minutes | 112 | 14.8% |
| 90 or more Minutes | 107 | 14.1% |
Commute Time by Sex in Belford
The most common commute times in Belford are 60 to 89 minutes (90 commuters, 21.0%) for males and 90 or more minutes (67 commuters, 20.4%) for females.
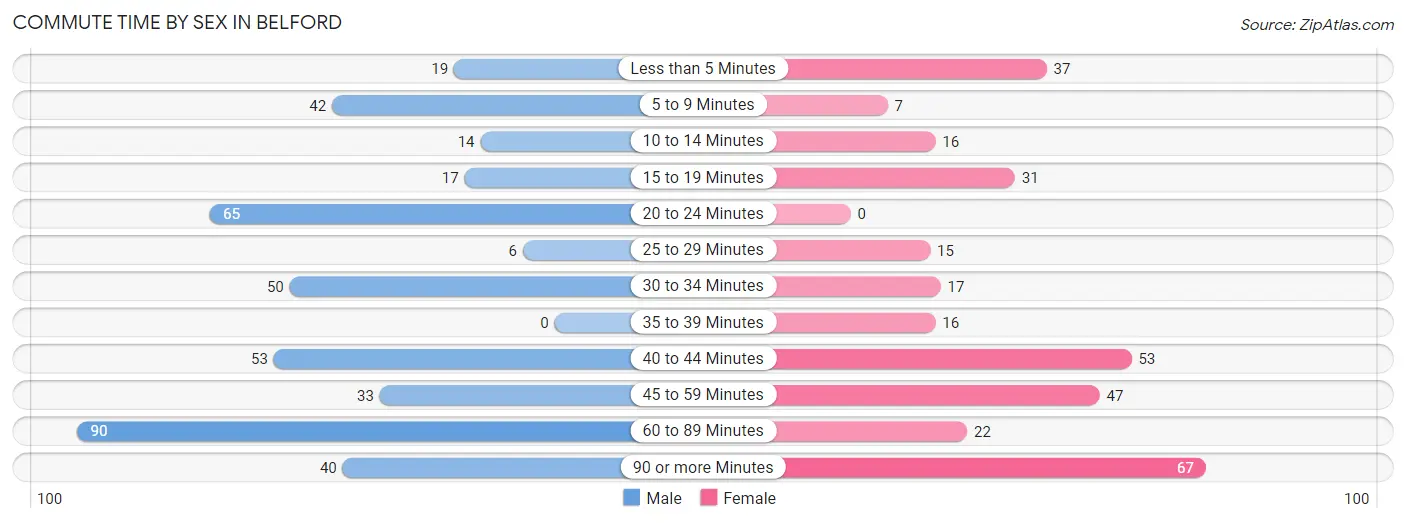
| Commute Time | Male | Female |
| Less than 5 Minutes | 19 (4.4%) | 37 (11.3%) |
| 5 to 9 Minutes | 42 (9.8%) | 7 (2.1%) |
| 10 to 14 Minutes | 14 (3.3%) | 16 (4.9%) |
| 15 to 19 Minutes | 17 (4.0%) | 31 (9.5%) |
| 20 to 24 Minutes | 65 (15.1%) | 0 (0.0%) |
| 25 to 29 Minutes | 6 (1.4%) | 15 (4.6%) |
| 30 to 34 Minutes | 50 (11.7%) | 17 (5.2%) |
| 35 to 39 Minutes | 0 (0.0%) | 16 (4.9%) |
| 40 to 44 Minutes | 53 (12.3%) | 53 (16.2%) |
| 45 to 59 Minutes | 33 (7.7%) | 47 (14.3%) |
| 60 to 89 Minutes | 90 (21.0%) | 22 (6.7%) |
| 90 or more Minutes | 40 (9.3%) | 67 (20.4%) |
Time of Departure to Work by Sex in Belford
The most frequent times of departure to work in Belford are 4:00 PM to 11:59 PM (71, 16.6%) for males and 9:00 AM to 9:59 AM (80, 24.4%) for females.
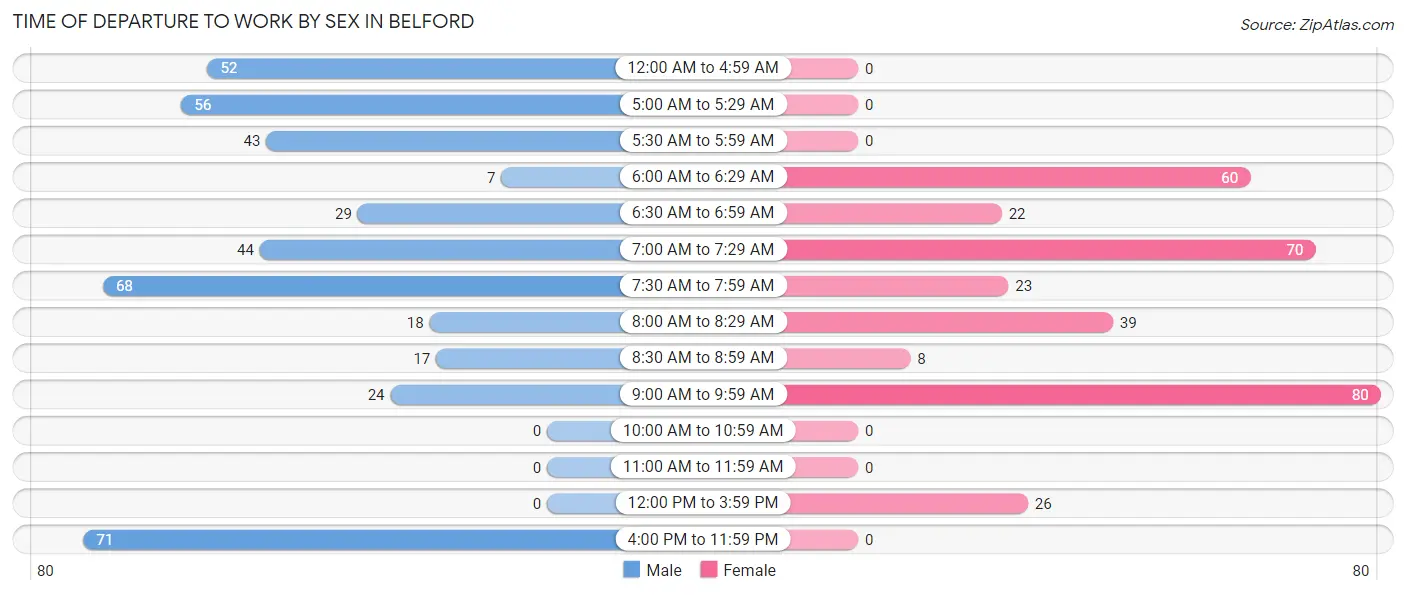
| Time of Departure | Male | Female |
| 12:00 AM to 4:59 AM | 52 (12.1%) | 0 (0.0%) |
| 5:00 AM to 5:29 AM | 56 (13.1%) | 0 (0.0%) |
| 5:30 AM to 5:59 AM | 43 (10.0%) | 0 (0.0%) |
| 6:00 AM to 6:29 AM | 7 (1.6%) | 60 (18.3%) |
| 6:30 AM to 6:59 AM | 29 (6.8%) | 22 (6.7%) |
| 7:00 AM to 7:29 AM | 44 (10.3%) | 70 (21.3%) |
| 7:30 AM to 7:59 AM | 68 (15.9%) | 23 (7.0%) |
| 8:00 AM to 8:29 AM | 18 (4.2%) | 39 (11.9%) |
| 8:30 AM to 8:59 AM | 17 (4.0%) | 8 (2.4%) |
| 9:00 AM to 9:59 AM | 24 (5.6%) | 80 (24.4%) |
| 10:00 AM to 10:59 AM | 0 (0.0%) | 0 (0.0%) |
| 11:00 AM to 11:59 AM | 0 (0.0%) | 0 (0.0%) |
| 12:00 PM to 3:59 PM | 0 (0.0%) | 26 (7.9%) |
| 4:00 PM to 11:59 PM | 71 (16.6%) | 0 (0.0%) |
| Total | 429 (100.0%) | 328 (100.0%) |
Housing Occupancy in Belford
Occupancy by Ownership in Belford
Of the total 636 dwellings in Belford, owner-occupied units account for 522 (82.1%), while renter-occupied units make up 114 (17.9%).
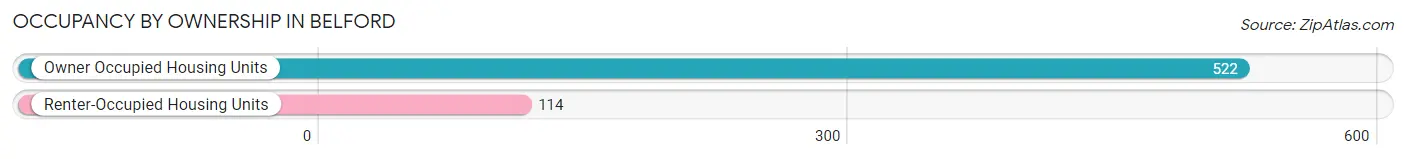
| Occupancy | # Housing Units | % Housing Units |
| Owner Occupied Housing Units | 522 | 82.1% |
| Renter-Occupied Housing Units | 114 | 17.9% |
| Total Occupied Housing Units | 636 | 100.0% |
Occupancy by Household Size in Belford
| Household Size | # Housing Units | % Housing Units |
| 1-Person Household | 147 | 23.1% |
| 2-Person Household | 177 | 27.8% |
| 3-Person Household | 64 | 10.1% |
| 4+ Person Household | 248 | 39.0% |
| Total Housing Units | 636 | 100.0% |
Occupancy by Ownership by Household Size in Belford
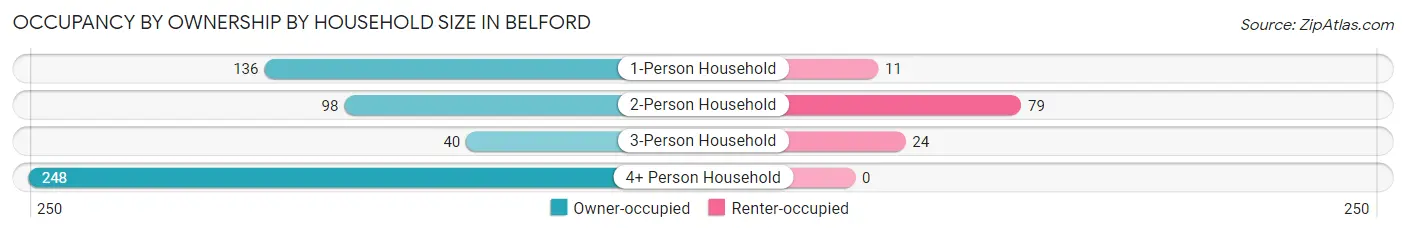
| Household Size | Owner-occupied | Renter-occupied |
| 1-Person Household | 136 (92.5%) | 11 (7.5%) |
| 2-Person Household | 98 (55.4%) | 79 (44.6%) |
| 3-Person Household | 40 (62.5%) | 24 (37.5%) |
| 4+ Person Household | 248 (100.0%) | 0 (0.0%) |
| Total Housing Units | 522 (82.1%) | 114 (17.9%) |
Occupancy by Educational Attainment in Belford
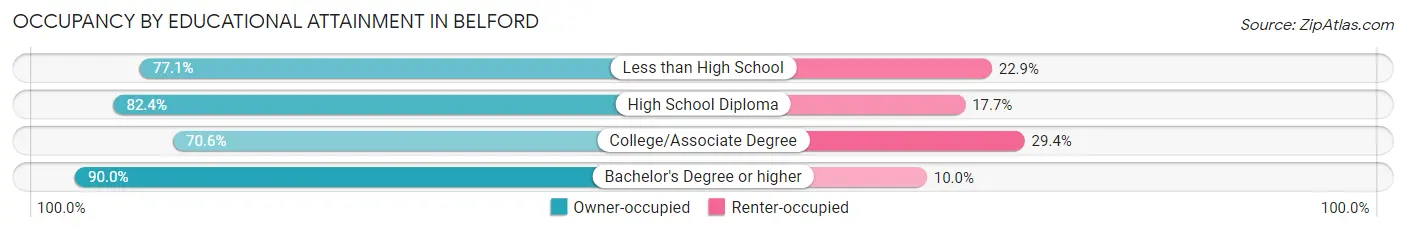
| Household Size | Owner-occupied | Renter-occupied |
| Less than High School | 37 (77.1%) | 11 (22.9%) |
| High School Diploma | 98 (82.4%) | 21 (17.6%) |
| College/Associate Degree | 127 (70.6%) | 53 (29.4%) |
| Bachelor's Degree or higher | 260 (90.0%) | 29 (10.0%) |
Occupancy by Age of Householder in Belford
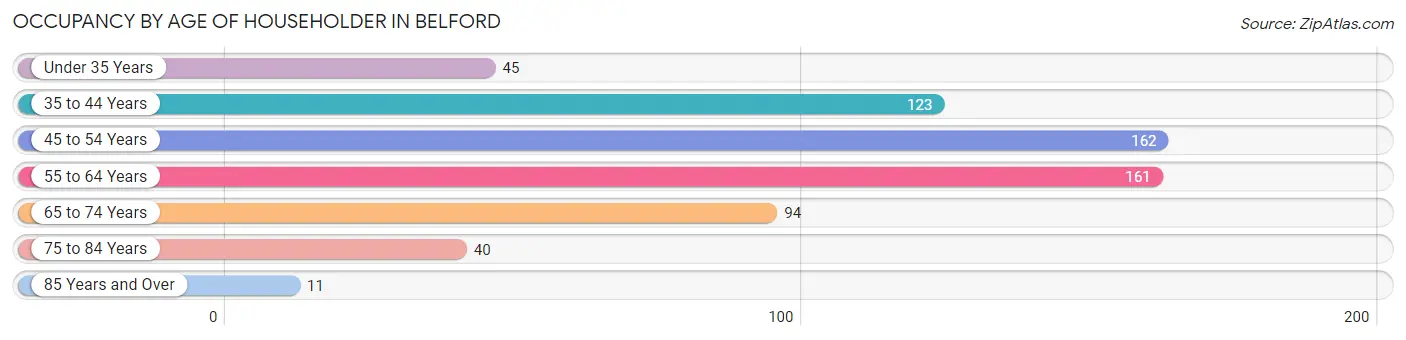
| Age Bracket | # Households | % Households |
| Under 35 Years | 45 | 7.1% |
| 35 to 44 Years | 123 | 19.3% |
| 45 to 54 Years | 162 | 25.5% |
| 55 to 64 Years | 161 | 25.3% |
| 65 to 74 Years | 94 | 14.8% |
| 75 to 84 Years | 40 | 6.3% |
| 85 Years and Over | 11 | 1.7% |
| Total | 636 | 100.0% |
Housing Finances in Belford
Median Income by Occupancy in Belford
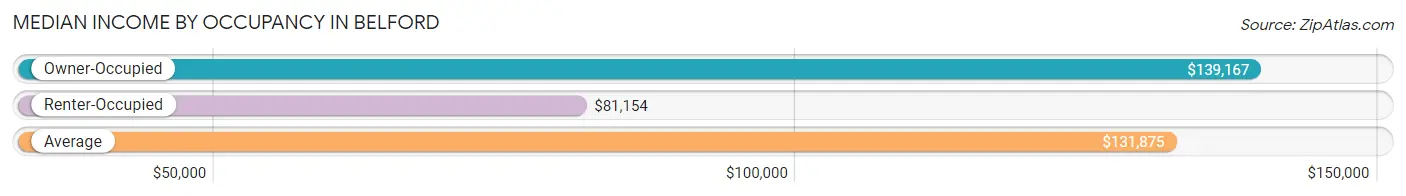
| Occupancy Type | # Households | Median Income |
| Owner-Occupied | 522 (82.1%) | $139,167 |
| Renter-Occupied | 114 (17.9%) | $81,154 |
| Average | 636 (100.0%) | $131,875 |
Occupancy by Householder Income Bracket in Belford
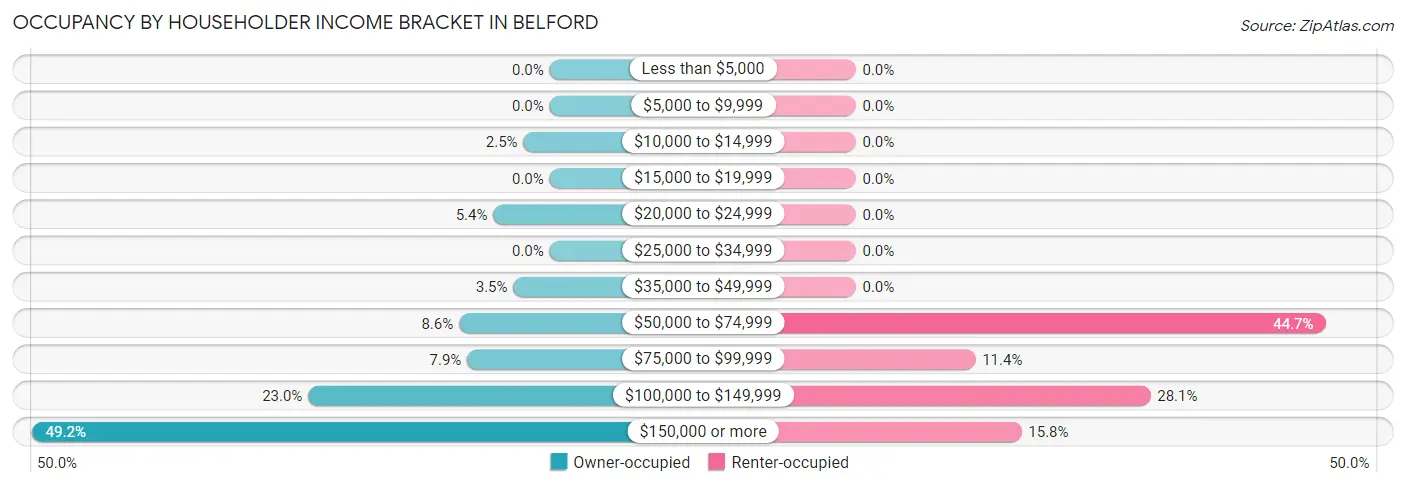
| Income Bracket | Owner-occupied | Renter-occupied |
| Less than $5,000 | 0 (0.0%) | 0 (0.0%) |
| $5,000 to $9,999 | 0 (0.0%) | 0 (0.0%) |
| $10,000 to $14,999 | 13 (2.5%) | 0 (0.0%) |
| $15,000 to $19,999 | 0 (0.0%) | 0 (0.0%) |
| $20,000 to $24,999 | 28 (5.4%) | 0 (0.0%) |
| $25,000 to $34,999 | 0 (0.0%) | 0 (0.0%) |
| $35,000 to $49,999 | 18 (3.5%) | 0 (0.0%) |
| $50,000 to $74,999 | 45 (8.6%) | 51 (44.7%) |
| $75,000 to $99,999 | 41 (7.9%) | 13 (11.4%) |
| $100,000 to $149,999 | 120 (23.0%) | 32 (28.1%) |
| $150,000 or more | 257 (49.2%) | 18 (15.8%) |
| Total | 522 (100.0%) | 114 (100.0%) |
Monthly Housing Cost Tiers in Belford
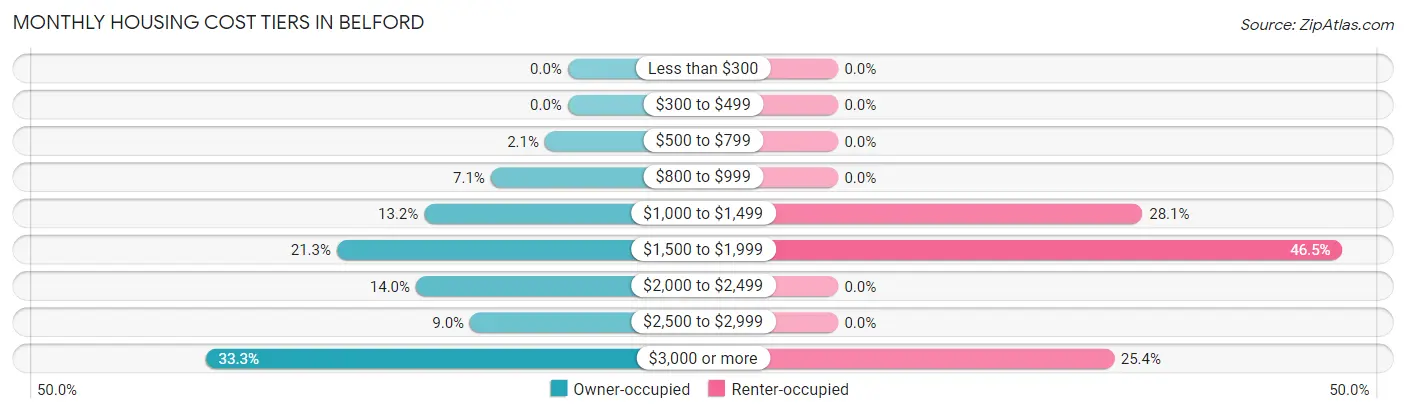
| Monthly Cost | Owner-occupied | Renter-occupied |
| Less than $300 | 0 (0.0%) | 0 (0.0%) |
| $300 to $499 | 0 (0.0%) | 0 (0.0%) |
| $500 to $799 | 11 (2.1%) | 0 (0.0%) |
| $800 to $999 | 37 (7.1%) | 0 (0.0%) |
| $1,000 to $1,499 | 69 (13.2%) | 32 (28.1%) |
| $1,500 to $1,999 | 111 (21.3%) | 53 (46.5%) |
| $2,000 to $2,499 | 73 (14.0%) | 0 (0.0%) |
| $2,500 to $2,999 | 47 (9.0%) | 0 (0.0%) |
| $3,000 or more | 174 (33.3%) | 29 (25.4%) |
| Total | 522 (100.0%) | 114 (100.0%) |
Physical Housing Characteristics in Belford
Housing Structures in Belford
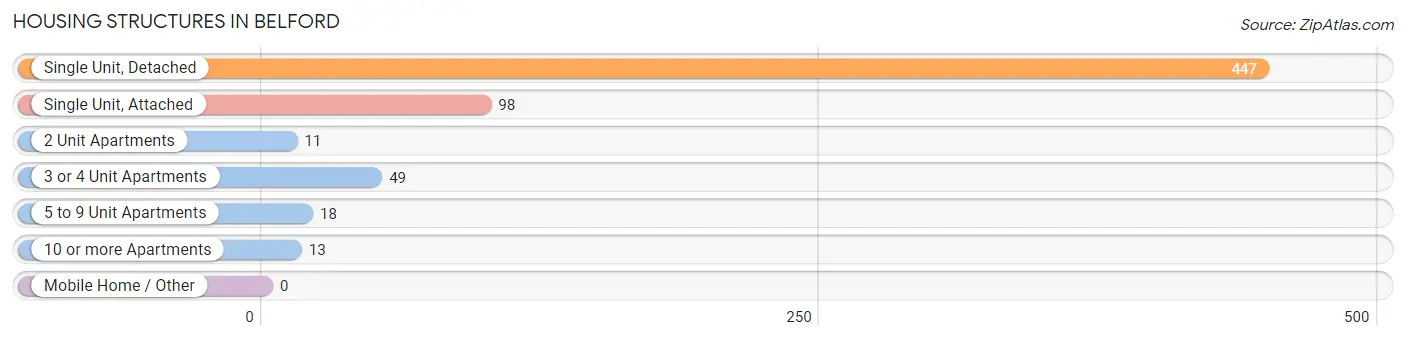
| Structure Type | # Housing Units | % Housing Units |
| Single Unit, Detached | 447 | 70.3% |
| Single Unit, Attached | 98 | 15.4% |
| 2 Unit Apartments | 11 | 1.7% |
| 3 or 4 Unit Apartments | 49 | 7.7% |
| 5 to 9 Unit Apartments | 18 | 2.8% |
| 10 or more Apartments | 13 | 2.0% |
| Mobile Home / Other | 0 | 0.0% |
| Total | 636 | 100.0% |
Housing Structures by Occupancy in Belford
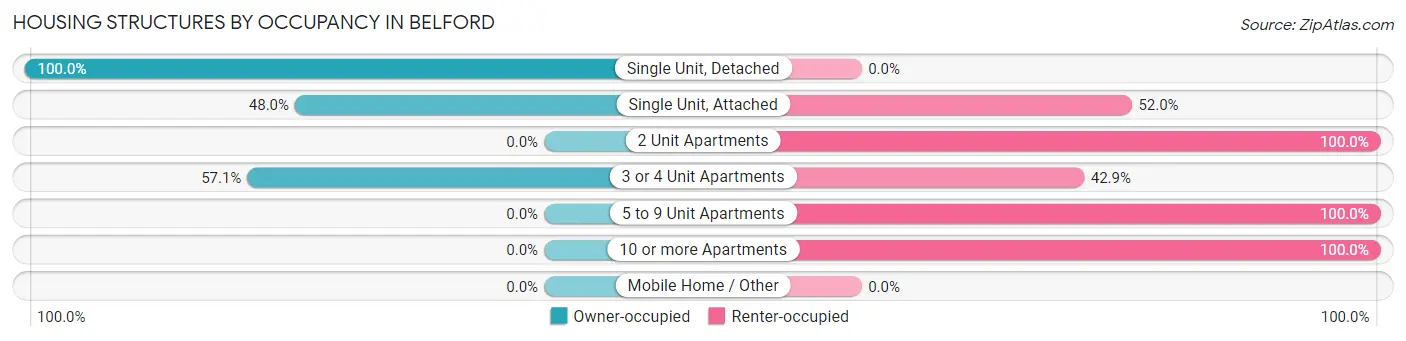
| Structure Type | Owner-occupied | Renter-occupied |
| Single Unit, Detached | 447 (100.0%) | 0 (0.0%) |
| Single Unit, Attached | 47 (48.0%) | 51 (52.0%) |
| 2 Unit Apartments | 0 (0.0%) | 11 (100.0%) |
| 3 or 4 Unit Apartments | 28 (57.1%) | 21 (42.9%) |
| 5 to 9 Unit Apartments | 0 (0.0%) | 18 (100.0%) |
| 10 or more Apartments | 0 (0.0%) | 13 (100.0%) |
| Mobile Home / Other | 0 (0.0%) | 0 (0.0%) |
| Total | 522 (82.1%) | 114 (17.9%) |
Housing Structures by Number of Rooms in Belford
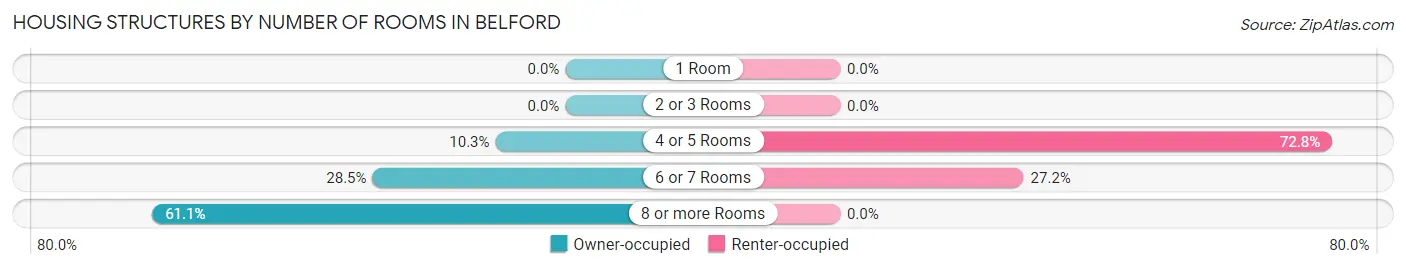
| Number of Rooms | Owner-occupied | Renter-occupied |
| 1 Room | 0 (0.0%) | 0 (0.0%) |
| 2 or 3 Rooms | 0 (0.0%) | 0 (0.0%) |
| 4 or 5 Rooms | 54 (10.3%) | 83 (72.8%) |
| 6 or 7 Rooms | 149 (28.5%) | 31 (27.2%) |
| 8 or more Rooms | 319 (61.1%) | 0 (0.0%) |
| Total | 522 (100.0%) | 114 (100.0%) |
Housing Structure by Heating Type in Belford
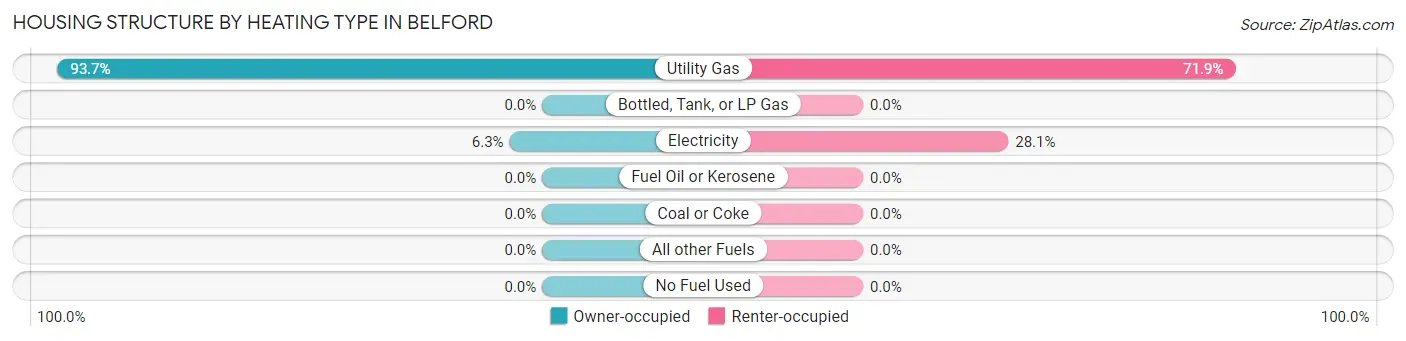
| Heating Type | Owner-occupied | Renter-occupied |
| Utility Gas | 489 (93.7%) | 82 (71.9%) |
| Bottled, Tank, or LP Gas | 0 (0.0%) | 0 (0.0%) |
| Electricity | 33 (6.3%) | 32 (28.1%) |
| Fuel Oil or Kerosene | 0 (0.0%) | 0 (0.0%) |
| Coal or Coke | 0 (0.0%) | 0 (0.0%) |
| All other Fuels | 0 (0.0%) | 0 (0.0%) |
| No Fuel Used | 0 (0.0%) | 0 (0.0%) |
| Total | 522 (100.0%) | 114 (100.0%) |
Household Vehicle Usage in Belford
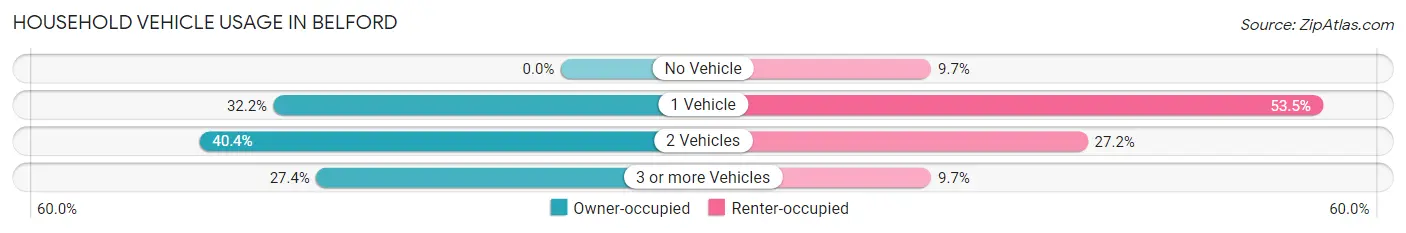
| Vehicles per Household | Owner-occupied | Renter-occupied |
| No Vehicle | 0 (0.0%) | 11 (9.7%) |
| 1 Vehicle | 168 (32.2%) | 61 (53.5%) |
| 2 Vehicles | 211 (40.4%) | 31 (27.2%) |
| 3 or more Vehicles | 143 (27.4%) | 11 (9.7%) |
| Total | 522 (100.0%) | 114 (100.0%) |
Real Estate & Mortgages in Belford
Real Estate and Mortgage Overview in Belford
| Characteristic | Without Mortgage | With Mortgage |
| Housing Units | 185 | 337 |
| Median Property Value | $467,000 | $467,200 |
| Median Household Income | $171,375 | $159 |
| Monthly Housing Costs | $1,495 | $174 |
| Real Estate Taxes | $8,451 | $13 |
Property Value by Mortgage Status in Belford
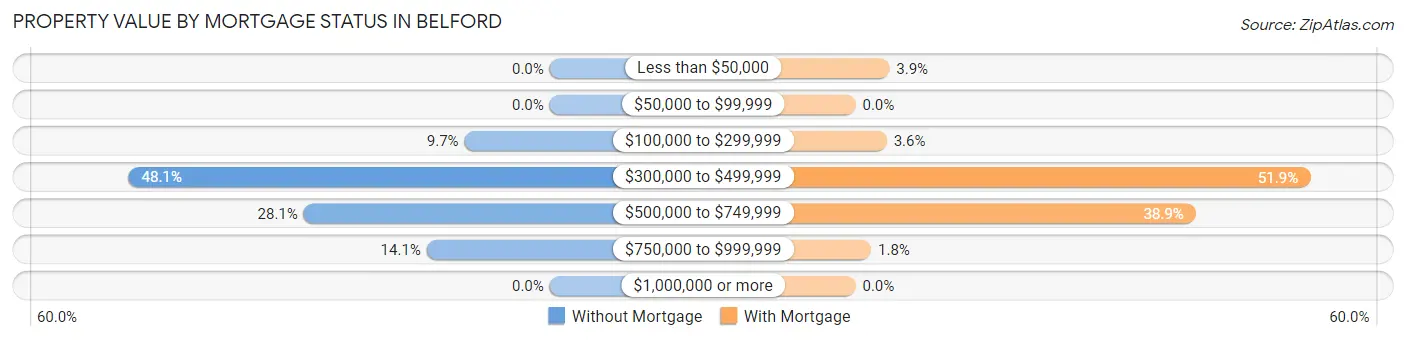
| Property Value | Without Mortgage | With Mortgage |
| Less than $50,000 | 0 (0.0%) | 13 (3.9%) |
| $50,000 to $99,999 | 0 (0.0%) | 0 (0.0%) |
| $100,000 to $299,999 | 18 (9.7%) | 12 (3.6%) |
| $300,000 to $499,999 | 89 (48.1%) | 175 (51.9%) |
| $500,000 to $749,999 | 52 (28.1%) | 131 (38.9%) |
| $750,000 to $999,999 | 26 (14.1%) | 6 (1.8%) |
| $1,000,000 or more | 0 (0.0%) | 0 (0.0%) |
| Total | 185 (100.0%) | 337 (100.0%) |
Household Income by Mortgage Status in Belford
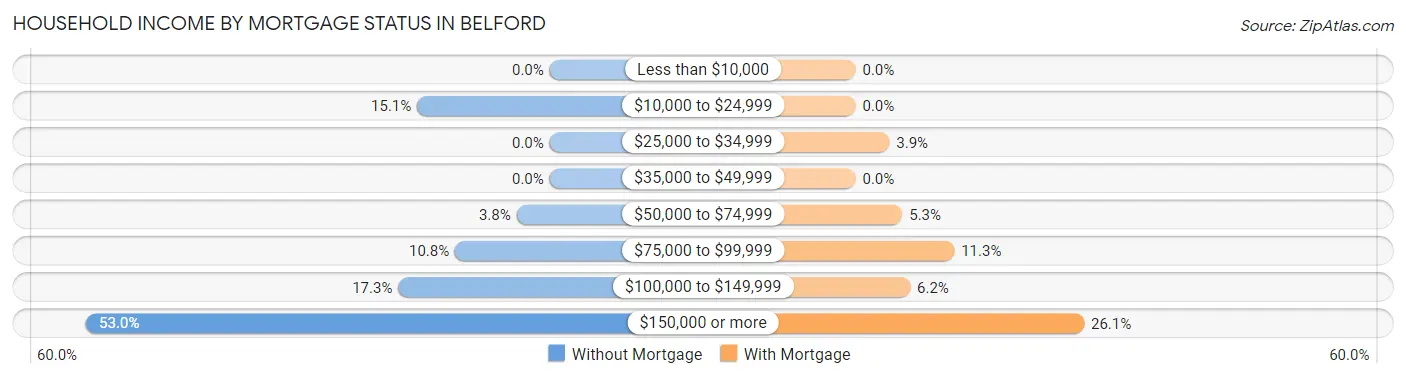
| Household Income | Without Mortgage | With Mortgage |
| Less than $10,000 | 0 (0.0%) | 0 (0.0%) |
| $10,000 to $24,999 | 28 (15.1%) | 0 (0.0%) |
| $25,000 to $34,999 | 0 (0.0%) | 13 (3.9%) |
| $35,000 to $49,999 | 0 (0.0%) | 0 (0.0%) |
| $50,000 to $74,999 | 7 (3.8%) | 18 (5.3%) |
| $75,000 to $99,999 | 20 (10.8%) | 38 (11.3%) |
| $100,000 to $149,999 | 32 (17.3%) | 21 (6.2%) |
| $150,000 or more | 98 (53.0%) | 88 (26.1%) |
| Total | 185 (100.0%) | 337 (100.0%) |
Property Value to Household Income Ratio in Belford
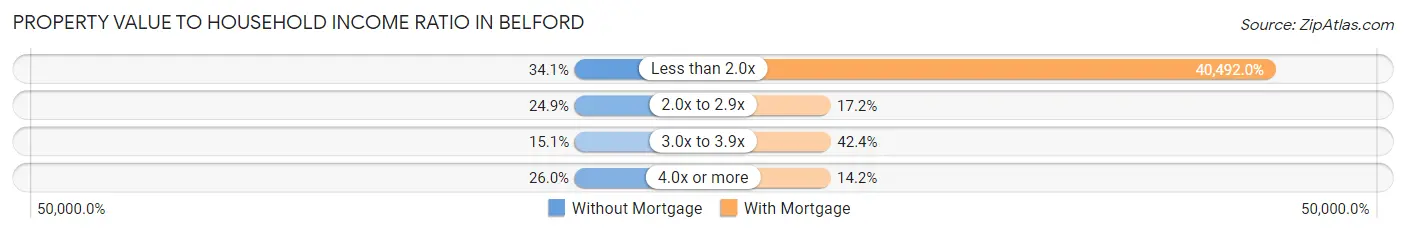
| Value-to-Income Ratio | Without Mortgage | With Mortgage |
| Less than 2.0x | 63 (34.1%) | 136,458 (40,492.0%) |
| 2.0x to 2.9x | 46 (24.9%) | 58 (17.2%) |
| 3.0x to 3.9x | 28 (15.1%) | 143 (42.4%) |
| 4.0x or more | 48 (26.0%) | 48 (14.2%) |
| Total | 185 (100.0%) | 337 (100.0%) |
Real Estate Taxes by Mortgage Status in Belford
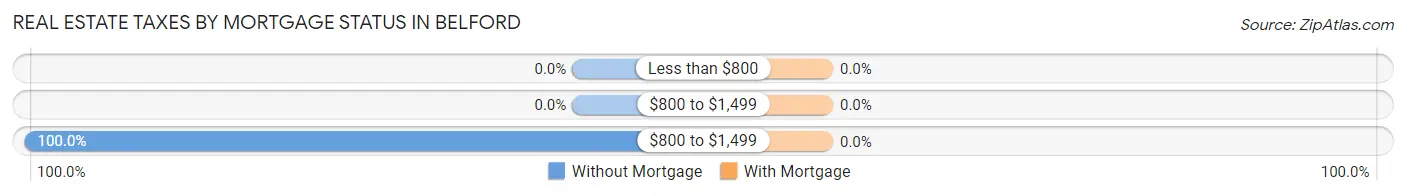
| Property Taxes | Without Mortgage | With Mortgage |
| Less than $800 | 0 (0.0%) | 0 (0.0%) |
| $800 to $1,499 | 0 (0.0%) | 0 (0.0%) |
| $800 to $1,499 | 185 (100.0%) | 0 (0.0%) |
| Total | 185 (100.0%) | 337 (100.0%) |
Health & Disability in Belford
Health Insurance Coverage by Age in Belford
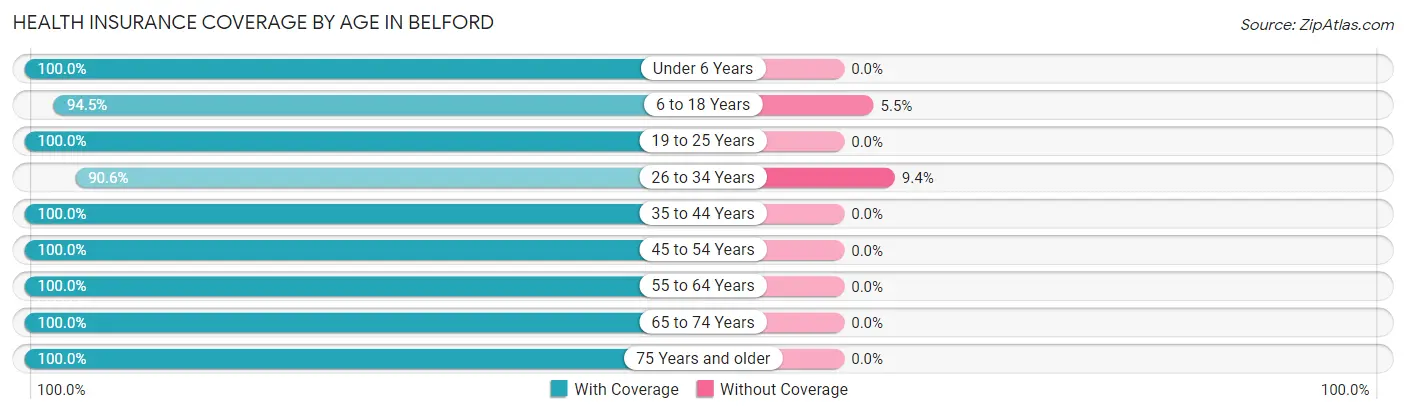
| Age Bracket | With Coverage | Without Coverage |
| Under 6 Years | 202 (100.0%) | 0 (0.0%) |
| 6 to 18 Years | 380 (94.5%) | 22 (5.5%) |
| 19 to 25 Years | 94 (100.0%) | 0 (0.0%) |
| 26 to 34 Years | 163 (90.6%) | 17 (9.4%) |
| 35 to 44 Years | 289 (100.0%) | 0 (0.0%) |
| 45 to 54 Years | 303 (100.0%) | 0 (0.0%) |
| 55 to 64 Years | 244 (100.0%) | 0 (0.0%) |
| 65 to 74 Years | 138 (100.0%) | 0 (0.0%) |
| 75 Years and older | 83 (100.0%) | 0 (0.0%) |
| Total | 1,896 (98.0%) | 39 (2.0%) |
Health Insurance Coverage by Citizenship Status in Belford
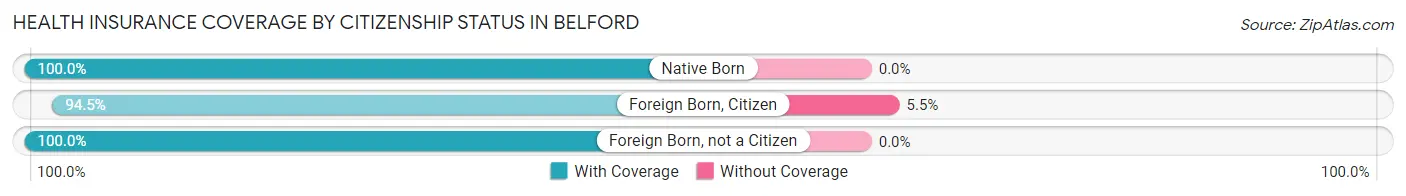
| Citizenship Status | With Coverage | Without Coverage |
| Native Born | 202 (100.0%) | 0 (0.0%) |
| Foreign Born, Citizen | 380 (94.5%) | 22 (5.5%) |
| Foreign Born, not a Citizen | 94 (100.0%) | 0 (0.0%) |
Health Insurance Coverage by Household Income in Belford
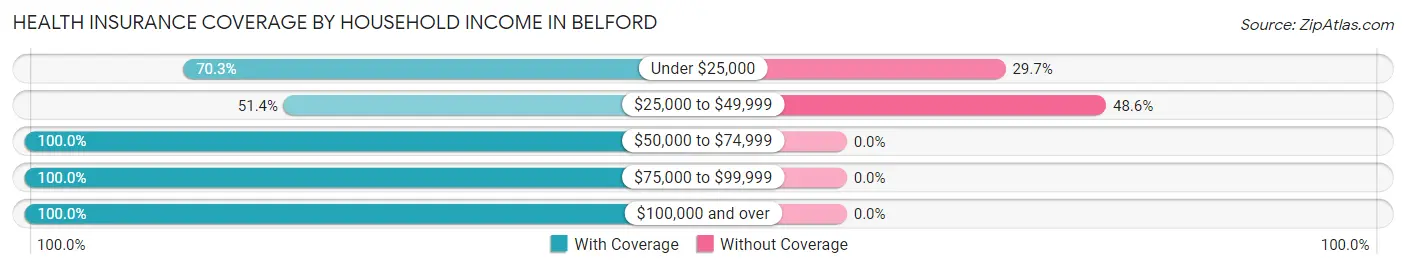
| Household Income | With Coverage | Without Coverage |
| Under $25,000 | 52 (70.3%) | 22 (29.7%) |
| $25,000 to $49,999 | 18 (51.4%) | 17 (48.6%) |
| $50,000 to $74,999 | 216 (100.0%) | 0 (0.0%) |
| $75,000 to $99,999 | 142 (100.0%) | 0 (0.0%) |
| $100,000 and over | 1,468 (100.0%) | 0 (0.0%) |
Public vs Private Health Insurance Coverage by Age in Belford
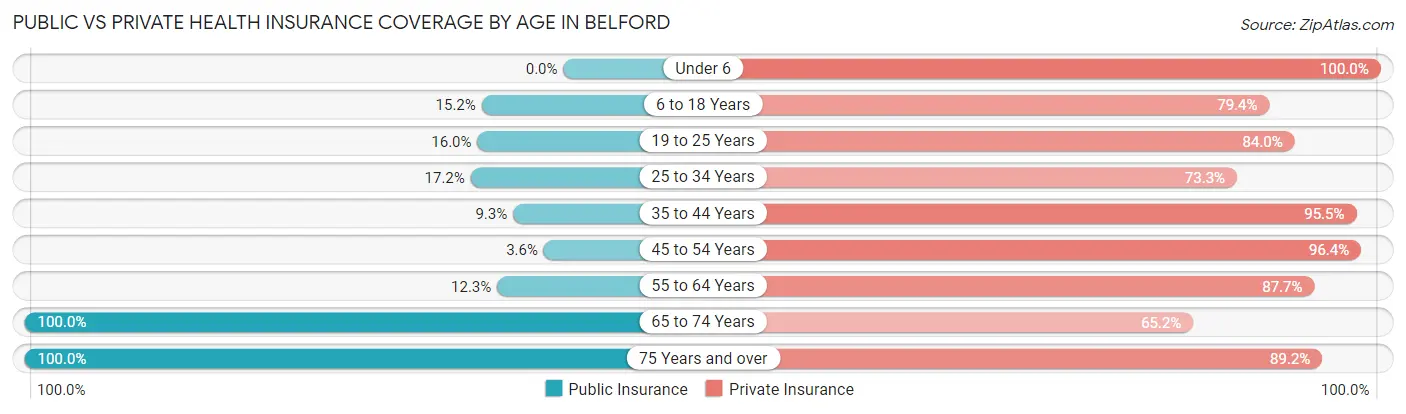
| Age Bracket | Public Insurance | Private Insurance |
| Under 6 | 0 (0.0%) | 202 (100.0%) |
| 6 to 18 Years | 61 (15.2%) | 319 (79.3%) |
| 19 to 25 Years | 15 (16.0%) | 79 (84.0%) |
| 25 to 34 Years | 31 (17.2%) | 132 (73.3%) |
| 35 to 44 Years | 27 (9.3%) | 276 (95.5%) |
| 45 to 54 Years | 11 (3.6%) | 292 (96.4%) |
| 55 to 64 Years | 30 (12.3%) | 214 (87.7%) |
| 65 to 74 Years | 138 (100.0%) | 90 (65.2%) |
| 75 Years and over | 83 (100.0%) | 74 (89.2%) |
| Total | 396 (20.5%) | 1,678 (86.7%) |
Disability Status by Sex by Age in Belford
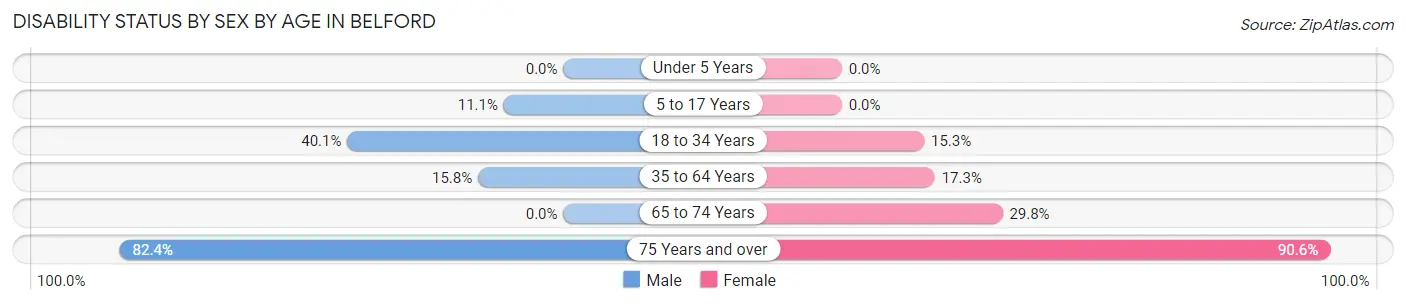
| Age Bracket | Male | Female |
| Under 5 Years | 0 (0.0%) | 0 (0.0%) |
| 5 to 17 Years | 22 (11.1%) | 0 (0.0%) |
| 18 to 34 Years | 75 (40.1%) | 20 (15.3%) |
| 35 to 64 Years | 69 (15.8%) | 69 (17.2%) |
| 65 to 74 Years | 0 (0.0%) | 34 (29.8%) |
| 75 Years and over | 42 (82.4%) | 29 (90.6%) |
Disability Class by Sex by Age in Belford
Disability Class: Hearing Difficulty
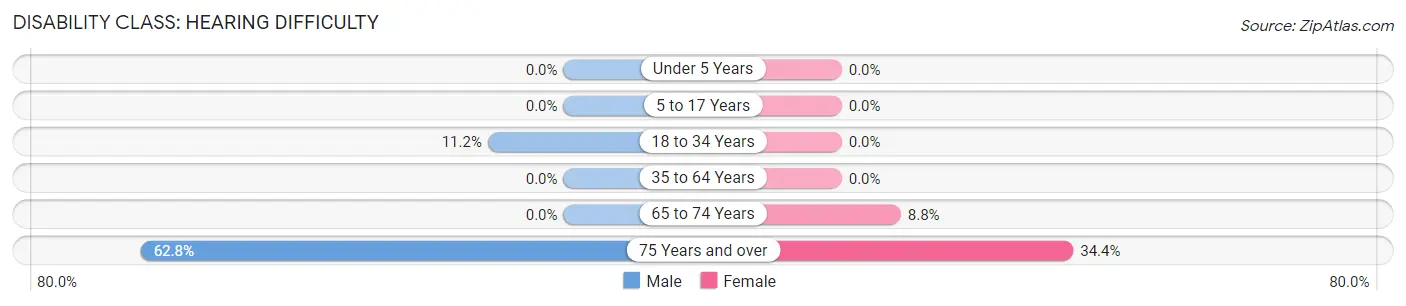
| Age Bracket | Male | Female |
| Under 5 Years | 0 (0.0%) | 0 (0.0%) |
| 5 to 17 Years | 0 (0.0%) | 0 (0.0%) |
| 18 to 34 Years | 21 (11.2%) | 0 (0.0%) |
| 35 to 64 Years | 0 (0.0%) | 0 (0.0%) |
| 65 to 74 Years | 0 (0.0%) | 10 (8.8%) |
| 75 Years and over | 32 (62.7%) | 11 (34.4%) |
Disability Class: Vision Difficulty
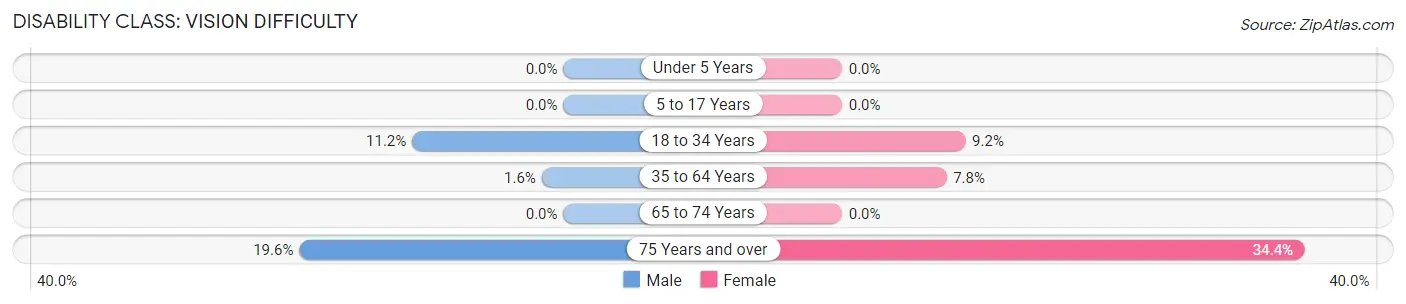
| Age Bracket | Male | Female |
| Under 5 Years | 0 (0.0%) | 0 (0.0%) |
| 5 to 17 Years | 0 (0.0%) | 0 (0.0%) |
| 18 to 34 Years | 21 (11.2%) | 12 (9.2%) |
| 35 to 64 Years | 7 (1.6%) | 31 (7.7%) |
| 65 to 74 Years | 0 (0.0%) | 0 (0.0%) |
| 75 Years and over | 10 (19.6%) | 11 (34.4%) |
Disability Class: Cognitive Difficulty
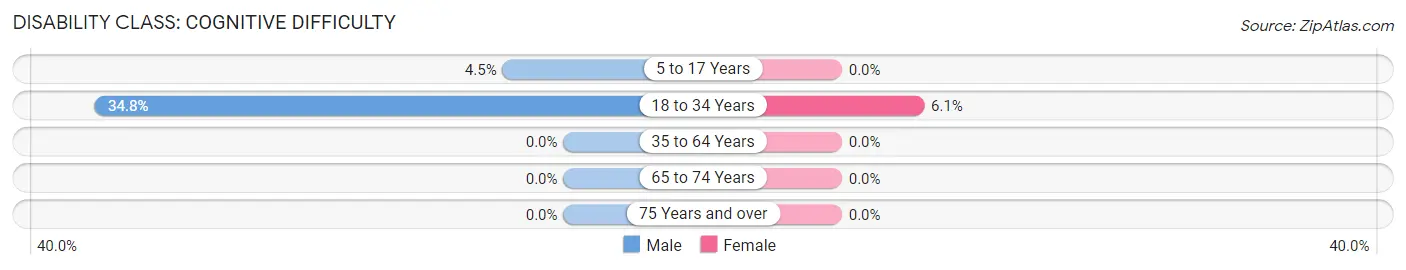
| Age Bracket | Male | Female |
| 5 to 17 Years | 9 (4.5%) | 0 (0.0%) |
| 18 to 34 Years | 65 (34.8%) | 8 (6.1%) |
| 35 to 64 Years | 0 (0.0%) | 0 (0.0%) |
| 65 to 74 Years | 0 (0.0%) | 0 (0.0%) |
| 75 Years and over | 0 (0.0%) | 0 (0.0%) |
Disability Class: Ambulatory Difficulty
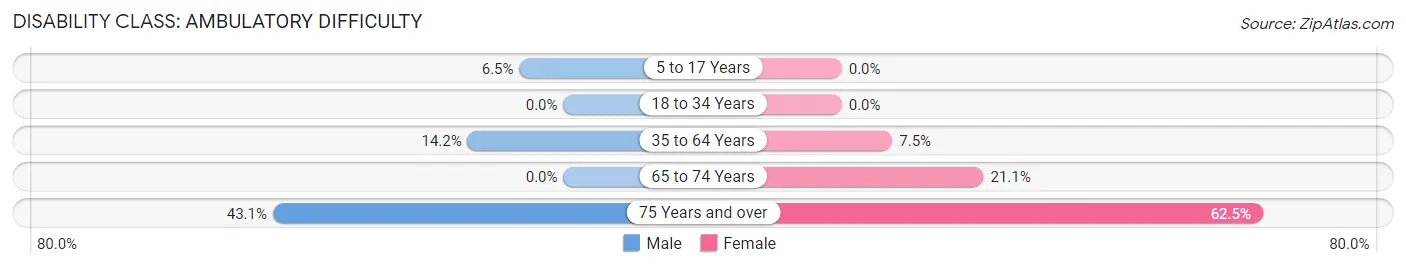
| Age Bracket | Male | Female |
| 5 to 17 Years | 13 (6.5%) | 0 (0.0%) |
| 18 to 34 Years | 0 (0.0%) | 0 (0.0%) |
| 35 to 64 Years | 62 (14.2%) | 30 (7.5%) |
| 65 to 74 Years | 0 (0.0%) | 24 (21.0%) |
| 75 Years and over | 22 (43.1%) | 20 (62.5%) |
Disability Class: Self-Care Difficulty
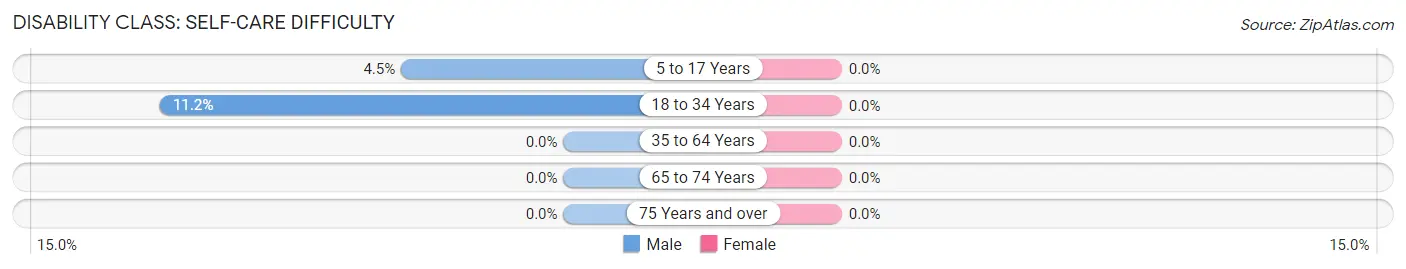
| Age Bracket | Male | Female |
| 5 to 17 Years | 9 (4.5%) | 0 (0.0%) |
| 18 to 34 Years | 21 (11.2%) | 0 (0.0%) |
| 35 to 64 Years | 0 (0.0%) | 0 (0.0%) |
| 65 to 74 Years | 0 (0.0%) | 0 (0.0%) |
| 75 Years and over | 0 (0.0%) | 0 (0.0%) |
Technology Access in Belford
Computing Device Access in Belford
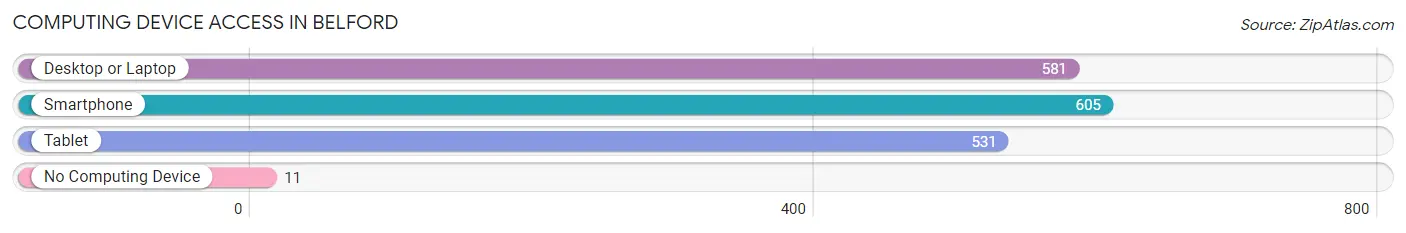
| Device Type | # Households | % Households |
| Desktop or Laptop | 581 | 91.3% |
| Smartphone | 605 | 95.1% |
| Tablet | 531 | 83.5% |
| No Computing Device | 11 | 1.7% |
| Total | 636 | 100.0% |
Internet Access in Belford
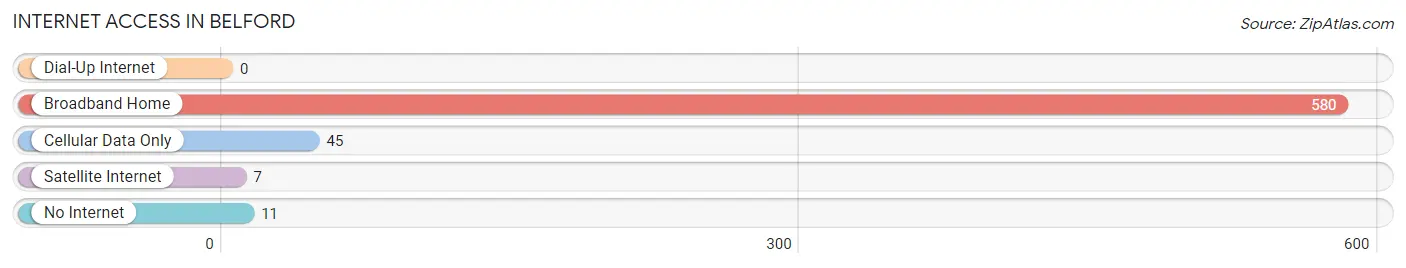
| Internet Type | # Households | % Households |
| Dial-Up Internet | 0 | 0.0% |
| Broadband Home | 580 | 91.2% |
| Cellular Data Only | 45 | 7.1% |
| Satellite Internet | 7 | 1.1% |
| No Internet | 11 | 1.7% |
| Total | 636 | 100.0% |
Belford Summary
Belford is a small borough located in Monmouth County, New Jersey. It is situated on the Raritan Bay, just south of the borough of Middletown. The borough was incorporated in 1885 and is home to a population of approximately 2,000 people.
Geography
Belford is located at 40°25'25" North, 74°7'25" West (40.423, -74.123). It is bordered by the boroughs of Middletown, Keansburg, and Union Beach. The borough is situated on the Raritan Bay, and is approximately 5 miles south of the Navesink River. The total area of Belford is 0.7 square miles, all of which is land.
History
Belford was originally part of Middletown Township, which was established in 1693. The area was known as “Belford” by the mid-1800s, and was home to a small fishing village. In 1885, the area was incorporated as the Borough of Belford.
The borough was named after the Belford family, who were among the first settlers in the area. The Belfords were of English descent and had arrived in the area in the late 1700s.
Economy
Belford’s economy is largely based on tourism and fishing. The borough is home to several marinas, which attract visitors from all over the region. The borough also has a number of restaurants and shops, which cater to both locals and tourists.
The borough is also home to a number of small businesses, including a few manufacturing companies. The largest employer in the borough is the Belford Seafood Co-op, which processes and distributes seafood to local restaurants and markets.
Demographics
As of the 2010 census, Belford had a population of 2,037. The racial makeup of the borough was 94.3% White, 2.2% African American, 0.7% Asian, 0.3% Native American, and 2.5% from other races. Hispanic or Latino of any race were 5.2% of the population.
The median household income in Belford was $62,813, and the median family income was $76,250. The per capita income for the borough was $30,945. About 4.3% of families and 5.7% of the population were below the poverty line, including 6.3% of those under age 18 and 4.2% of those age 65 or over.
Belford is served by the Middletown Township Public Schools. The borough is home to two elementary schools, Belford Elementary School and Middletown Elementary School. The borough is also served by the Middletown High School.
Common Questions
What is Per Capita Income in Belford?
Per Capita income in Belford is $57,367.
What is the Median Family Income in Belford?
Median Family Income in Belford is $136,111.
What is the Median Household income in Belford?
Median Household Income in Belford is $131,875.
What is Income or Wage Gap in Belford?
Income or Wage Gap in Belford is 26.1%.
Women in Belford earn 73.9 cents for every dollar earned by a man.
What is Inequality or Gini Index in Belford?
Inequality or Gini Index in Belford is 0.39.
What is the Total Population of Belford?
Total Population of Belford is 1,935.
What is the Total Male Population of Belford?
Total Male Population of Belford is 1,059.
What is the Total Female Population of Belford?
Total Female Population of Belford is 876.
What is the Ratio of Males per 100 Females in Belford?
There are 120.89 Males per 100 Females in Belford.
What is the Ratio of Females per 100 Males in Belford?
There are 82.72 Females per 100 Males in Belford.
What is the Median Population Age in Belford?
Median Population Age in Belford is 39.0 Years.
What is the Average Family Size in Belford
Average Family Size in Belford is 3.5 People.
What is the Average Household Size in Belford
Average Household Size in Belford is 3.0 People.
How Large is the Labor Force in Belford?
There are 949 People in the Labor Forcein in Belford.
What is the Percentage of People in the Labor Force in Belford?
65.6% of People are in the Labor Force in Belford.
What is the Unemployment Rate in Belford?
Unemployment Rate in Belford is 9.0%.