Riverdale borough, NJ Map & Demographics
Riverdale borough Overview
$57,148
PER CAPITA INCOME
$145,625
AVG FAMILY INCOME
$103,214
AVG HOUSEHOLD INCOME
50.3%
WAGE / INCOME GAP [ % ]
49.7¢/ $1
WAGE / INCOME GAP [ $ ]
0.39
INEQUALITY / GINI INDEX
4,081
TOTAL POPULATION
2,070
MALE POPULATION
2,011
FEMALE POPULATION
102.93
MALES / 100 FEMALES
97.15
FEMALES / 100 MALES
49.0
MEDIAN AGE
3.0
AVG FAMILY SIZE
2.1
AVG HOUSEHOLD SIZE
2,290
LABOR FORCE [ PEOPLE ]
66.7%
PERCENT IN LABOR FORCE
2.4%
UNEMPLOYMENT RATE
Income in Riverdale borough
Income Overview in Riverdale borough
Per Capita Income in Riverdale borough is $57,148, while median incomes of families and households are $145,625 and $103,214 respectively.
| Characteristic | Number | Measure |
| Per Capita Income | 4,081 | $57,148 |
| Median Family Income | 989 | $145,625 |
| Mean Family Income | 989 | $156,279 |
| Median Household Income | 1,904 | $103,214 |
| Mean Household Income | 1,904 | $120,912 |
| Income Deficit | 989 | $0 |
| Wage / Income Gap (%) | 4,081 | 50.30% |
| Wage / Income Gap ($) | 4,081 | 49.70¢ per $1 |
| Gini / Inequality Index | 4,081 | 0.39 |
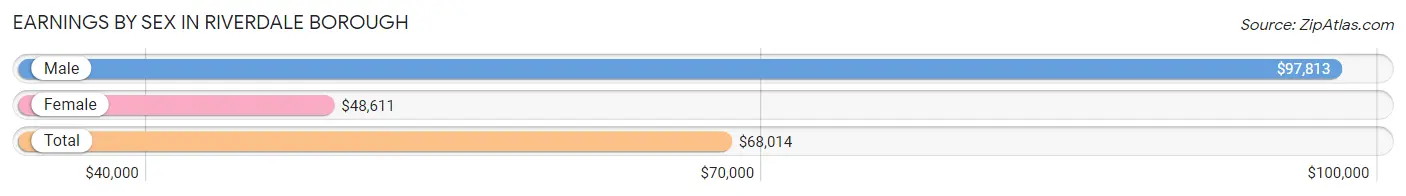
Earnings by Sex in Riverdale borough
Average Earnings in Riverdale borough are $68,014, $97,813 for men and $48,611 for women, a difference of 50.3%.
| Sex | Number | Average Earnings |
| Male | 1,179 (49.4%) | $97,813 |
| Female | 1,208 (50.6%) | $48,611 |
| Total | 2,387 (100.0%) | $68,014 |
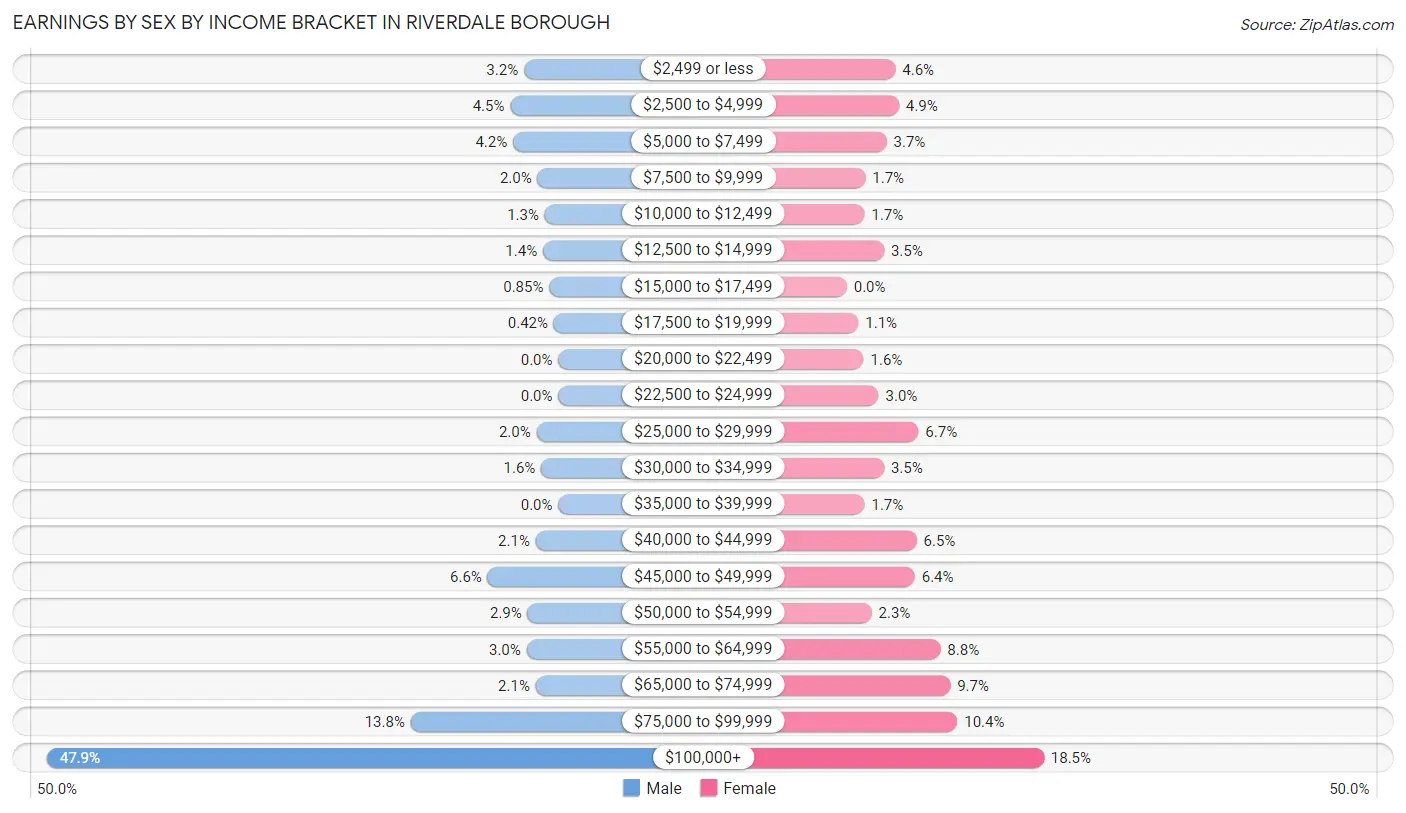
Earnings by Sex by Income Bracket in Riverdale borough
The most common earnings brackets in Riverdale borough are $100,000+ for men (565 | 47.9%) and $100,000+ for women (223 | 18.5%).
| Income | Male | Female |
| $2,499 or less | 38 (3.2%) | 55 (4.5%) |
| $2,500 to $4,999 | 53 (4.5%) | 59 (4.9%) |
| $5,000 to $7,499 | 50 (4.2%) | 45 (3.7%) |
| $7,500 to $9,999 | 23 (1.9%) | 21 (1.7%) |
| $10,000 to $12,499 | 15 (1.3%) | 20 (1.7%) |
| $12,500 to $14,999 | 17 (1.4%) | 42 (3.5%) |
| $15,000 to $17,499 | 10 (0.9%) | 0 (0.0%) |
| $17,500 to $19,999 | 5 (0.4%) | 13 (1.1%) |
| $20,000 to $22,499 | 0 (0.0%) | 19 (1.6%) |
| $22,500 to $24,999 | 0 (0.0%) | 36 (3.0%) |
| $25,000 to $29,999 | 24 (2.0%) | 81 (6.7%) |
| $30,000 to $34,999 | 19 (1.6%) | 42 (3.5%) |
| $35,000 to $39,999 | 0 (0.0%) | 20 (1.7%) |
| $40,000 to $44,999 | 25 (2.1%) | 79 (6.5%) |
| $45,000 to $49,999 | 78 (6.6%) | 77 (6.4%) |
| $50,000 to $54,999 | 34 (2.9%) | 28 (2.3%) |
| $55,000 to $64,999 | 35 (3.0%) | 106 (8.8%) |
| $65,000 to $74,999 | 25 (2.1%) | 117 (9.7%) |
| $75,000 to $99,999 | 163 (13.8%) | 125 (10.3%) |
| $100,000+ | 565 (47.9%) | 223 (18.5%) |
| Total | 1,179 (100.0%) | 1,208 (100.0%) |
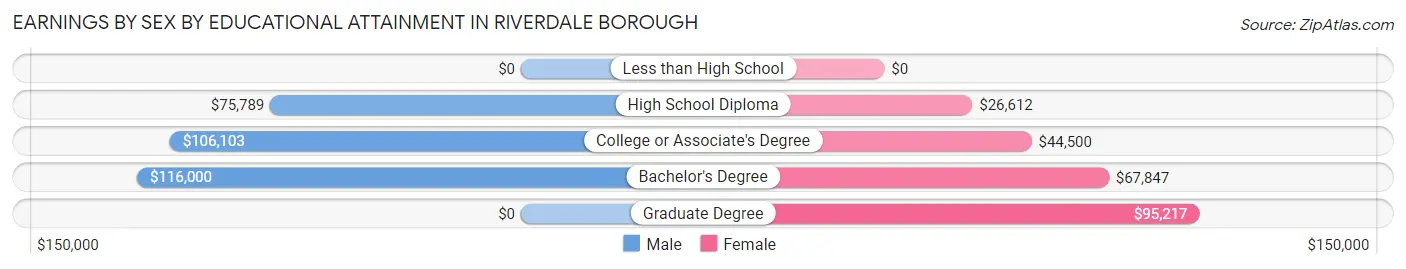
Earnings by Sex by Educational Attainment in Riverdale borough
Average earnings in Riverdale borough are $105,665 for men and $57,930 for women, a difference of 45.2%. Men with an educational attainment of bachelor's degree enjoy the highest average annual earnings of $116,000, while those with high school diploma education earn the least with $75,789. Women with an educational attainment of graduate degree earn the most with the average annual earnings of $95,217, while those with high school diploma education have the smallest earnings of $26,612.
| Educational Attainment | Male Income | Female Income |
| Less than High School | - | - |
| High School Diploma | $75,789 | $26,612 |
| College or Associate's Degree | $106,103 | $44,500 |
| Bachelor's Degree | $116,000 | $67,847 |
| Graduate Degree | - | - |
| Total | $105,665 | $57,930 |
Family Income in Riverdale borough
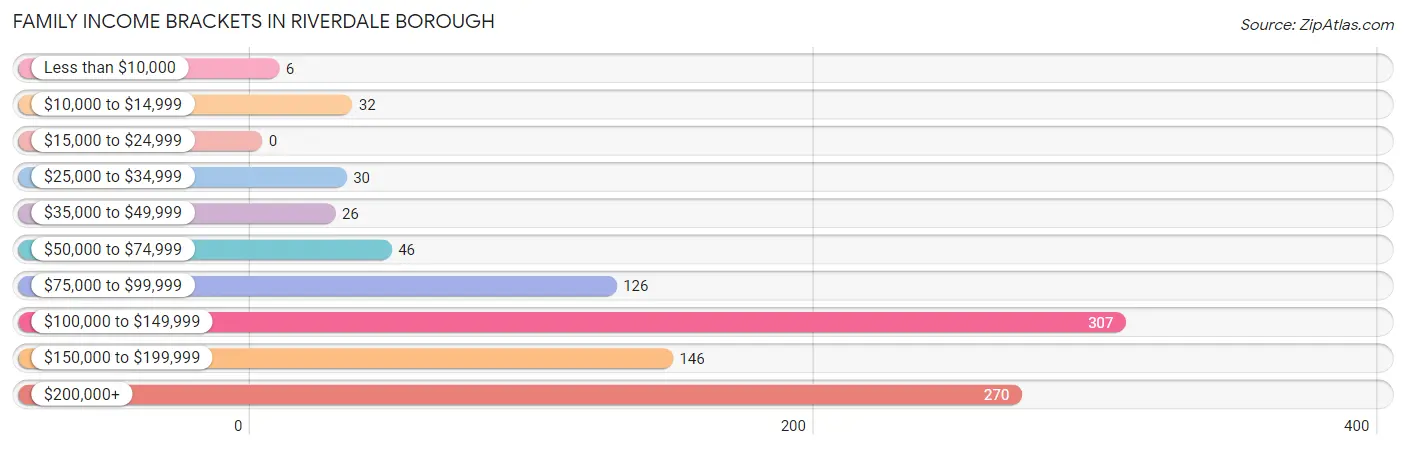
Family Income Brackets in Riverdale borough
According to the Riverdale borough family income data, there are 307 families falling into the $100,000 to $149,999 income range, which is the most common income bracket and makes up 31.0% of all families.
| Income Bracket | # Families | % Families |
| Less than $10,000 | 6 | 0.6% |
| $10,000 to $14,999 | 32 | 3.2% |
| $15,000 to $24,999 | 0 | 0.0% |
| $25,000 to $34,999 | 30 | 3.0% |
| $35,000 to $49,999 | 26 | 2.6% |
| $50,000 to $74,999 | 46 | 4.7% |
| $75,000 to $99,999 | 126 | 12.7% |
| $100,000 to $149,999 | 307 | 31.0% |
| $150,000 to $199,999 | 146 | 14.8% |
| $200,000+ | 270 | 27.3% |
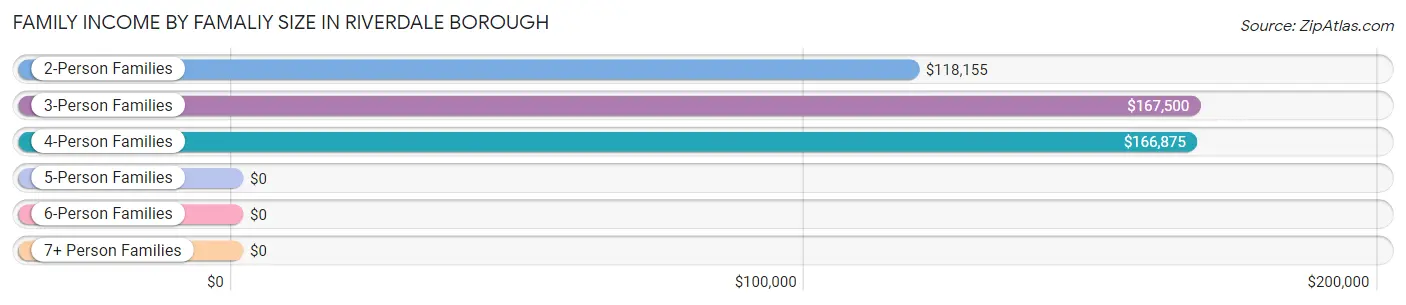
Family Income by Famaliy Size in Riverdale borough
3-person families (226 | 22.9%) account for the highest median family income in Riverdale borough with $167,500 per family, while 2-person families (429 | 43.4%) have the highest median income of $59,078 per family member.
| Income Bracket | # Families | Median Income |
| 2-Person Families | 429 (43.4%) | $118,155 |
| 3-Person Families | 226 (22.9%) | $167,500 |
| 4-Person Families | 274 (27.7%) | $166,875 |
| 5-Person Families | 55 (5.6%) | $0 |
| 6-Person Families | 5 (0.5%) | $0 |
| 7+ Person Families | 0 (0.0%) | $0 |
| Total | 989 (100.0%) | $145,625 |
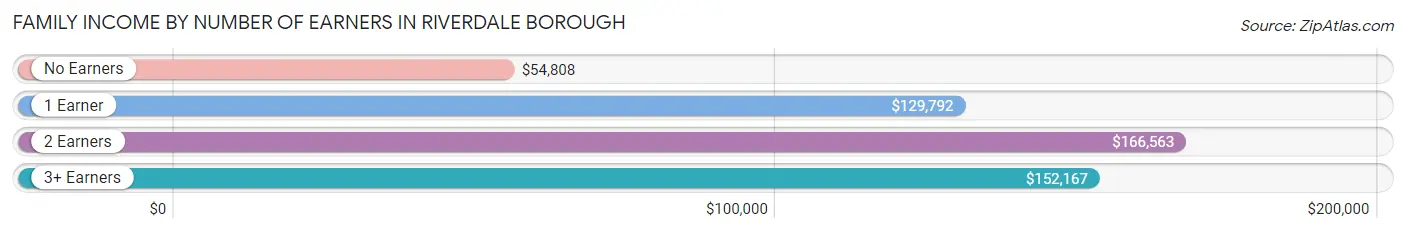
Family Income by Number of Earners in Riverdale borough
The median family income in Riverdale borough is $145,625, with families comprising 2 earners (589) having the highest median family income of $166,563, while families with no earners (112) have the lowest median family income of $54,808, accounting for 59.6% and 11.3% of families, respectively.
| Number of Earners | # Families | Median Income |
| No Earners | 112 (11.3%) | $54,808 |
| 1 Earner | 224 (22.7%) | $129,792 |
| 2 Earners | 589 (59.6%) | $166,563 |
| 3+ Earners | 64 (6.5%) | $152,167 |
| Total | 989 (100.0%) | $145,625 |
Household Income in Riverdale borough
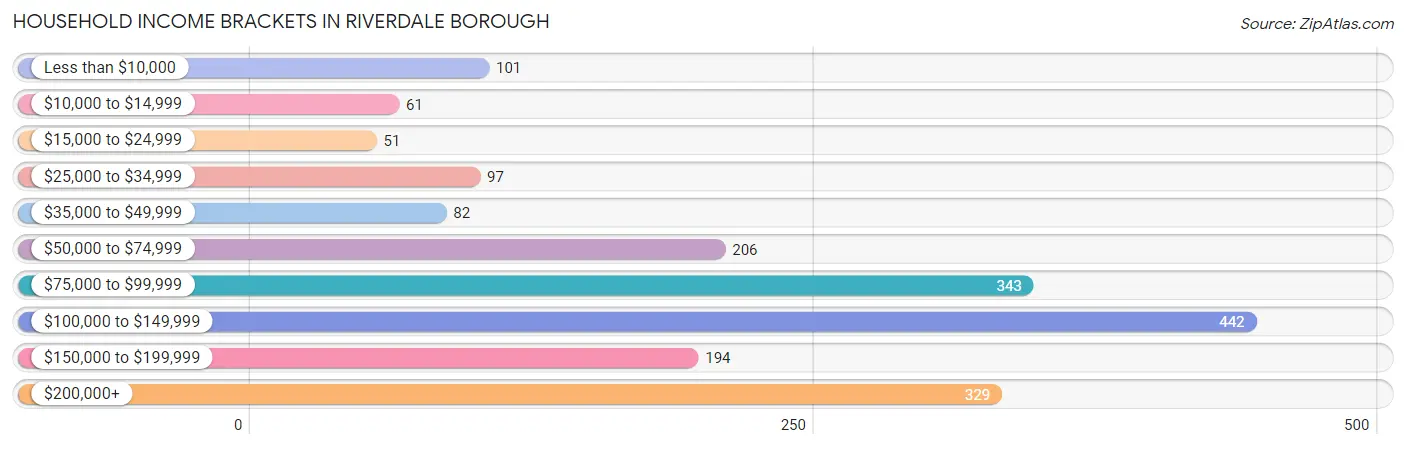
Household Income Brackets in Riverdale borough
With 442 households falling in the category, the $100,000 to $149,999 income range is the most frequent in Riverdale borough, accounting for 23.2% of all households. In contrast, only 51 households (2.7%) fall into the $15,000 to $24,999 income bracket, making it the least populous group.
| Income Bracket | # Households | % Households |
| Less than $10,000 | 101 | 5.3% |
| $10,000 to $14,999 | 61 | 3.2% |
| $15,000 to $24,999 | 51 | 2.7% |
| $25,000 to $34,999 | 97 | 5.1% |
| $35,000 to $49,999 | 82 | 4.3% |
| $50,000 to $74,999 | 206 | 10.8% |
| $75,000 to $99,999 | 343 | 18.0% |
| $100,000 to $149,999 | 442 | 23.2% |
| $150,000 to $199,999 | 194 | 10.2% |
| $200,000+ | 329 | 17.3% |
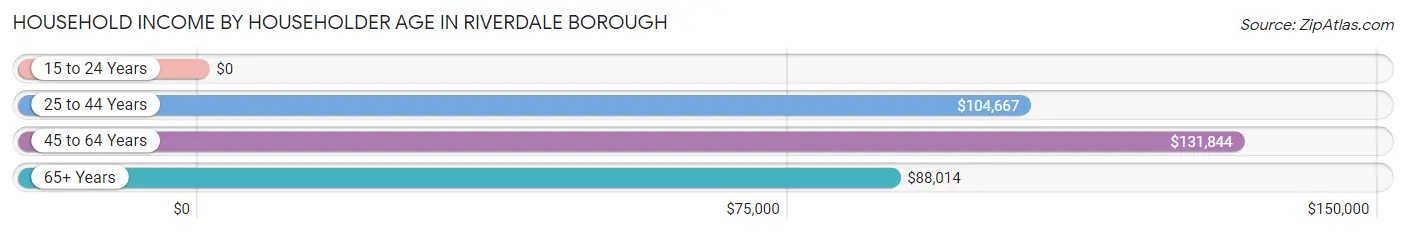
Household Income by Householder Age in Riverdale borough
The median household income in Riverdale borough is $103,214, with the highest median household income of $131,844 found in the 45 to 64 years age bracket for the primary householder. A total of 851 households (44.7%) fall into this category.
| Income Bracket | # Households | Median Income |
| 15 to 24 Years | 0 (0.0%) | $0 |
| 25 to 44 Years | 536 (28.1%) | $104,667 |
| 45 to 64 Years | 851 (44.7%) | $131,844 |
| 65+ Years | 517 (27.2%) | $88,014 |
| Total | 1,904 (100.0%) | $103,214 |
Poverty in Riverdale borough
Income Below Poverty by Sex and Age in Riverdale borough
With 8.2% poverty level for males and 6.9% for females among the residents of Riverdale borough, 15 year old males and 55 to 64 year old females are the most vulnerable to poverty, with 37 males (48.0%) and 72 females (22.0%) in their respective age groups living below the poverty level.
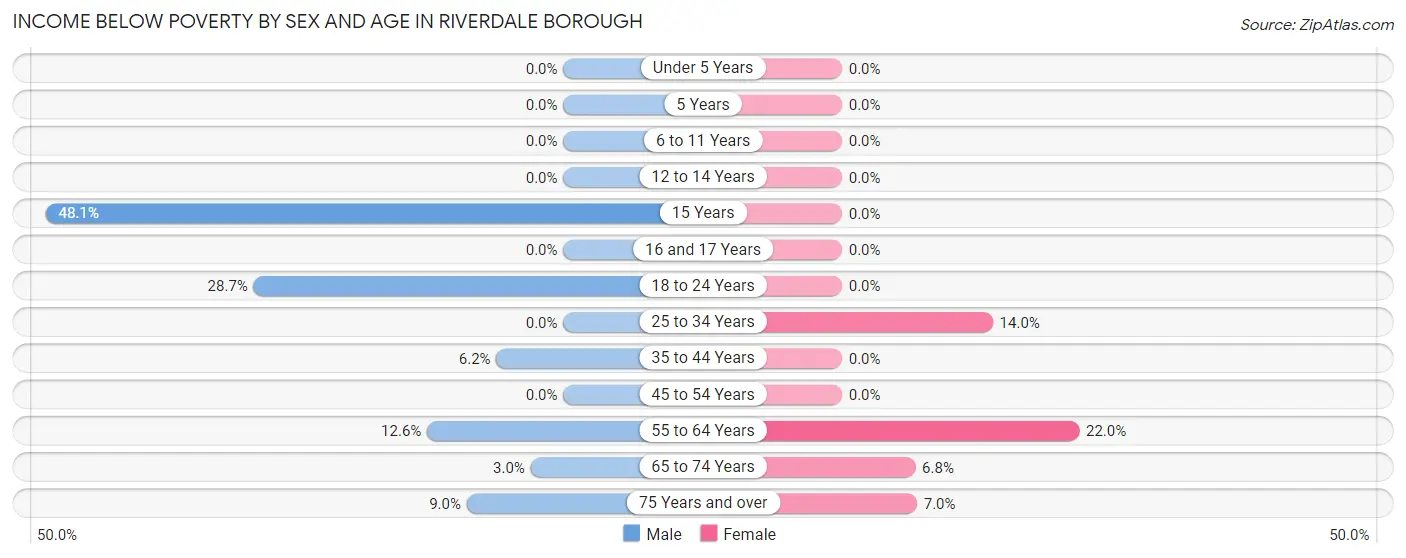
| Age Bracket | Male | Female |
| Under 5 Years | 0 (0.0%) | 0 (0.0%) |
| 5 Years | 0 (0.0%) | 0 (0.0%) |
| 6 to 11 Years | 0 (0.0%) | 0 (0.0%) |
| 12 to 14 Years | 0 (0.0%) | 0 (0.0%) |
| 15 Years | 37 (48.0%) | 0 (0.0%) |
| 16 and 17 Years | 0 (0.0%) | 0 (0.0%) |
| 18 to 24 Years | 50 (28.7%) | 0 (0.0%) |
| 25 to 34 Years | 0 (0.0%) | 35 (14.0%) |
| 35 to 44 Years | 10 (6.2%) | 0 (0.0%) |
| 45 to 54 Years | 0 (0.0%) | 0 (0.0%) |
| 55 to 64 Years | 58 (12.6%) | 72 (22.0%) |
| 65 to 74 Years | 9 (3.0%) | 16 (6.8%) |
| 75 Years and over | 6 (9.0%) | 16 (7.0%) |
| Total | 170 (8.2%) | 139 (6.9%) |
Income Above Poverty by Sex and Age in Riverdale borough
According to the poverty statistics in Riverdale borough, males aged under 5 years and females aged under 5 years are the age groups that are most secure financially, with 100.0% of males and 100.0% of females in these age groups living above the poverty line.
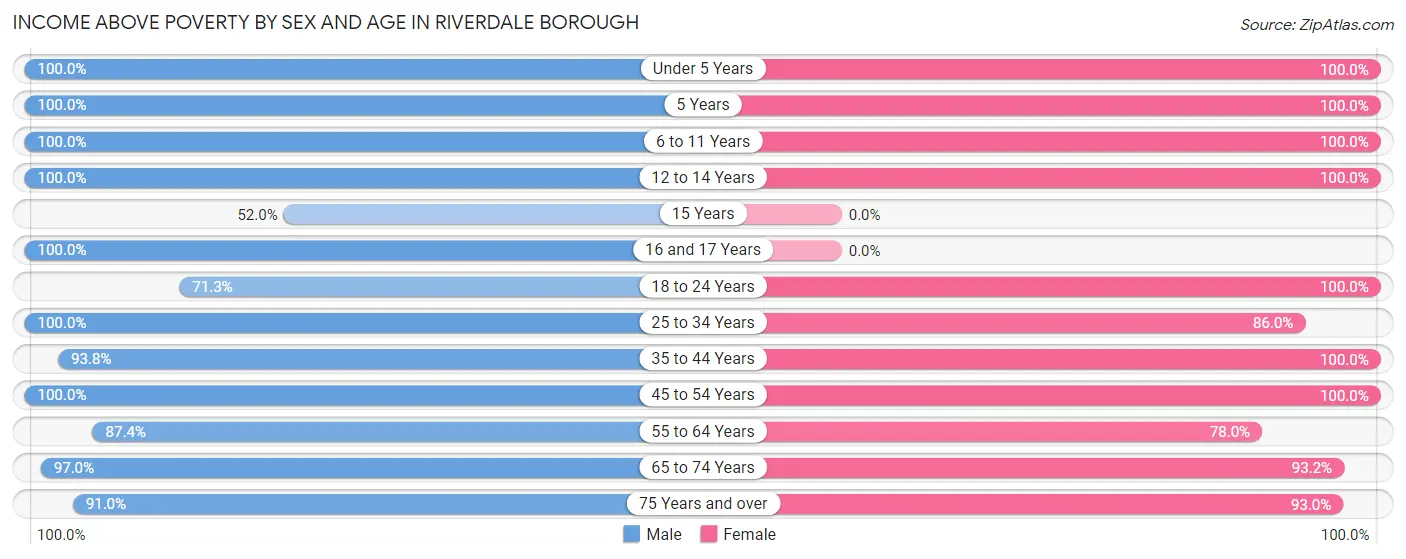
| Age Bracket | Male | Female |
| Under 5 Years | 42 (100.0%) | 167 (100.0%) |
| 5 Years | 18 (100.0%) | 29 (100.0%) |
| 6 to 11 Years | 138 (100.0%) | 46 (100.0%) |
| 12 to 14 Years | 88 (100.0%) | 42 (100.0%) |
| 15 Years | 40 (51.9%) | 0 (0.0%) |
| 16 and 17 Years | 113 (100.0%) | 0 (0.0%) |
| 18 to 24 Years | 124 (71.3%) | 77 (100.0%) |
| 25 to 34 Years | 178 (100.0%) | 215 (86.0%) |
| 35 to 44 Years | 151 (93.8%) | 280 (100.0%) |
| 45 to 54 Years | 258 (100.0%) | 328 (100.0%) |
| 55 to 64 Years | 401 (87.4%) | 255 (78.0%) |
| 65 to 74 Years | 288 (97.0%) | 219 (93.2%) |
| 75 Years and over | 61 (91.0%) | 214 (93.0%) |
| Total | 1,900 (91.8%) | 1,872 (93.1%) |
Income Below Poverty Among Married-Couple Families in Riverdale borough
The poverty statistics for married-couple families in Riverdale borough show that 4.6% or 38 of the total 817 families live below the poverty line. Families with 1 or 2 children have the highest poverty rate of 7.7%, comprising of 32 families. On the other hand, families with no children have the lowest poverty rate of 1.5%, which includes 6 families.
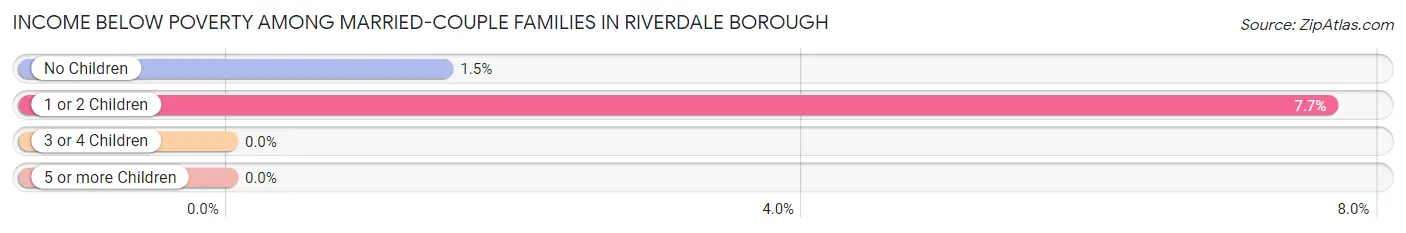
| Children | Above Poverty | Below Poverty |
| No Children | 393 (98.5%) | 6 (1.5%) |
| 1 or 2 Children | 386 (92.3%) | 32 (7.7%) |
| 3 or 4 Children | 0 (0.0%) | 0 (0.0%) |
| 5 or more Children | 0 (0.0%) | 0 (0.0%) |
| Total | 779 (95.4%) | 38 (4.6%) |
Income Below Poverty Among Single-Parent Households in Riverdale borough
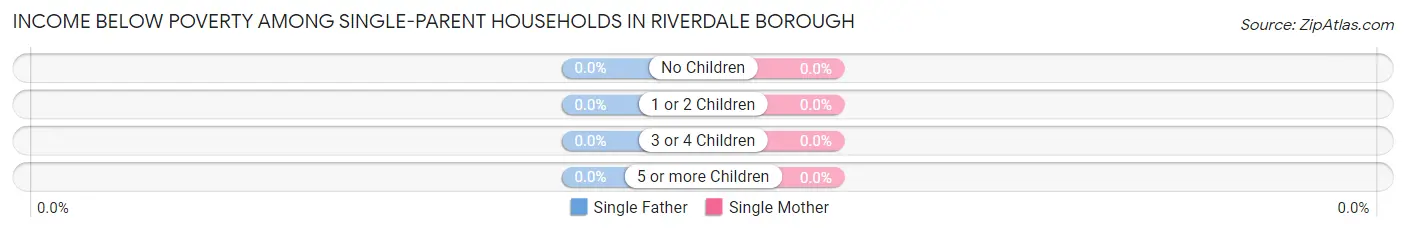
| Children | Single Father | Single Mother |
| No Children | 0 (0.0%) | 0 (0.0%) |
| 1 or 2 Children | 0 (0.0%) | 0 (0.0%) |
| 3 or 4 Children | 0 (0.0%) | 0 (0.0%) |
| 5 or more Children | 0 (0.0%) | 0 (0.0%) |
| Total | 0 (0.0%) | 0 (0.0%) |
Income Below Poverty Among Married-Couple vs Single-Parent Households in Riverdale borough
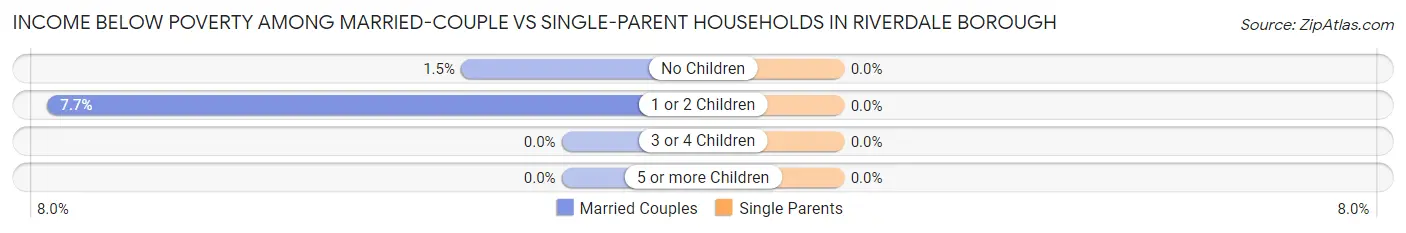
| Children | Married-Couple Families | Single-Parent Households |
| No Children | 6 (1.5%) | 0 (0.0%) |
| 1 or 2 Children | 32 (7.7%) | 0 (0.0%) |
| 3 or 4 Children | 0 (0.0%) | 0 (0.0%) |
| 5 or more Children | 0 (0.0%) | 0 (0.0%) |
| Total | 38 (4.6%) | 0 (0.0%) |
Race in Riverdale borough
The most populous races in Riverdale borough are White / Caucasian (3,455 | 84.7%), Hispanic or Latino (637 | 15.6%), and Two or more Races (367 | 9.0%).
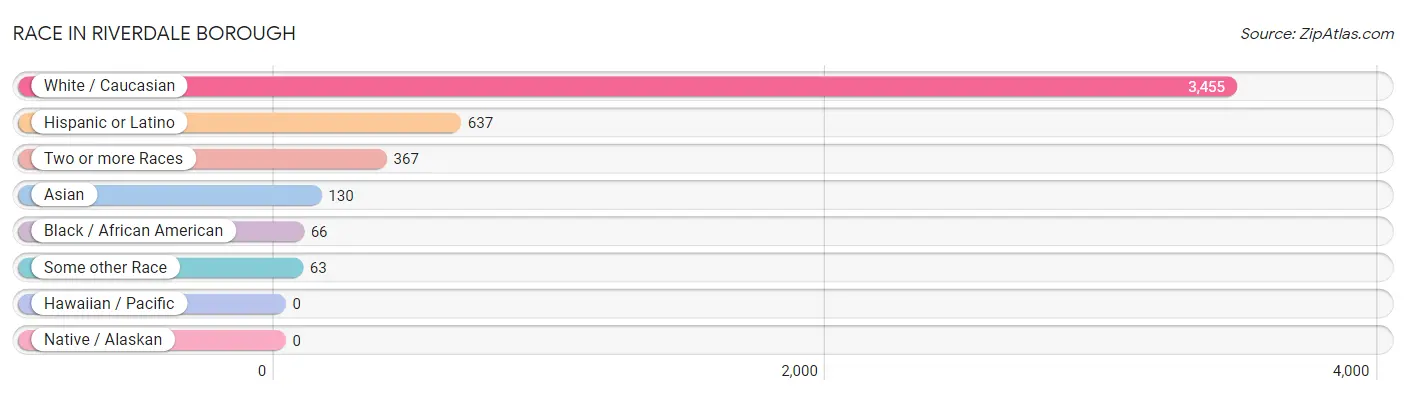
| Race | # Population | % Population |
| Asian | 130 | 3.2% |
| Black / African American | 66 | 1.6% |
| Hawaiian / Pacific | 0 | 0.0% |
| Hispanic or Latino | 637 | 15.6% |
| Native / Alaskan | 0 | 0.0% |
| White / Caucasian | 3,455 | 84.7% |
| Two or more Races | 367 | 9.0% |
| Some other Race | 63 | 1.5% |
| Total | 4,081 | 100.0% |
Ancestry in Riverdale borough
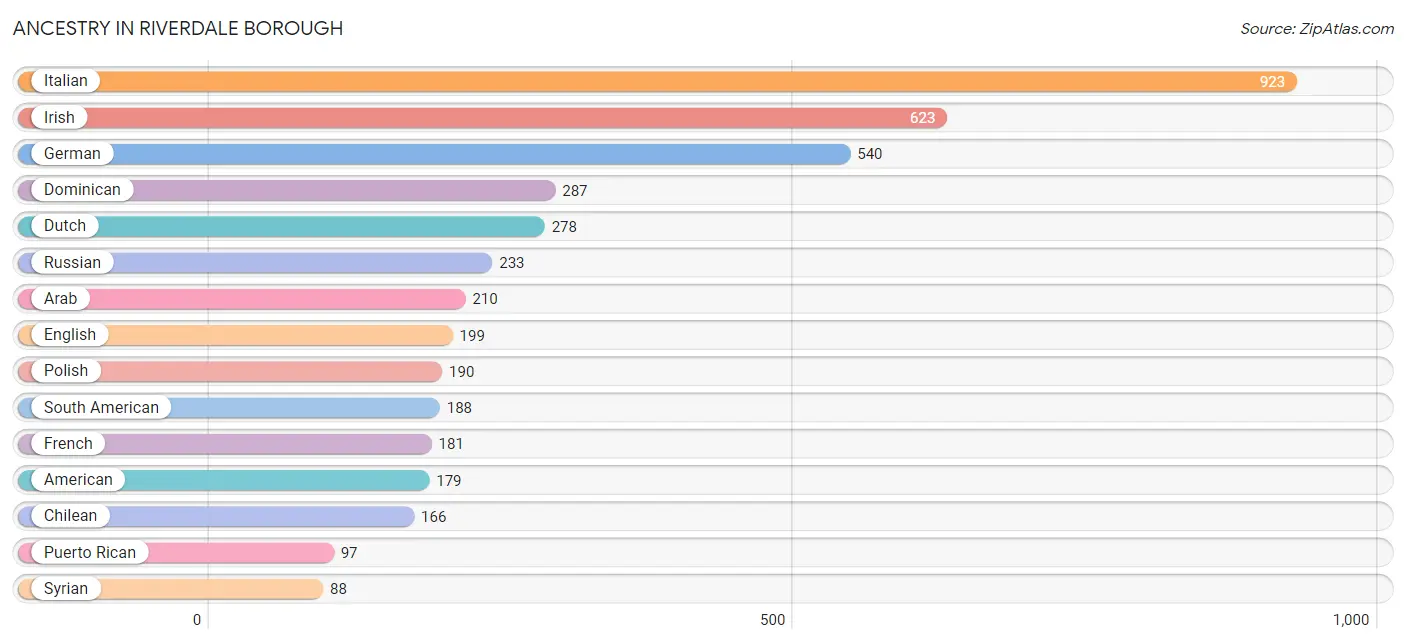
The most populous ancestries reported in Riverdale borough are Italian (923 | 22.6%), Irish (623 | 15.3%), German (540 | 13.2%), Dominican (287 | 7.0%), and Dutch (278 | 6.8%), together accounting for 65.0% of all Riverdale borough residents.
| Ancestry | # Population | % Population |
| African | 40 | 1.0% |
| American | 179 | 4.4% |
| Arab | 210 | 5.1% |
| Armenian | 40 | 1.0% |
| Austrian | 17 | 0.4% |
| Belgian | 43 | 1.1% |
| Bhutanese | 23 | 0.6% |
| Brazilian | 5 | 0.1% |
| British | 59 | 1.5% |
| Canadian | 18 | 0.4% |
| Chilean | 166 | 4.1% |
| Colombian | 22 | 0.5% |
| Croatian | 49 | 1.2% |
| Cuban | 11 | 0.3% |
| Czech | 36 | 0.9% |
| Dominican | 287 | 7.0% |
| Dutch | 278 | 6.8% |
| English | 199 | 4.9% |
| European | 14 | 0.3% |
| Filipino | 8 | 0.2% |
| French | 181 | 4.4% |
| French Canadian | 7 | 0.2% |
| German | 540 | 13.2% |
| Greek | 23 | 0.6% |
| Hungarian | 15 | 0.4% |
| Indian (Asian) | 34 | 0.8% |
| Irish | 623 | 15.3% |
| Italian | 923 | 22.6% |
| Korean | 62 | 1.5% |
| Lithuanian | 37 | 0.9% |
| Mexican | 29 | 0.7% |
| Northern European | 6 | 0.2% |
| Norwegian | 16 | 0.4% |
| Pennsylvania German | 9 | 0.2% |
| Polish | 190 | 4.7% |
| Portuguese | 18 | 0.4% |
| Puerto Rican | 97 | 2.4% |
| Romanian | 6 | 0.2% |
| Russian | 233 | 5.7% |
| Scandinavian | 7 | 0.2% |
| Scotch-Irish | 46 | 1.1% |
| Scottish | 60 | 1.5% |
| Serbian | 5 | 0.1% |
| Slavic | 8 | 0.2% |
| South American | 188 | 4.6% |
| Spaniard | 14 | 0.3% |
| Subsaharan African | 40 | 1.0% |
| Swiss | 42 | 1.0% |
| Syrian | 88 | 2.2% |
| Thai | 46 | 1.1% |
| Turkish | 40 | 1.0% |
| Welsh | 13 | 0.3% |
| Yugoslavian | 14 | 0.3% | View All 53 Rows |
Immigrants in Riverdale borough
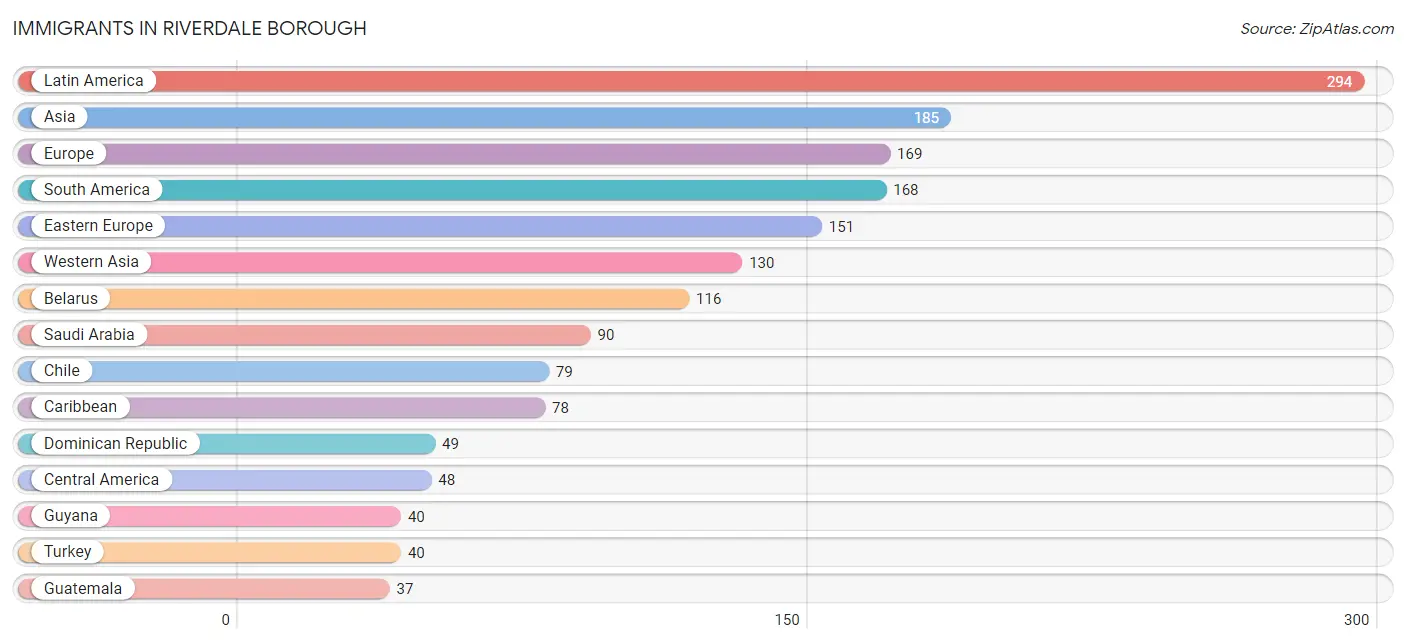
The most numerous immigrant groups reported in Riverdale borough came from Latin America (294 | 7.2%), Asia (185 | 4.5%), Europe (169 | 4.1%), South America (168 | 4.1%), and Eastern Europe (151 | 3.7%), together accounting for 23.7% of all Riverdale borough residents.
| Immigration Origin | # Population | % Population |
| Asia | 185 | 4.5% |
| Belarus | 116 | 2.8% |
| Brazil | 20 | 0.5% |
| Canada | 12 | 0.3% |
| Caribbean | 78 | 1.9% |
| Central America | 48 | 1.2% |
| Chile | 79 | 1.9% |
| Colombia | 29 | 0.7% |
| Cuba | 11 | 0.3% |
| Dominican Republic | 49 | 1.2% |
| Eastern Europe | 151 | 3.7% |
| Europe | 169 | 4.1% |
| Greece | 11 | 0.3% |
| Guatemala | 37 | 0.9% |
| Guyana | 40 | 1.0% |
| India | 28 | 0.7% |
| Latin America | 294 | 7.2% |
| Mexico | 11 | 0.3% |
| Northern Europe | 7 | 0.2% |
| Philippines | 27 | 0.7% |
| Poland | 22 | 0.5% |
| Russia | 13 | 0.3% |
| Saudi Arabia | 90 | 2.2% |
| South America | 168 | 4.1% |
| South Central Asia | 28 | 0.7% |
| South Eastern Asia | 27 | 0.7% |
| Southern Europe | 11 | 0.3% |
| Sweden | 7 | 0.2% |
| Trinidad and Tobago | 18 | 0.4% |
| Turkey | 40 | 1.0% |
| Western Asia | 130 | 3.2% | View All 31 Rows |
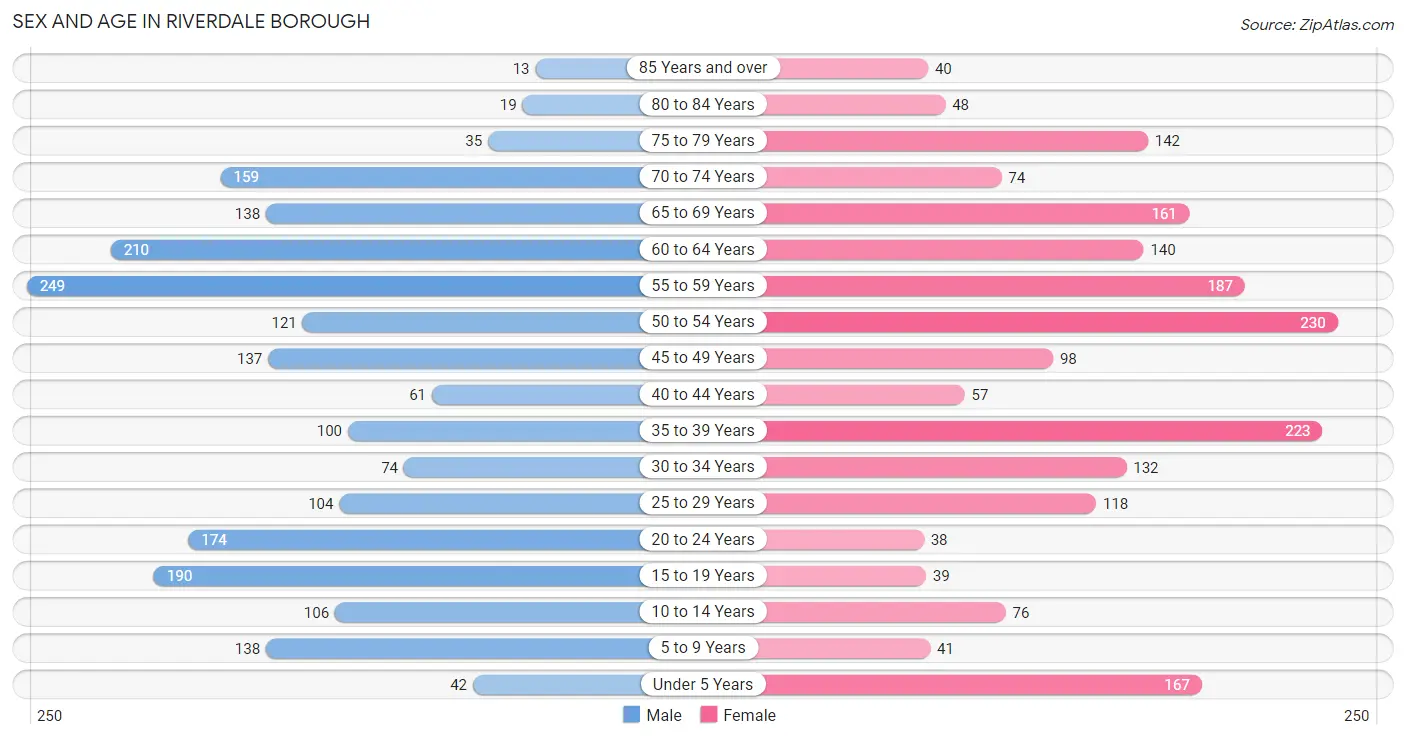
Sex and Age in Riverdale borough
Sex and Age in Riverdale borough
The most populous age groups in Riverdale borough are 55 to 59 Years (249 | 12.0%) for men and 50 to 54 Years (230 | 11.4%) for women.
| Age Bracket | Male | Female |
| Under 5 Years | 42 (2.0%) | 167 (8.3%) |
| 5 to 9 Years | 138 (6.7%) | 41 (2.0%) |
| 10 to 14 Years | 106 (5.1%) | 76 (3.8%) |
| 15 to 19 Years | 190 (9.2%) | 39 (1.9%) |
| 20 to 24 Years | 174 (8.4%) | 38 (1.9%) |
| 25 to 29 Years | 104 (5.0%) | 118 (5.9%) |
| 30 to 34 Years | 74 (3.6%) | 132 (6.6%) |
| 35 to 39 Years | 100 (4.8%) | 223 (11.1%) |
| 40 to 44 Years | 61 (2.9%) | 57 (2.8%) |
| 45 to 49 Years | 137 (6.6%) | 98 (4.9%) |
| 50 to 54 Years | 121 (5.9%) | 230 (11.4%) |
| 55 to 59 Years | 249 (12.0%) | 187 (9.3%) |
| 60 to 64 Years | 210 (10.1%) | 140 (7.0%) |
| 65 to 69 Years | 138 (6.7%) | 161 (8.0%) |
| 70 to 74 Years | 159 (7.7%) | 74 (3.7%) |
| 75 to 79 Years | 35 (1.7%) | 142 (7.1%) |
| 80 to 84 Years | 19 (0.9%) | 48 (2.4%) |
| 85 Years and over | 13 (0.6%) | 40 (2.0%) |
| Total | 2,070 (100.0%) | 2,011 (100.0%) |
Families and Households in Riverdale borough
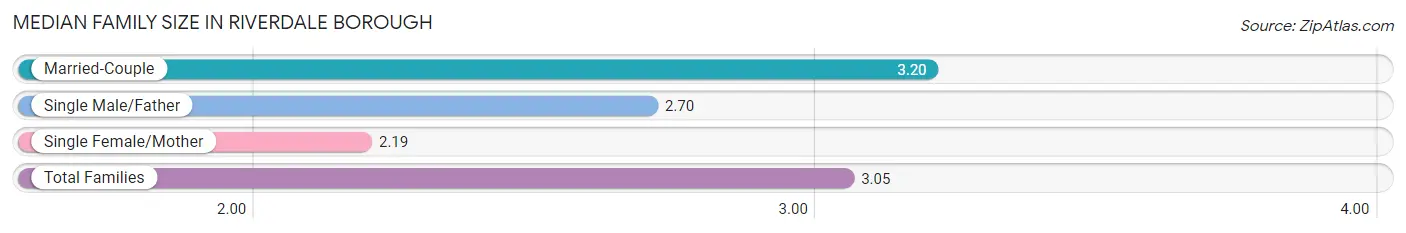
Median Family Size in Riverdale borough
The median family size in Riverdale borough is 3.05 persons per family, with married-couple families (817 | 82.6%) accounting for the largest median family size of 3.2 persons per family. On the other hand, single female/mother families (118 | 11.9%) represent the smallest median family size with 2.19 persons per family.
| Family Type | # Families | Family Size |
| Married-Couple | 817 (82.6%) | 3.20 |
| Single Male/Father | 54 (5.5%) | 2.70 |
| Single Female/Mother | 118 (11.9%) | 2.19 |
| Total Families | 989 (100.0%) | 3.05 |
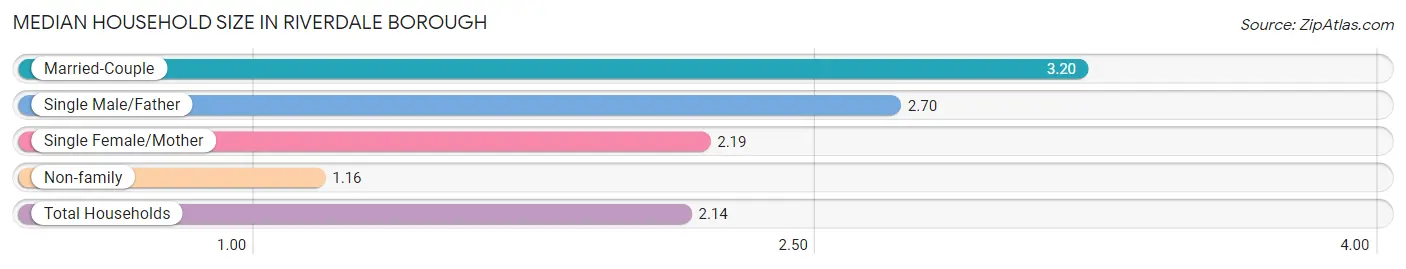
Median Household Size in Riverdale borough
The median household size in Riverdale borough is 2.14 persons per household, with married-couple households (817 | 42.9%) accounting for the largest median household size of 3.2 persons per household. non-family households (915 | 48.1%) represent the smallest median household size with 1.16 persons per household.
| Household Type | # Households | Household Size |
| Married-Couple | 817 (42.9%) | 3.20 |
| Single Male/Father | 54 (2.8%) | 2.70 |
| Single Female/Mother | 118 (6.2%) | 2.19 |
| Non-family | 915 (48.1%) | 1.16 |
| Total Households | 1,904 (100.0%) | 2.14 |
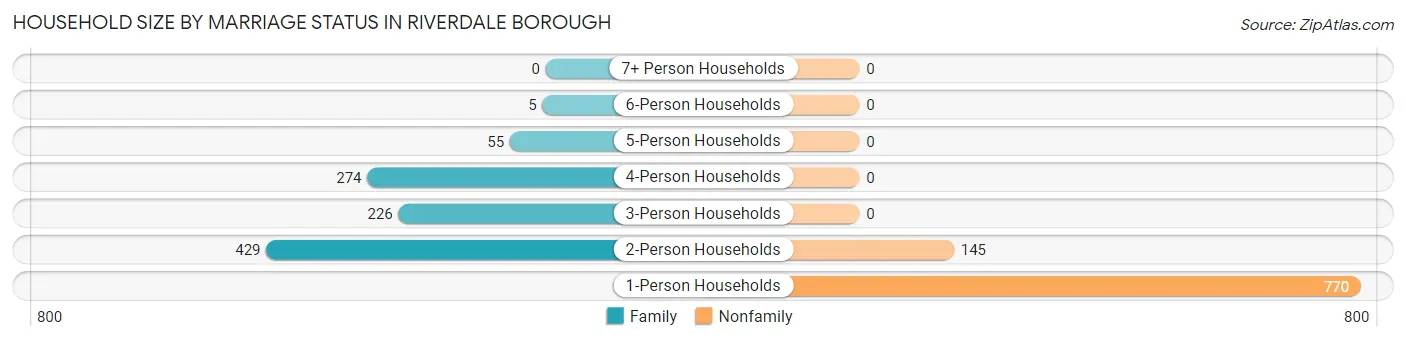
Household Size by Marriage Status in Riverdale borough
Out of a total of 1,904 households in Riverdale borough, 989 (51.9%) are family households, while 915 (48.1%) are nonfamily households. The most numerous type of family households are 2-person households, comprising 429, and the most common type of nonfamily households are 1-person households, comprising 770.
| Household Size | Family Households | Nonfamily Households |
| 1-Person Households | - | 770 (40.4%) |
| 2-Person Households | 429 (22.5%) | 145 (7.6%) |
| 3-Person Households | 226 (11.9%) | 0 (0.0%) |
| 4-Person Households | 274 (14.4%) | 0 (0.0%) |
| 5-Person Households | 55 (2.9%) | 0 (0.0%) |
| 6-Person Households | 5 (0.3%) | 0 (0.0%) |
| 7+ Person Households | 0 (0.0%) | 0 (0.0%) |
| Total | 989 (51.9%) | 915 (48.1%) |
Female Fertility in Riverdale borough
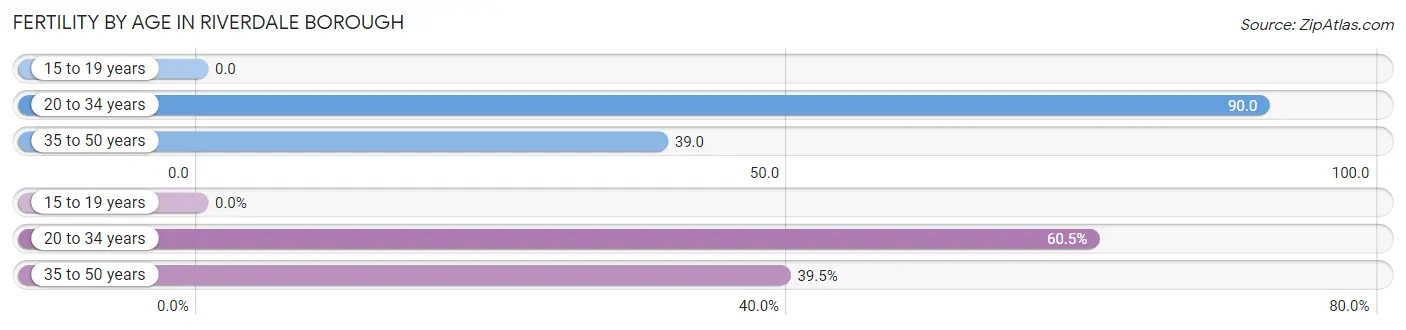
Fertility by Age in Riverdale borough
Average fertility rate in Riverdale borough is 57.0 births per 1,000 women. Women in the age bracket of 20 to 34 years have the highest fertility rate with 90.0 births per 1,000 women. Women in the age bracket of 20 to 34 years acount for 60.5% of all women with births.
| Age Bracket | Women with Births | Births / 1,000 Women |
| 15 to 19 years | 0 (0.0%) | 0.0 |
| 20 to 34 years | 26 (60.5%) | 90.0 |
| 35 to 50 years | 17 (39.5%) | 39.0 |
| Total | 43 (100.0%) | 57.0 |
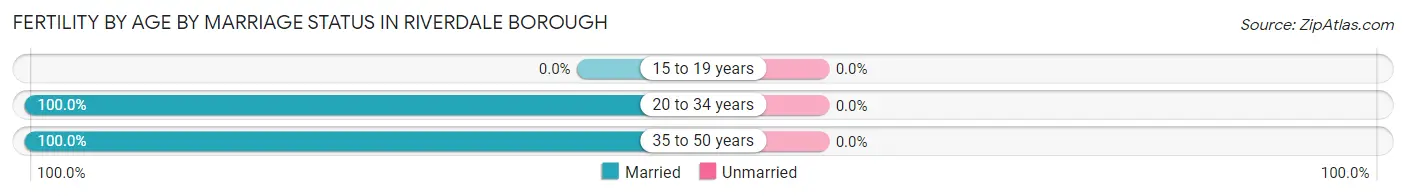
Fertility by Age by Marriage Status in Riverdale borough
| Age Bracket | Married | Unmarried |
| 15 to 19 years | 0 (0.0%) | 0 (0.0%) |
| 20 to 34 years | 26 (100.0%) | 0 (0.0%) |
| 35 to 50 years | 17 (100.0%) | 0 (0.0%) |
| Total | 43 (100.0%) | 0 (0.0%) |
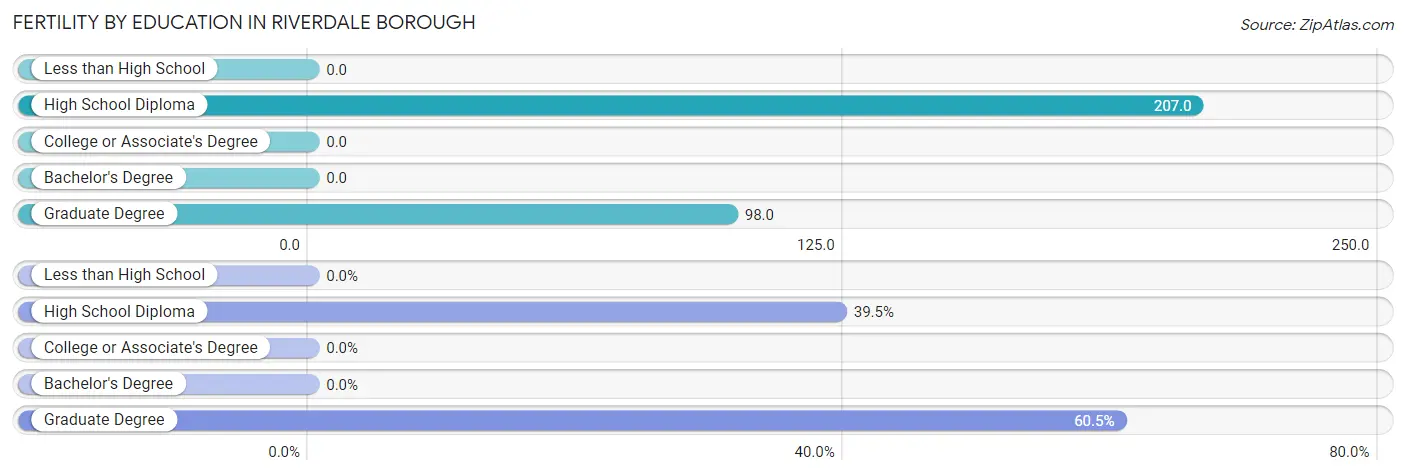
Fertility by Education in Riverdale borough
| Educational Attainment | Women with Births | Births / 1,000 Women |
| Less than High School | 0 (0.0%) | 0.0 |
| High School Diploma | 17 (39.5%) | 207.0 |
| College or Associate's Degree | 0 (0.0%) | 0.0 |
| Bachelor's Degree | 0 (0.0%) | 0.0 |
| Graduate Degree | 26 (60.5%) | 98.0 |
| Total | 43 (100.0%) | 57.0 |
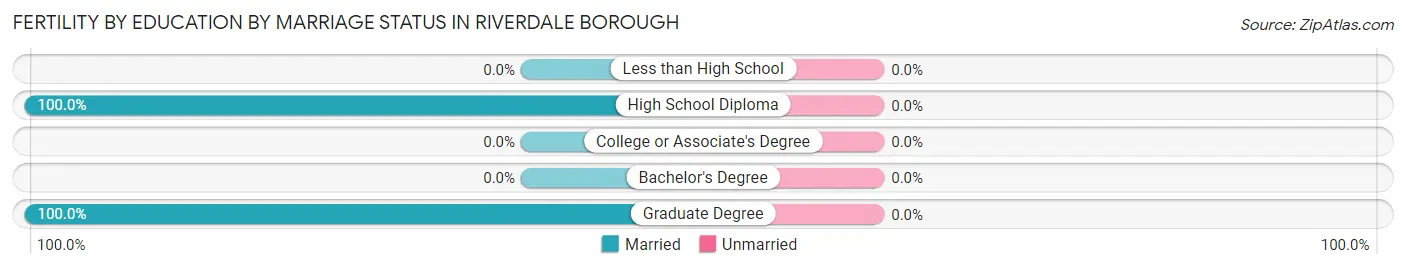
Fertility by Education by Marriage Status in Riverdale borough
| Educational Attainment | Married | Unmarried |
| Less than High School | 0 (0.0%) | 0 (0.0%) |
| High School Diploma | 17 (100.0%) | 0 (0.0%) |
| College or Associate's Degree | 0 (0.0%) | 0 (0.0%) |
| Bachelor's Degree | 0 (0.0%) | 0 (0.0%) |
| Graduate Degree | 26 (100.0%) | 0 (0.0%) |
| Total | 43 (100.0%) | 0 (0.0%) |
Employment Characteristics in Riverdale borough
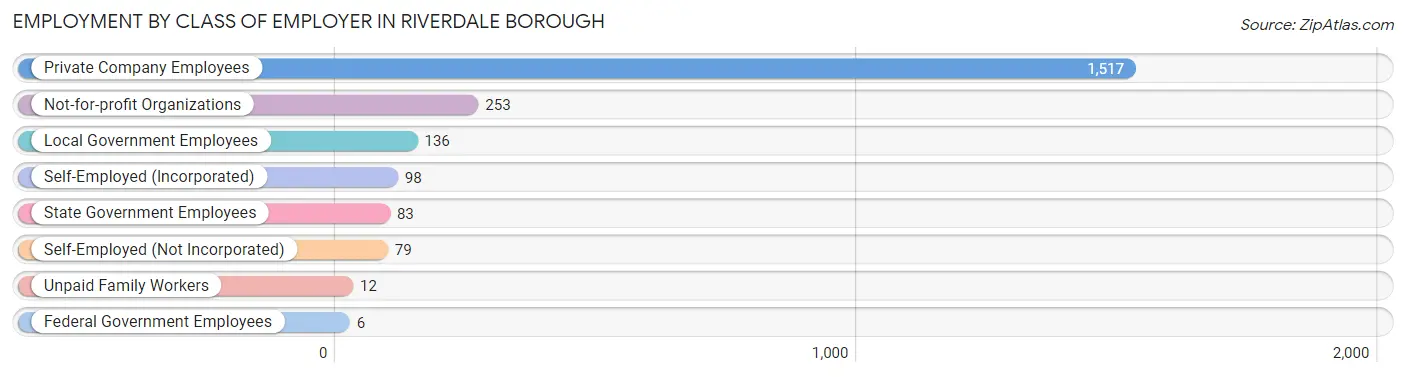
Employment by Class of Employer in Riverdale borough
Among the 2,184 employed individuals in Riverdale borough, private company employees (1,517 | 69.5%), not-for-profit organizations (253 | 11.6%), and local government employees (136 | 6.2%) make up the most common classes of employment.
| Employer Class | # Employees | % Employees |
| Private Company Employees | 1,517 | 69.5% |
| Self-Employed (Incorporated) | 98 | 4.5% |
| Self-Employed (Not Incorporated) | 79 | 3.6% |
| Not-for-profit Organizations | 253 | 11.6% |
| Local Government Employees | 136 | 6.2% |
| State Government Employees | 83 | 3.8% |
| Federal Government Employees | 6 | 0.3% |
| Unpaid Family Workers | 12 | 0.5% |
| Total | 2,184 | 100.0% |
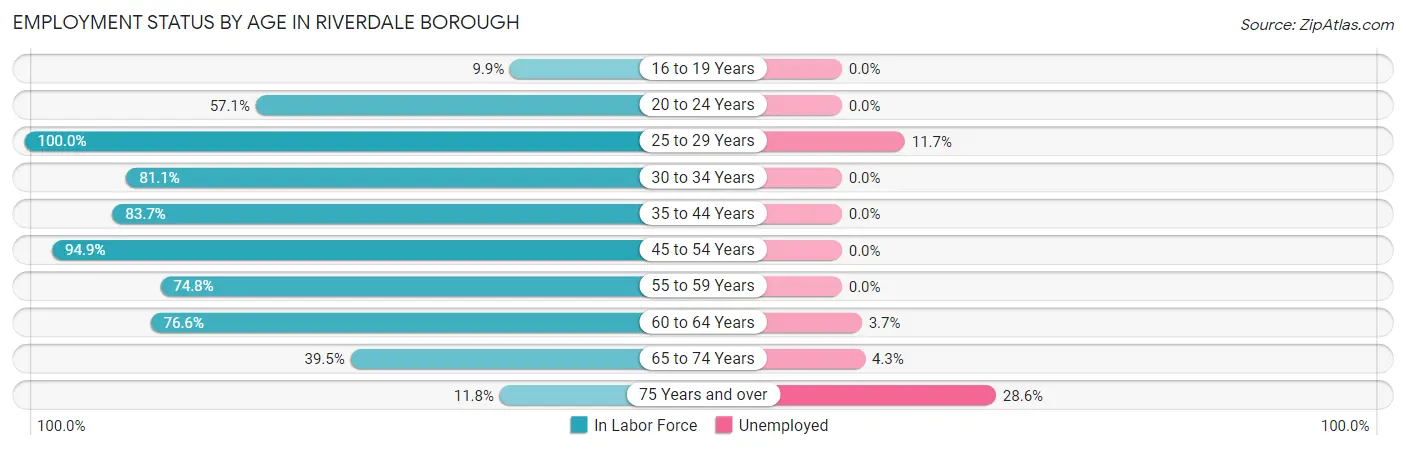
Employment Status by Age in Riverdale borough
According to the labor force statistics for Riverdale borough, out of the total population over 16 years of age (3,434), 66.7% or 2,290 individuals are in the labor force, with 2.4% or 55 of them unemployed. The age group with the highest labor force participation rate is 25 to 29 years, with 100.0% or 222 individuals in the labor force. Within the labor force, the 75 years and over age range has the highest percentage of unemployed individuals, with 28.6% or 10 of them being unemployed.
| Age Bracket | In Labor Force | Unemployed |
| 16 to 19 Years | 15 (9.9%) | 0 (0.0%) |
| 20 to 24 Years | 121 (57.1%) | 0 (0.0%) |
| 25 to 29 Years | 222 (100.0%) | 26 (11.7%) |
| 30 to 34 Years | 167 (81.1%) | 0 (0.0%) |
| 35 to 44 Years | 369 (83.7%) | 0 (0.0%) |
| 45 to 54 Years | 556 (94.9%) | 0 (0.0%) |
| 55 to 59 Years | 326 (74.8%) | 0 (0.0%) |
| 60 to 64 Years | 268 (76.6%) | 10 (3.7%) |
| 65 to 74 Years | 210 (39.5%) | 9 (4.3%) |
| 75 Years and over | 35 (11.8%) | 10 (28.6%) |
| Total | 2,290 (66.7%) | 55 (2.4%) |
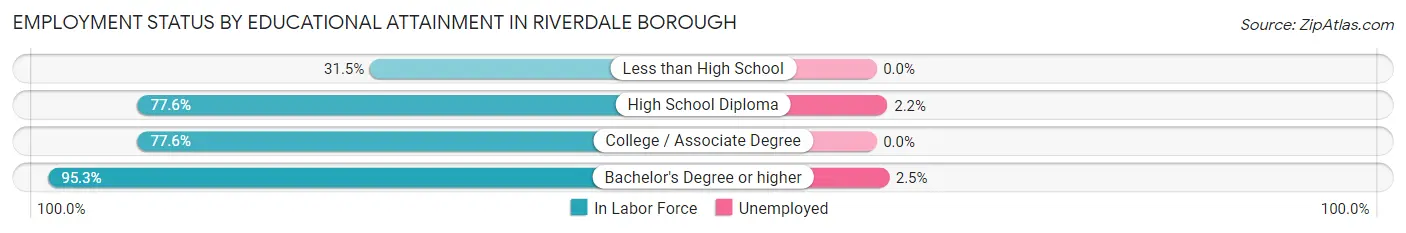
Employment Status by Educational Attainment in Riverdale borough
According to labor force statistics for Riverdale borough, 85.1% of individuals (1,907) out of the total population between 25 and 64 years of age (2,241) are in the labor force, with 1.9% or 36 of them being unemployed. The group with the highest labor force participation rate are those with the educational attainment of bachelor's degree or higher, with 95.3% or 1,047 individuals in the labor force. Within the labor force, individuals with bachelor's degree or higher education have the highest percentage of unemployment, with 2.5% or 26 of them being unemployed.
| Educational Attainment | In Labor Force | Unemployed |
| Less than High School | 17 (31.5%) | 0 (0.0%) |
| High School Diploma | 464 (77.6%) | 13 (2.2%) |
| College / Associate Degree | 380 (77.6%) | 0 (0.0%) |
| Bachelor's Degree or higher | 1,047 (95.3%) | 27 (2.5%) |
| Total | 1,907 (85.1%) | 43 (1.9%) |
Employment Occupations by Sex in Riverdale borough
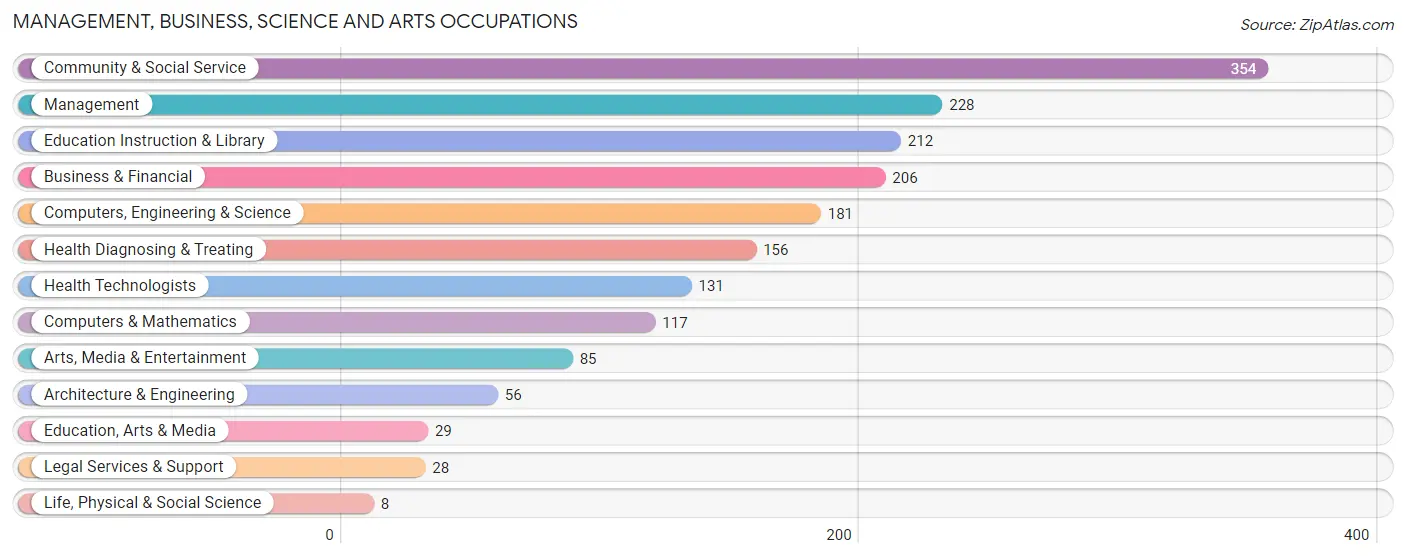
Management, Business, Science and Arts Occupations
The most common Management, Business, Science and Arts occupations in Riverdale borough are Community & Social Service (354 | 15.9%), Management (228 | 10.2%), Education Instruction & Library (212 | 9.5%), Business & Financial (206 | 9.2%), and Computers, Engineering & Science (181 | 8.1%).
Management, Business, Science and Arts Occupations by Sex
Within the Management, Business, Science and Arts occupations in Riverdale borough, the most male-oriented occupations are Architecture & Engineering (100.0%), Management (66.2%), and Computers, Engineering & Science (60.2%), while the most female-oriented occupations are Life, Physical & Social Science (100.0%), Legal Services & Support (100.0%), and Education Instruction & Library (86.3%).
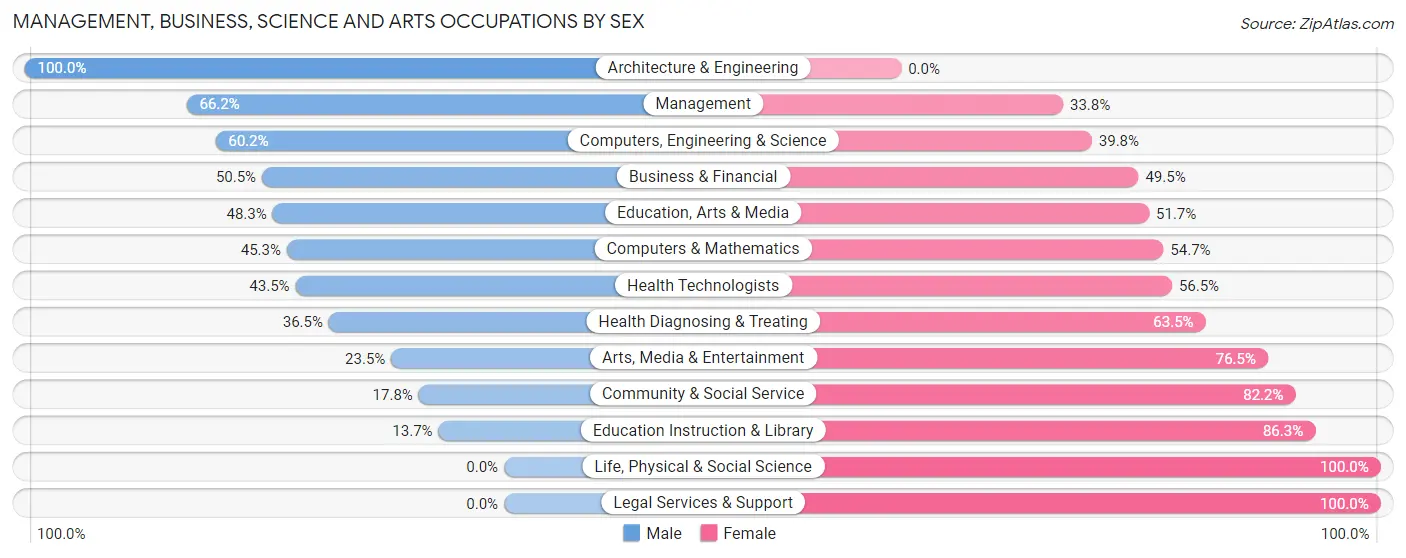
| Occupation | Male | Female |
| Management | 151 (66.2%) | 77 (33.8%) |
| Business & Financial | 104 (50.5%) | 102 (49.5%) |
| Computers, Engineering & Science | 109 (60.2%) | 72 (39.8%) |
| Computers & Mathematics | 53 (45.3%) | 64 (54.7%) |
| Architecture & Engineering | 56 (100.0%) | 0 (0.0%) |
| Life, Physical & Social Science | 0 (0.0%) | 8 (100.0%) |
| Community & Social Service | 63 (17.8%) | 291 (82.2%) |
| Education, Arts & Media | 14 (48.3%) | 15 (51.7%) |
| Legal Services & Support | 0 (0.0%) | 28 (100.0%) |
| Education Instruction & Library | 29 (13.7%) | 183 (86.3%) |
| Arts, Media & Entertainment | 20 (23.5%) | 65 (76.5%) |
| Health Diagnosing & Treating | 57 (36.5%) | 99 (63.5%) |
| Health Technologists | 57 (43.5%) | 74 (56.5%) |
| Total (Category) | 484 (43.0%) | 641 (57.0%) |
| Total (Overall) | 1,110 (49.7%) | 1,124 (50.3%) |
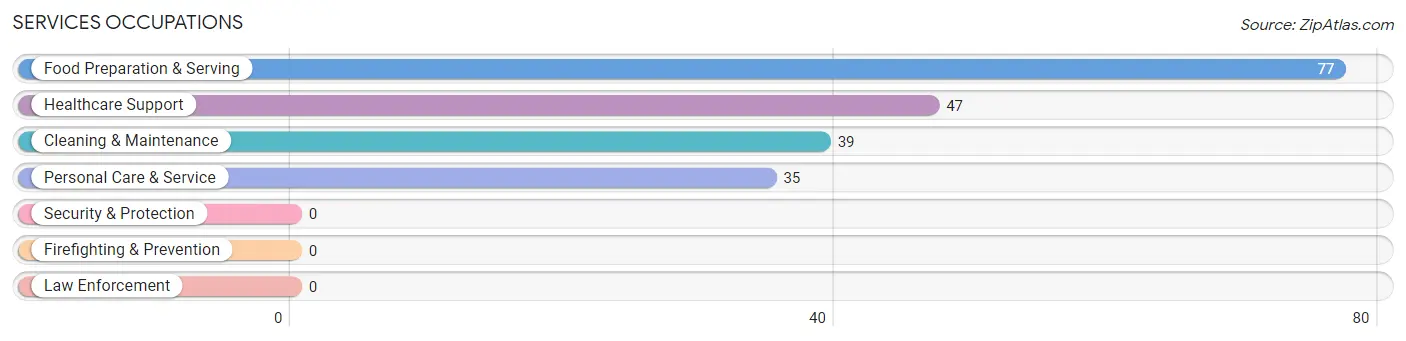
Services Occupations
The most common Services occupations in Riverdale borough are Food Preparation & Serving (77 | 3.5%), Healthcare Support (47 | 2.1%), Cleaning & Maintenance (39 | 1.8%), and Personal Care & Service (35 | 1.6%).
Services Occupations by Sex
Within the Services occupations in Riverdale borough, the most male-oriented occupations are Personal Care & Service (65.7%), Cleaning & Maintenance (23.1%), and Healthcare Support (10.6%), while the most female-oriented occupations are Food Preparation & Serving (90.9%), Healthcare Support (89.4%), and Cleaning & Maintenance (76.9%).
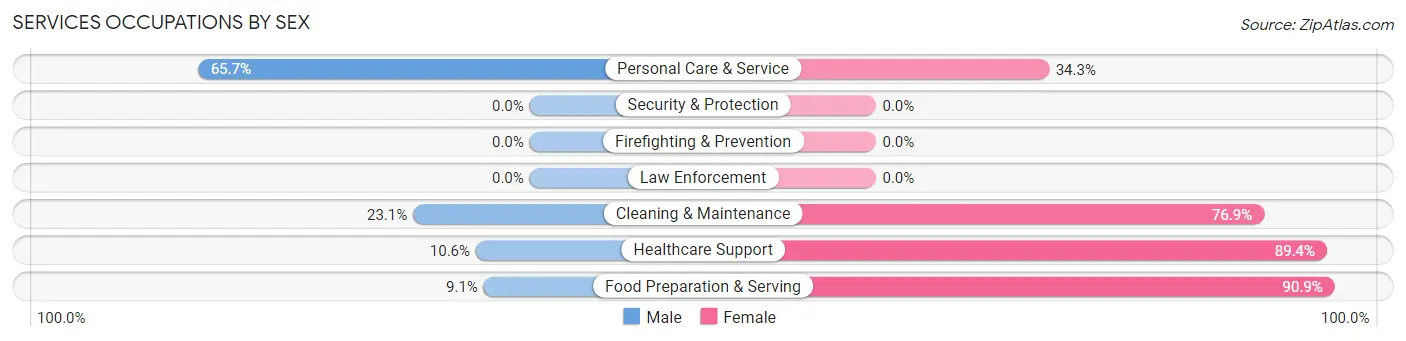
| Occupation | Male | Female |
| Healthcare Support | 5 (10.6%) | 42 (89.4%) |
| Security & Protection | 0 (0.0%) | 0 (0.0%) |
| Firefighting & Prevention | 0 (0.0%) | 0 (0.0%) |
| Law Enforcement | 0 (0.0%) | 0 (0.0%) |
| Food Preparation & Serving | 7 (9.1%) | 70 (90.9%) |
| Cleaning & Maintenance | 9 (23.1%) | 30 (76.9%) |
| Personal Care & Service | 23 (65.7%) | 12 (34.3%) |
| Total (Category) | 44 (22.2%) | 154 (77.8%) |
| Total (Overall) | 1,110 (49.7%) | 1,124 (50.3%) |
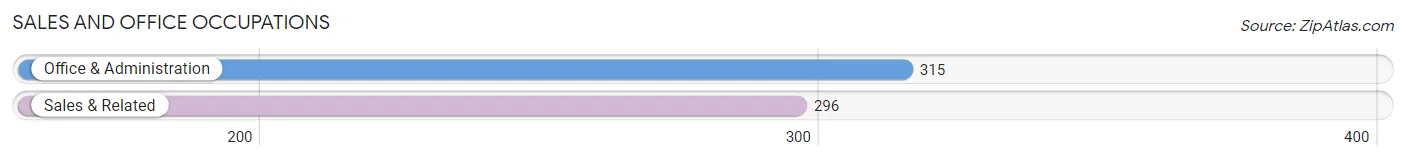
Sales and Office Occupations
The most common Sales and Office occupations in Riverdale borough are Office & Administration (315 | 14.1%), and Sales & Related (296 | 13.3%).
Sales and Office Occupations by Sex
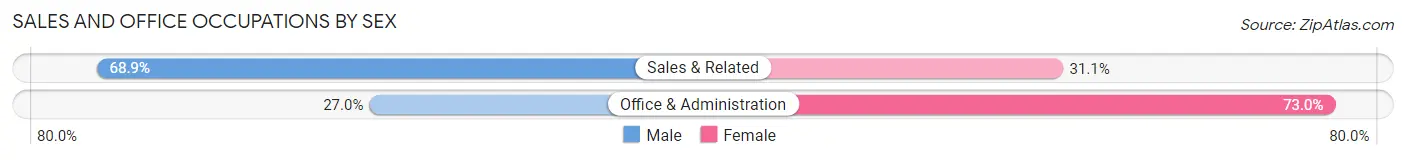
| Occupation | Male | Female |
| Sales & Related | 204 (68.9%) | 92 (31.1%) |
| Office & Administration | 85 (27.0%) | 230 (73.0%) |
| Total (Category) | 289 (47.3%) | 322 (52.7%) |
| Total (Overall) | 1,110 (49.7%) | 1,124 (50.3%) |
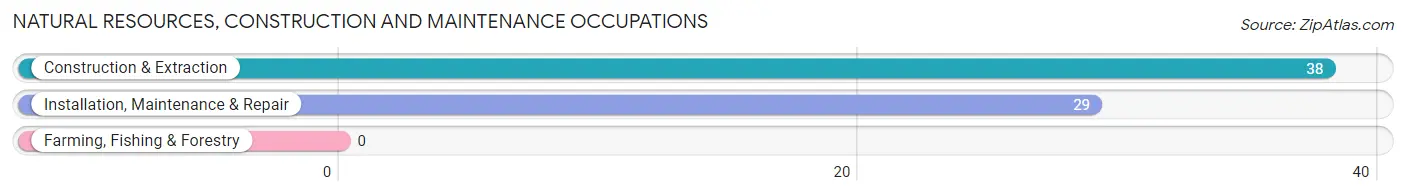
Natural Resources, Construction and Maintenance Occupations
The most common Natural Resources, Construction and Maintenance occupations in Riverdale borough are Construction & Extraction (38 | 1.7%), and Installation, Maintenance & Repair (29 | 1.3%).
Natural Resources, Construction and Maintenance Occupations by Sex
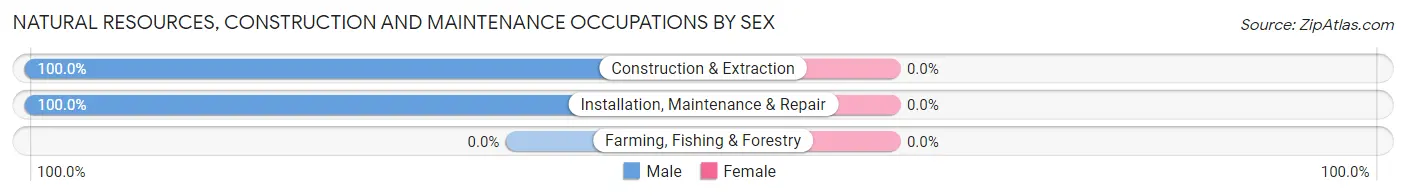
| Occupation | Male | Female |
| Farming, Fishing & Forestry | 0 (0.0%) | 0 (0.0%) |
| Construction & Extraction | 38 (100.0%) | 0 (0.0%) |
| Installation, Maintenance & Repair | 29 (100.0%) | 0 (0.0%) |
| Total (Category) | 67 (100.0%) | 0 (0.0%) |
| Total (Overall) | 1,110 (49.7%) | 1,124 (50.3%) |
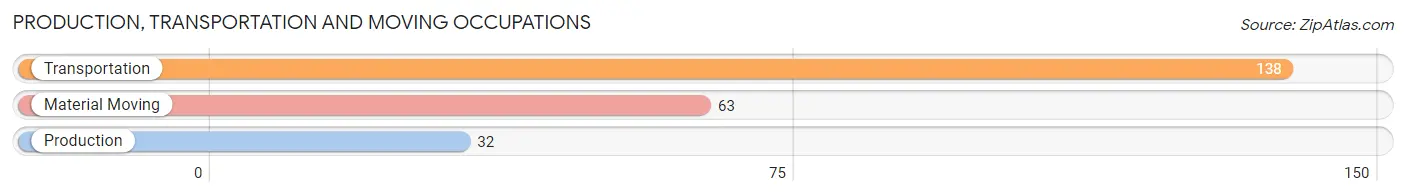
Production, Transportation and Moving Occupations
The most common Production, Transportation and Moving occupations in Riverdale borough are Transportation (138 | 6.2%), Material Moving (63 | 2.8%), and Production (32 | 1.4%).
Production, Transportation and Moving Occupations by Sex
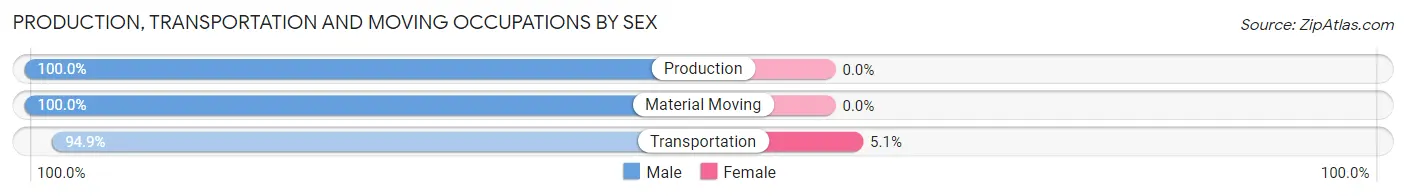
| Occupation | Male | Female |
| Production | 32 (100.0%) | 0 (0.0%) |
| Transportation | 131 (94.9%) | 7 (5.1%) |
| Material Moving | 63 (100.0%) | 0 (0.0%) |
| Total (Category) | 226 (97.0%) | 7 (3.0%) |
| Total (Overall) | 1,110 (49.7%) | 1,124 (50.3%) |
Employment Industries by Sex in Riverdale borough
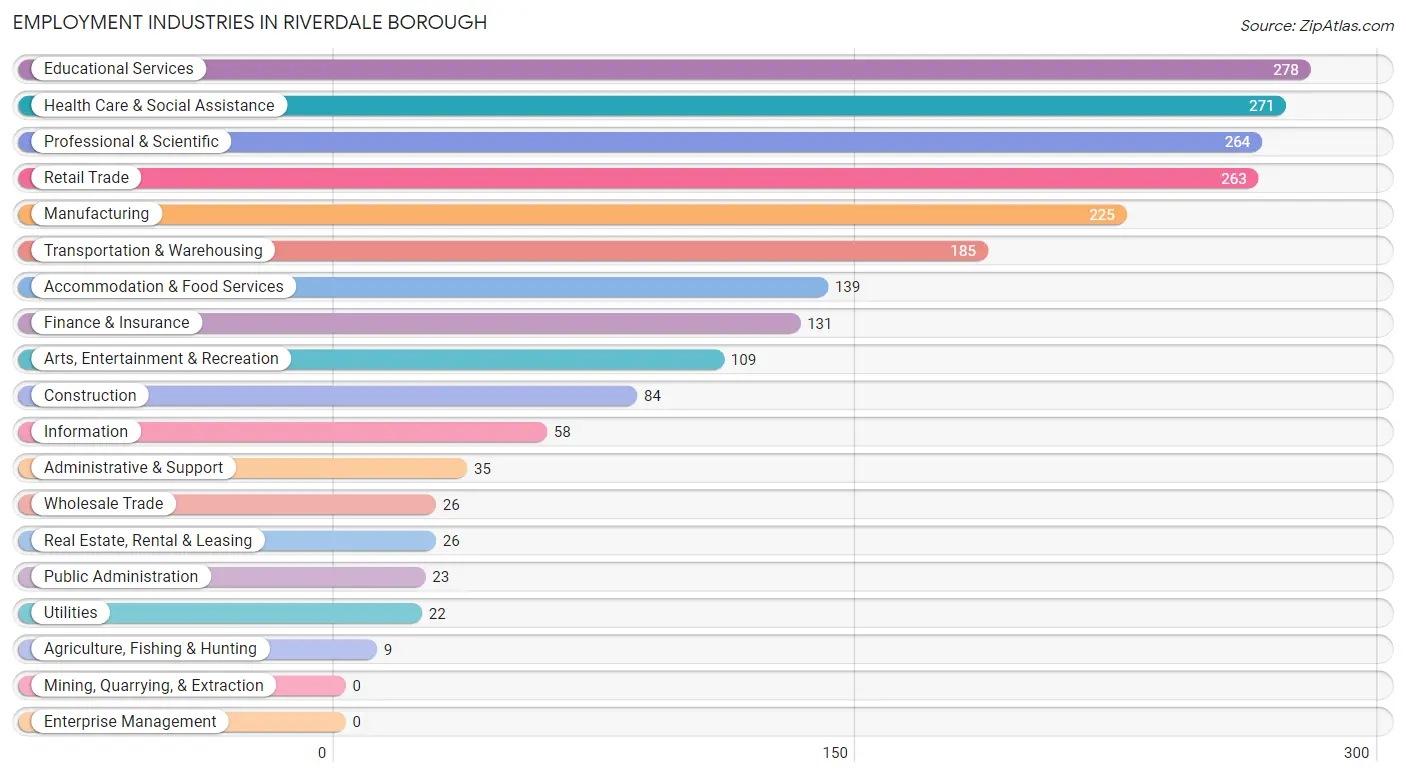
Employment Industries in Riverdale borough
The major employment industries in Riverdale borough include Educational Services (278 | 12.4%), Health Care & Social Assistance (271 | 12.1%), Professional & Scientific (264 | 11.8%), Retail Trade (263 | 11.8%), and Manufacturing (225 | 10.1%).
Employment Industries by Sex in Riverdale borough
The Riverdale borough industries that see more men than women are Real Estate, Rental & Leasing (100.0%), Construction (88.1%), and Transportation & Warehousing (75.1%), whereas the industries that tend to have a higher number of women are Agriculture, Fishing & Hunting (100.0%), Wholesale Trade (100.0%), and Utilities (100.0%).
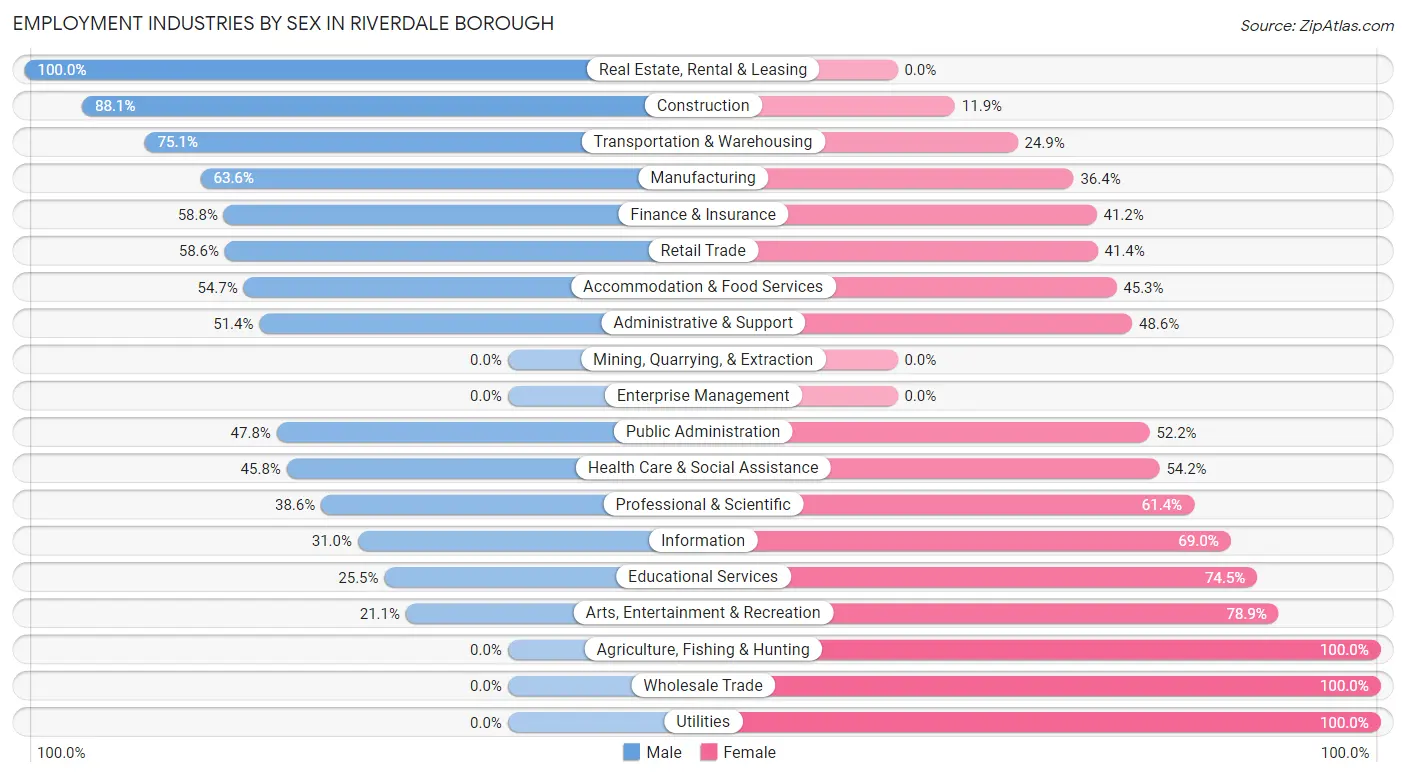
| Industry | Male | Female |
| Agriculture, Fishing & Hunting | 0 (0.0%) | 9 (100.0%) |
| Mining, Quarrying, & Extraction | 0 (0.0%) | 0 (0.0%) |
| Construction | 74 (88.1%) | 10 (11.9%) |
| Manufacturing | 143 (63.6%) | 82 (36.4%) |
| Wholesale Trade | 0 (0.0%) | 26 (100.0%) |
| Retail Trade | 154 (58.6%) | 109 (41.4%) |
| Transportation & Warehousing | 139 (75.1%) | 46 (24.9%) |
| Utilities | 0 (0.0%) | 22 (100.0%) |
| Information | 18 (31.0%) | 40 (69.0%) |
| Finance & Insurance | 77 (58.8%) | 54 (41.2%) |
| Real Estate, Rental & Leasing | 26 (100.0%) | 0 (0.0%) |
| Professional & Scientific | 102 (38.6%) | 162 (61.4%) |
| Enterprise Management | 0 (0.0%) | 0 (0.0%) |
| Administrative & Support | 18 (51.4%) | 17 (48.6%) |
| Educational Services | 71 (25.5%) | 207 (74.5%) |
| Health Care & Social Assistance | 124 (45.8%) | 147 (54.2%) |
| Arts, Entertainment & Recreation | 23 (21.1%) | 86 (78.9%) |
| Accommodation & Food Services | 76 (54.7%) | 63 (45.3%) |
| Public Administration | 11 (47.8%) | 12 (52.2%) |
| Total | 1,110 (49.7%) | 1,124 (50.3%) |
Education in Riverdale borough
School Enrollment in Riverdale borough
The most common levels of schooling among the 926 students in Riverdale borough are college / undergraduate (227 | 24.5%), high school (226 | 24.4%), and middle school (161 | 17.4%).
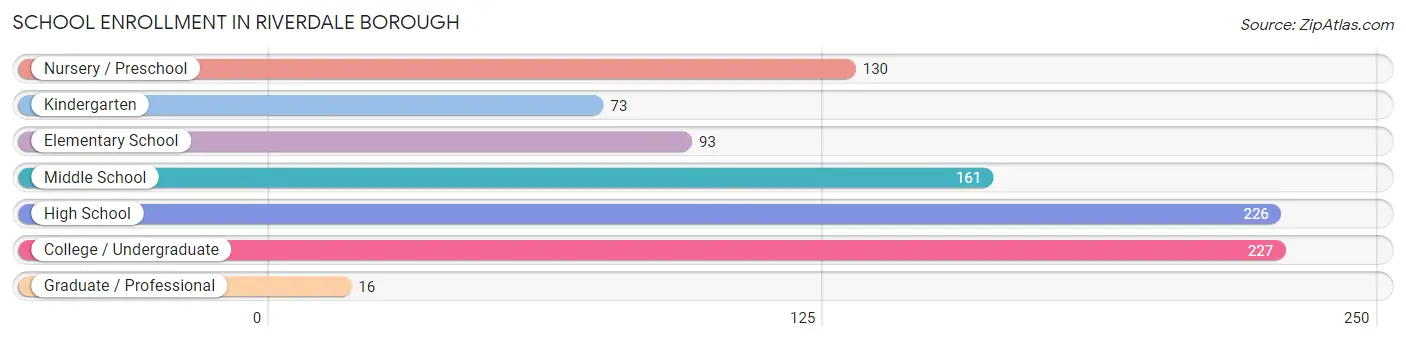
| School Level | # Students | % Students |
| Nursery / Preschool | 130 | 14.0% |
| Kindergarten | 73 | 7.9% |
| Elementary School | 93 | 10.0% |
| Middle School | 161 | 17.4% |
| High School | 226 | 24.4% |
| College / Undergraduate | 227 | 24.5% |
| Graduate / Professional | 16 | 1.7% |
| Total | 926 | 100.0% |
School Enrollment by Age by Funding Source in Riverdale borough
Out of a total of 926 students who are enrolled in schools in Riverdale borough, 232 (25.1%) attend a private institution, while the remaining 694 (74.9%) are enrolled in public schools. The age group of 18 to 19 year olds has the highest likelihood of being enrolled in private schools, with 28 (71.8% in the age bracket) enrolled. Conversely, the age group of 20 to 24 year olds has the lowest likelihood of being enrolled in a private school, with 157 (100.0% in the age bracket) attending a public institution.
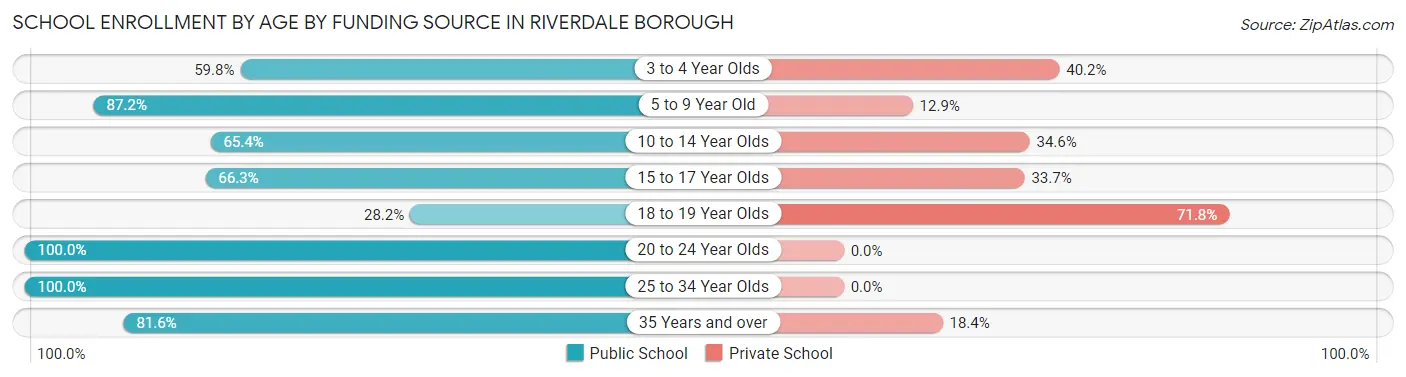
| Age Bracket | Public School | Private School |
| 3 to 4 Year Olds | 70 (59.8%) | 47 (40.2%) |
| 5 to 9 Year Old | 156 (87.2%) | 23 (12.9%) |
| 10 to 14 Year Olds | 119 (65.4%) | 63 (34.6%) |
| 15 to 17 Year Olds | 126 (66.3%) | 64 (33.7%) |
| 18 to 19 Year Olds | 11 (28.2%) | 28 (71.8%) |
| 20 to 24 Year Olds | 157 (100.0%) | 0 (0.0%) |
| 25 to 34 Year Olds | 24 (100.0%) | 0 (0.0%) |
| 35 Years and over | 31 (81.6%) | 7 (18.4%) |
| Total | 694 (74.9%) | 232 (25.1%) |
Educational Attainment by Field of Study in Riverdale borough
Business (474 | 32.1%), science & technology (176 | 11.9%), education (167 | 11.3%), social sciences (125 | 8.5%), and communications (113 | 7.7%) are the most common fields of study among 1,475 individuals in Riverdale borough who have obtained a bachelor's degree or higher.
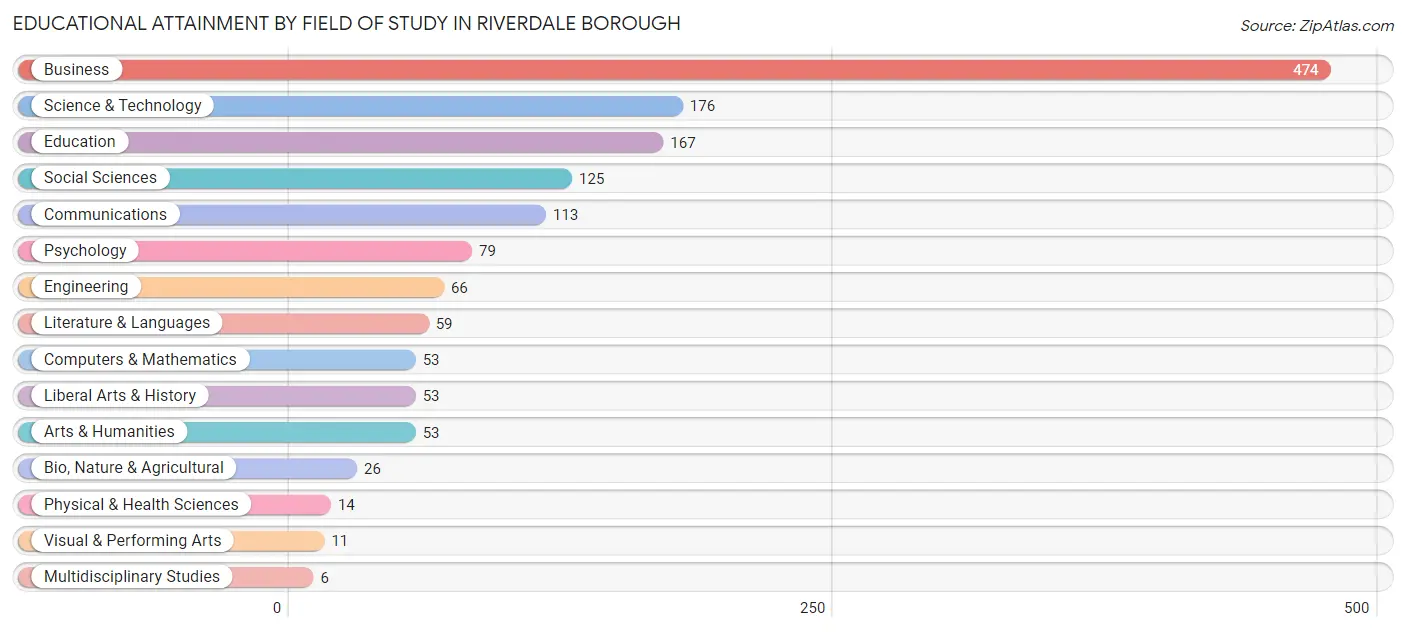
| Field of Study | # Graduates | % Graduates |
| Computers & Mathematics | 53 | 3.6% |
| Bio, Nature & Agricultural | 26 | 1.8% |
| Physical & Health Sciences | 14 | 0.9% |
| Psychology | 79 | 5.4% |
| Social Sciences | 125 | 8.5% |
| Engineering | 66 | 4.5% |
| Multidisciplinary Studies | 6 | 0.4% |
| Science & Technology | 176 | 11.9% |
| Business | 474 | 32.1% |
| Education | 167 | 11.3% |
| Literature & Languages | 59 | 4.0% |
| Liberal Arts & History | 53 | 3.6% |
| Visual & Performing Arts | 11 | 0.7% |
| Communications | 113 | 7.7% |
| Arts & Humanities | 53 | 3.6% |
| Total | 1,475 | 100.0% |
Transportation & Commute in Riverdale borough
Vehicle Availability by Sex in Riverdale borough
The most prevalent vehicle ownership categories in Riverdale borough are males with 2 vehicles (512, accounting for 47.4%) and females with 2 vehicles (432, making up 46.4%).
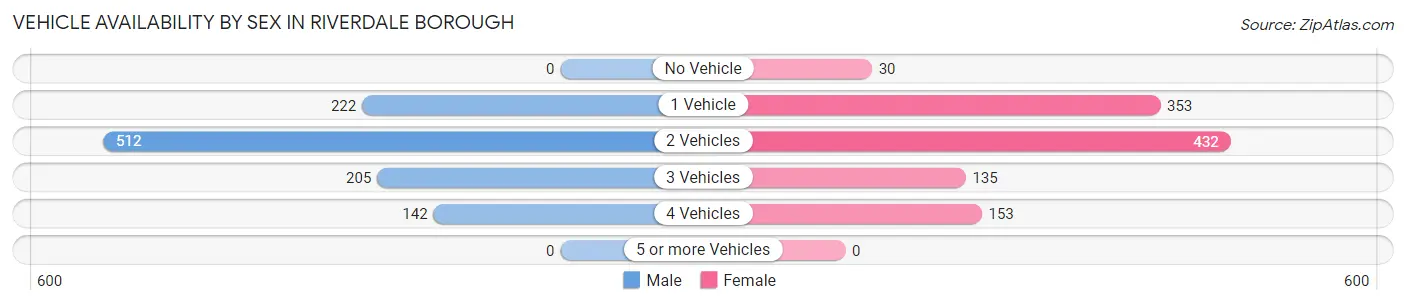
| Vehicles Available | Male | Female |
| No Vehicle | 0 (0.0%) | 30 (2.7%) |
| 1 Vehicle | 222 (20.5%) | 353 (32.0%) |
| 2 Vehicles | 512 (47.4%) | 432 (39.2%) |
| 3 Vehicles | 205 (19.0%) | 135 (12.2%) |
| 4 Vehicles | 142 (13.1%) | 153 (13.9%) |
| 5 or more Vehicles | 0 (0.0%) | 0 (0.0%) |
| Total | 1,081 (100.0%) | 1,103 (100.0%) |
Commute Time in Riverdale borough
The most frequently occuring commute durations in Riverdale borough are 30 to 34 minutes (399 commuters, 20.5%), 20 to 24 minutes (334 commuters, 17.2%), and 10 to 14 minutes (221 commuters, 11.4%).
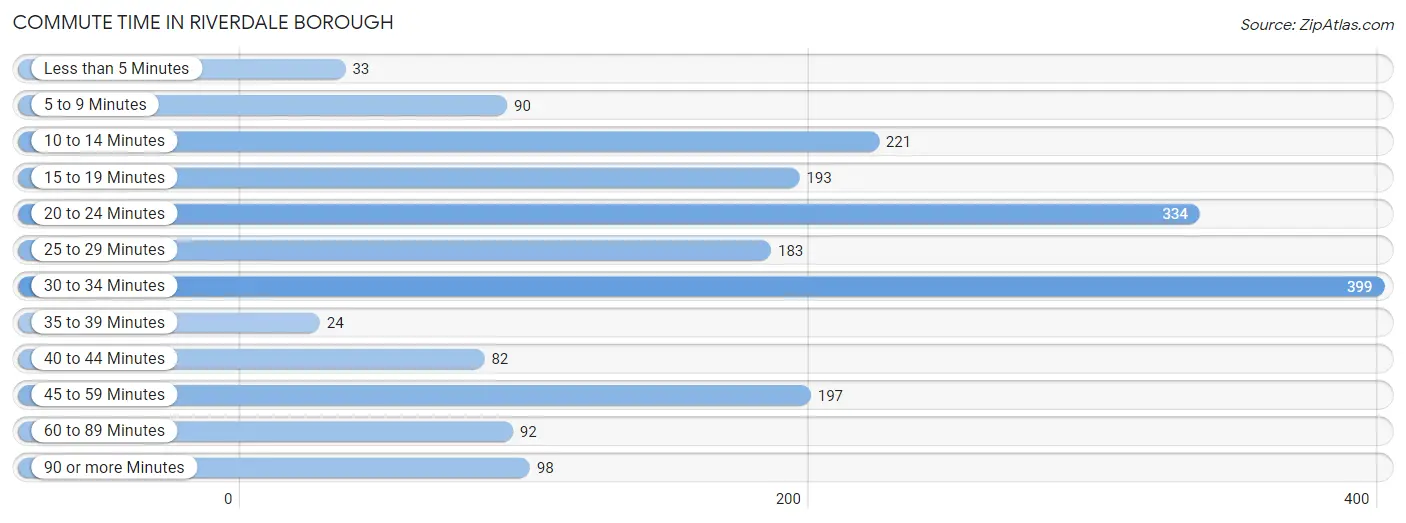
| Commute Time | # Commuters | % Commuters |
| Less than 5 Minutes | 33 | 1.7% |
| 5 to 9 Minutes | 90 | 4.6% |
| 10 to 14 Minutes | 221 | 11.4% |
| 15 to 19 Minutes | 193 | 9.9% |
| 20 to 24 Minutes | 334 | 17.2% |
| 25 to 29 Minutes | 183 | 9.4% |
| 30 to 34 Minutes | 399 | 20.5% |
| 35 to 39 Minutes | 24 | 1.2% |
| 40 to 44 Minutes | 82 | 4.2% |
| 45 to 59 Minutes | 197 | 10.1% |
| 60 to 89 Minutes | 92 | 4.7% |
| 90 or more Minutes | 98 | 5.0% |
Commute Time by Sex in Riverdale borough
The most common commute times in Riverdale borough are 30 to 34 minutes (274 commuters, 27.9%) for males and 10 to 14 minutes (155 commuters, 16.1%) for females.
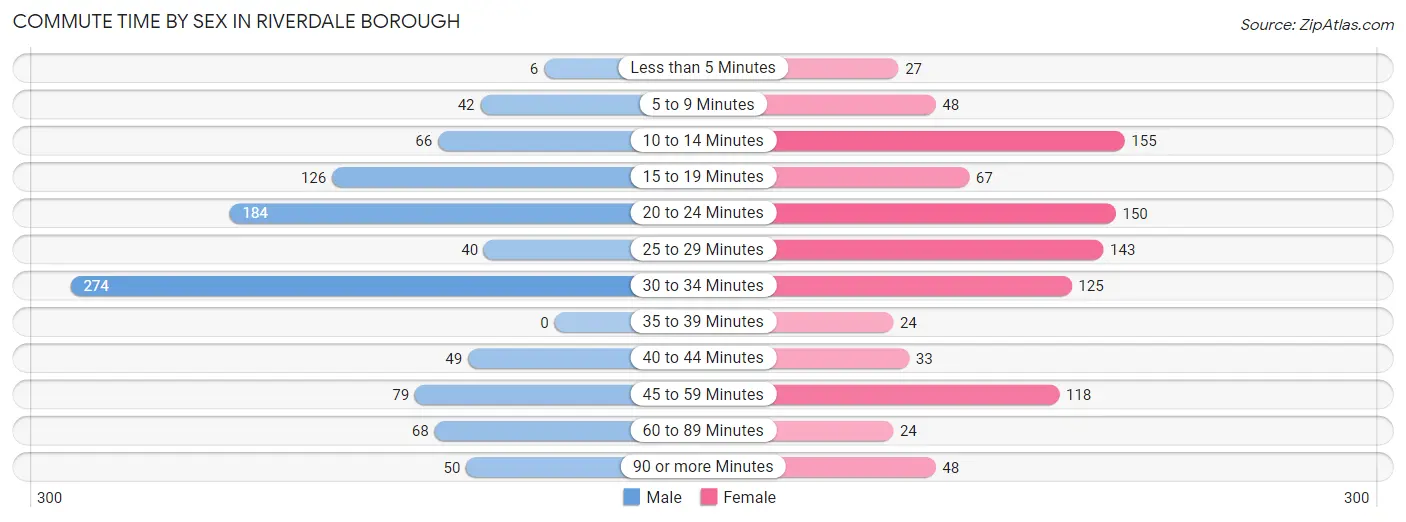
| Commute Time | Male | Female |
| Less than 5 Minutes | 6 (0.6%) | 27 (2.8%) |
| 5 to 9 Minutes | 42 (4.3%) | 48 (5.0%) |
| 10 to 14 Minutes | 66 (6.7%) | 155 (16.1%) |
| 15 to 19 Minutes | 126 (12.8%) | 67 (7.0%) |
| 20 to 24 Minutes | 184 (18.7%) | 150 (15.6%) |
| 25 to 29 Minutes | 40 (4.1%) | 143 (14.9%) |
| 30 to 34 Minutes | 274 (27.9%) | 125 (13.0%) |
| 35 to 39 Minutes | 0 (0.0%) | 24 (2.5%) |
| 40 to 44 Minutes | 49 (5.0%) | 33 (3.4%) |
| 45 to 59 Minutes | 79 (8.0%) | 118 (12.3%) |
| 60 to 89 Minutes | 68 (6.9%) | 24 (2.5%) |
| 90 or more Minutes | 50 (5.1%) | 48 (5.0%) |
Time of Departure to Work by Sex in Riverdale borough
The most frequent times of departure to work in Riverdale borough are 8:00 AM to 8:29 AM (188, 19.1%) for males and 7:30 AM to 7:59 AM (198, 20.6%) for females.
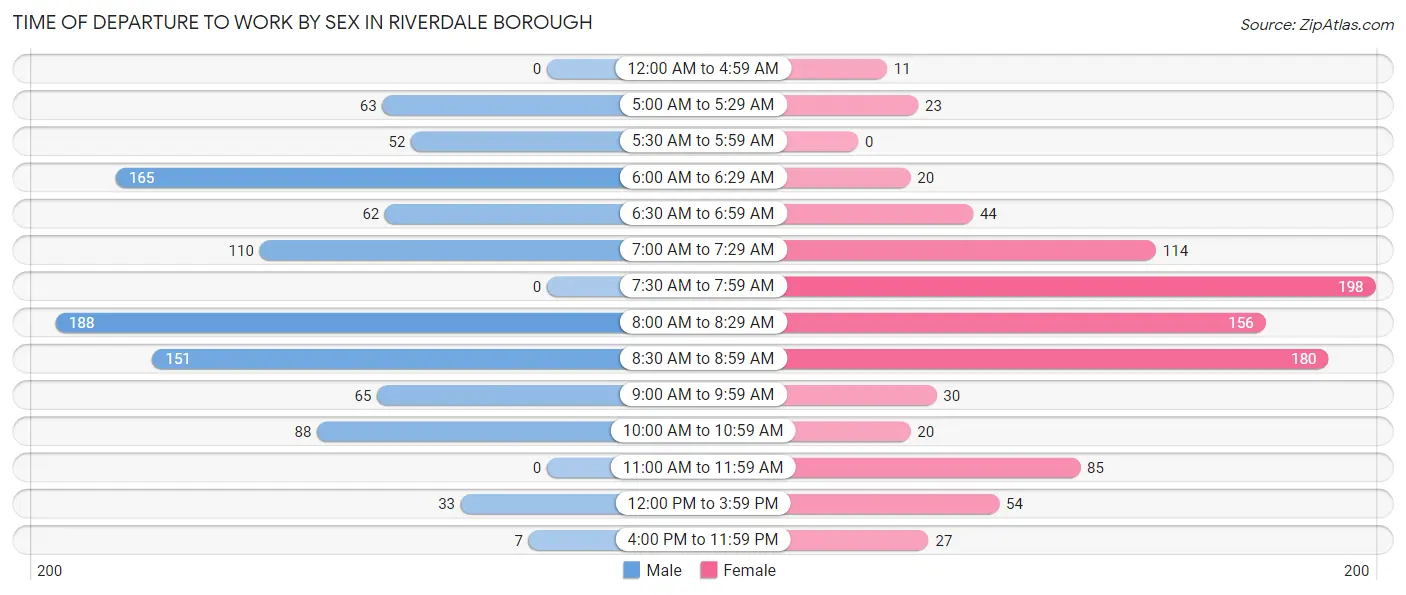
| Time of Departure | Male | Female |
| 12:00 AM to 4:59 AM | 0 (0.0%) | 11 (1.1%) |
| 5:00 AM to 5:29 AM | 63 (6.4%) | 23 (2.4%) |
| 5:30 AM to 5:59 AM | 52 (5.3%) | 0 (0.0%) |
| 6:00 AM to 6:29 AM | 165 (16.8%) | 20 (2.1%) |
| 6:30 AM to 6:59 AM | 62 (6.3%) | 44 (4.6%) |
| 7:00 AM to 7:29 AM | 110 (11.2%) | 114 (11.8%) |
| 7:30 AM to 7:59 AM | 0 (0.0%) | 198 (20.6%) |
| 8:00 AM to 8:29 AM | 188 (19.1%) | 156 (16.2%) |
| 8:30 AM to 8:59 AM | 151 (15.3%) | 180 (18.7%) |
| 9:00 AM to 9:59 AM | 65 (6.6%) | 30 (3.1%) |
| 10:00 AM to 10:59 AM | 88 (8.9%) | 20 (2.1%) |
| 11:00 AM to 11:59 AM | 0 (0.0%) | 85 (8.8%) |
| 12:00 PM to 3:59 PM | 33 (3.4%) | 54 (5.6%) |
| 4:00 PM to 11:59 PM | 7 (0.7%) | 27 (2.8%) |
| Total | 984 (100.0%) | 962 (100.0%) |
Housing Occupancy in Riverdale borough
Occupancy by Ownership in Riverdale borough
Of the total 1,904 dwellings in Riverdale borough, owner-occupied units account for 1,334 (70.1%), while renter-occupied units make up 570 (29.9%).
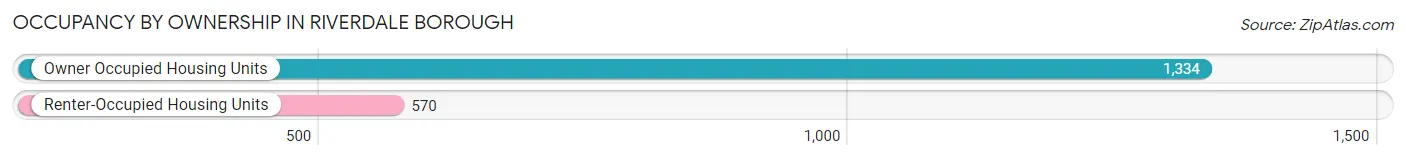
| Occupancy | # Housing Units | % Housing Units |
| Owner Occupied Housing Units | 1,334 | 70.1% |
| Renter-Occupied Housing Units | 570 | 29.9% |
| Total Occupied Housing Units | 1,904 | 100.0% |
Occupancy by Household Size in Riverdale borough
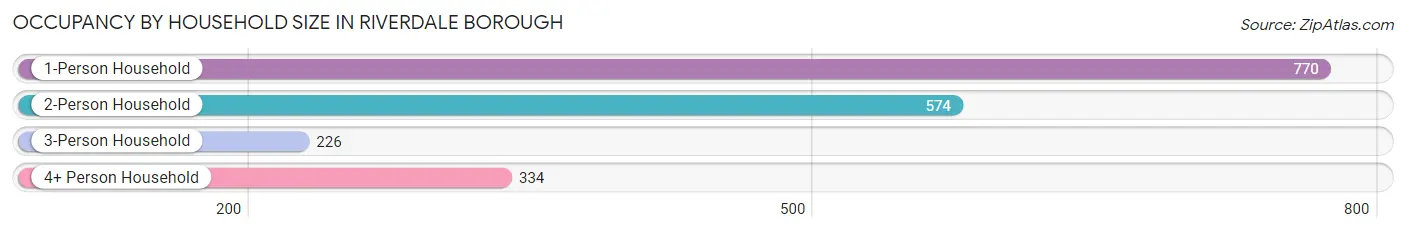
| Household Size | # Housing Units | % Housing Units |
| 1-Person Household | 770 | 40.4% |
| 2-Person Household | 574 | 30.1% |
| 3-Person Household | 226 | 11.9% |
| 4+ Person Household | 334 | 17.5% |
| Total Housing Units | 1,904 | 100.0% |
Occupancy by Ownership by Household Size in Riverdale borough
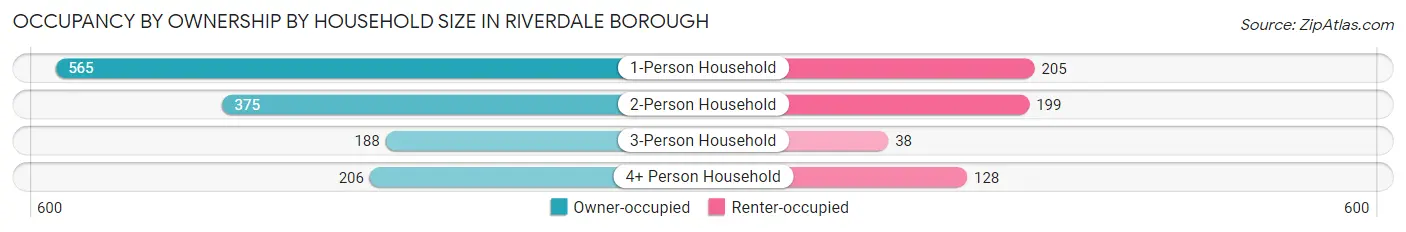
| Household Size | Owner-occupied | Renter-occupied |
| 1-Person Household | 565 (73.4%) | 205 (26.6%) |
| 2-Person Household | 375 (65.3%) | 199 (34.7%) |
| 3-Person Household | 188 (83.2%) | 38 (16.8%) |
| 4+ Person Household | 206 (61.7%) | 128 (38.3%) |
| Total Housing Units | 1,334 (70.1%) | 570 (29.9%) |
Occupancy by Educational Attainment in Riverdale borough
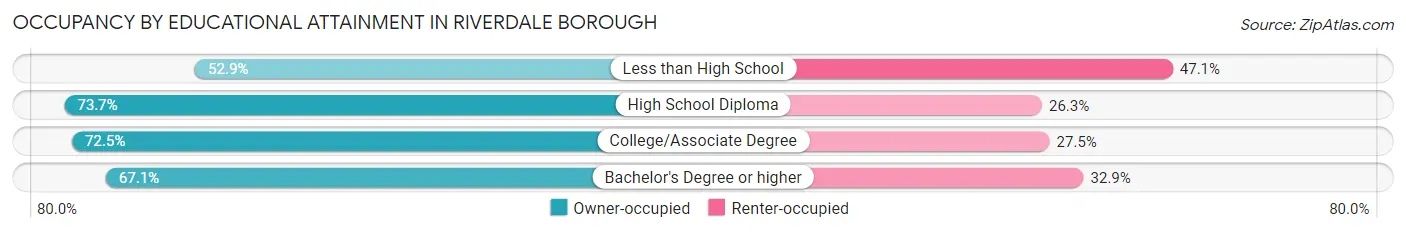
| Household Size | Owner-occupied | Renter-occupied |
| Less than High School | 9 (52.9%) | 8 (47.1%) |
| High School Diploma | 395 (73.7%) | 141 (26.3%) |
| College/Associate Degree | 316 (72.5%) | 120 (27.5%) |
| Bachelor's Degree or higher | 614 (67.1%) | 301 (32.9%) |
Occupancy by Age of Householder in Riverdale borough
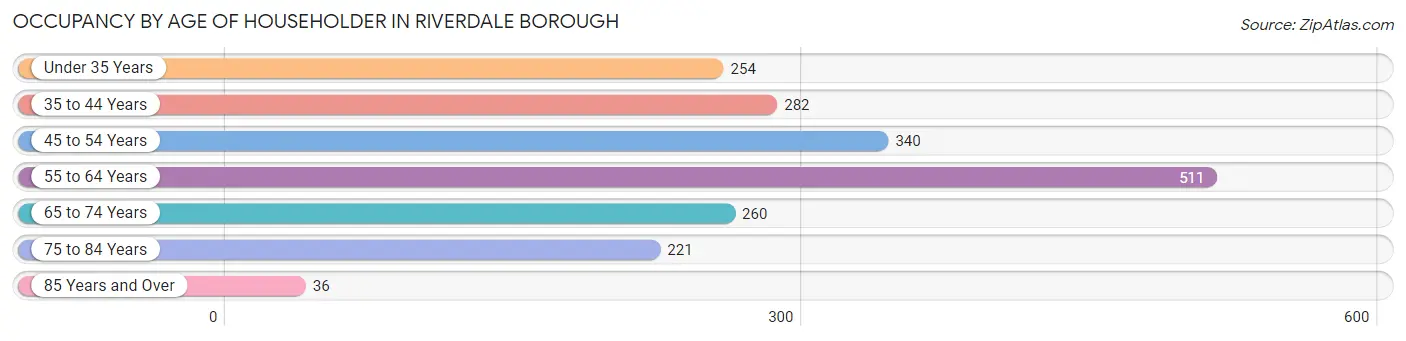
| Age Bracket | # Households | % Households |
| Under 35 Years | 254 | 13.3% |
| 35 to 44 Years | 282 | 14.8% |
| 45 to 54 Years | 340 | 17.9% |
| 55 to 64 Years | 511 | 26.8% |
| 65 to 74 Years | 260 | 13.7% |
| 75 to 84 Years | 221 | 11.6% |
| 85 Years and Over | 36 | 1.9% |
| Total | 1,904 | 100.0% |
Housing Finances in Riverdale borough
Median Income by Occupancy in Riverdale borough
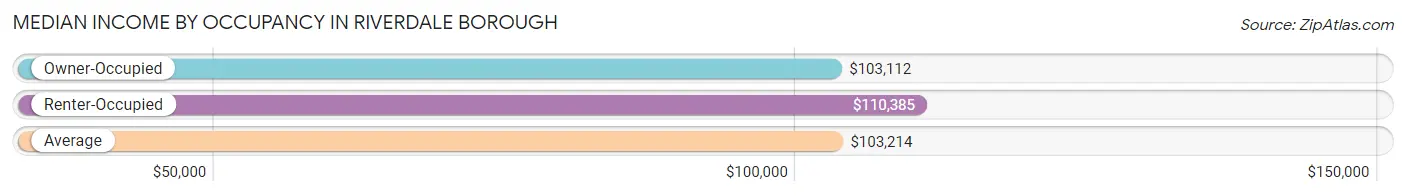
| Occupancy Type | # Households | Median Income |
| Owner-Occupied | 1,334 (70.1%) | $103,112 |
| Renter-Occupied | 570 (29.9%) | $110,385 |
| Average | 1,904 (100.0%) | $103,214 |
Occupancy by Householder Income Bracket in Riverdale borough
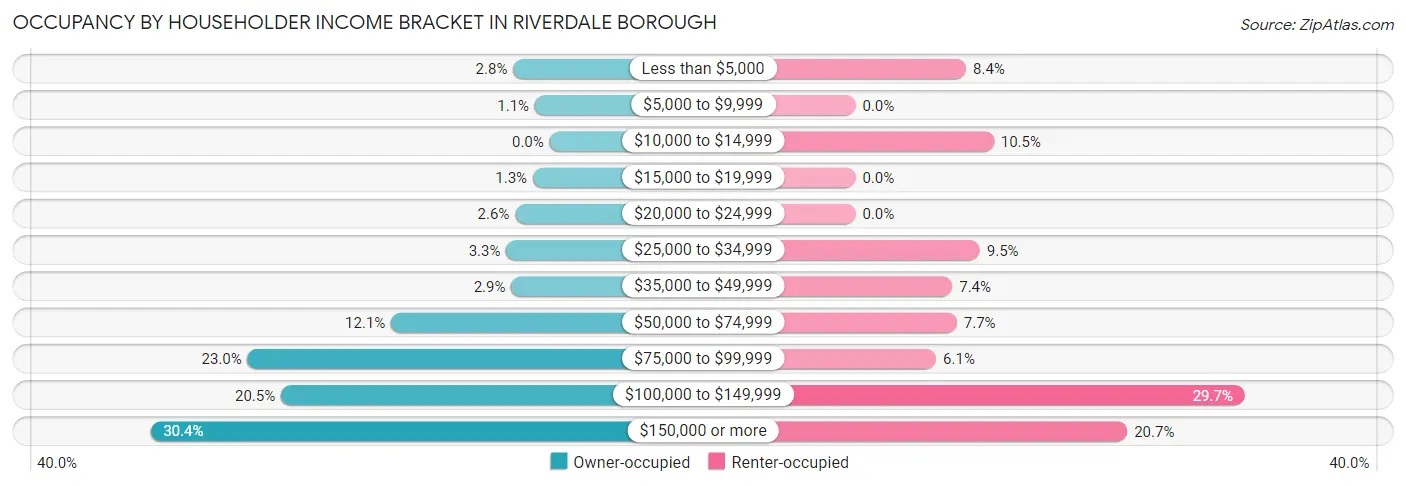
| Income Bracket | Owner-occupied | Renter-occupied |
| Less than $5,000 | 37 (2.8%) | 48 (8.4%) |
| $5,000 to $9,999 | 15 (1.1%) | 0 (0.0%) |
| $10,000 to $14,999 | 0 (0.0%) | 60 (10.5%) |
| $15,000 to $19,999 | 17 (1.3%) | 0 (0.0%) |
| $20,000 to $24,999 | 35 (2.6%) | 0 (0.0%) |
| $25,000 to $34,999 | 44 (3.3%) | 54 (9.5%) |
| $35,000 to $49,999 | 39 (2.9%) | 42 (7.4%) |
| $50,000 to $74,999 | 161 (12.1%) | 44 (7.7%) |
| $75,000 to $99,999 | 307 (23.0%) | 35 (6.1%) |
| $100,000 to $149,999 | 273 (20.5%) | 169 (29.6%) |
| $150,000 or more | 406 (30.4%) | 118 (20.7%) |
| Total | 1,334 (100.0%) | 570 (100.0%) |
Monthly Housing Cost Tiers in Riverdale borough
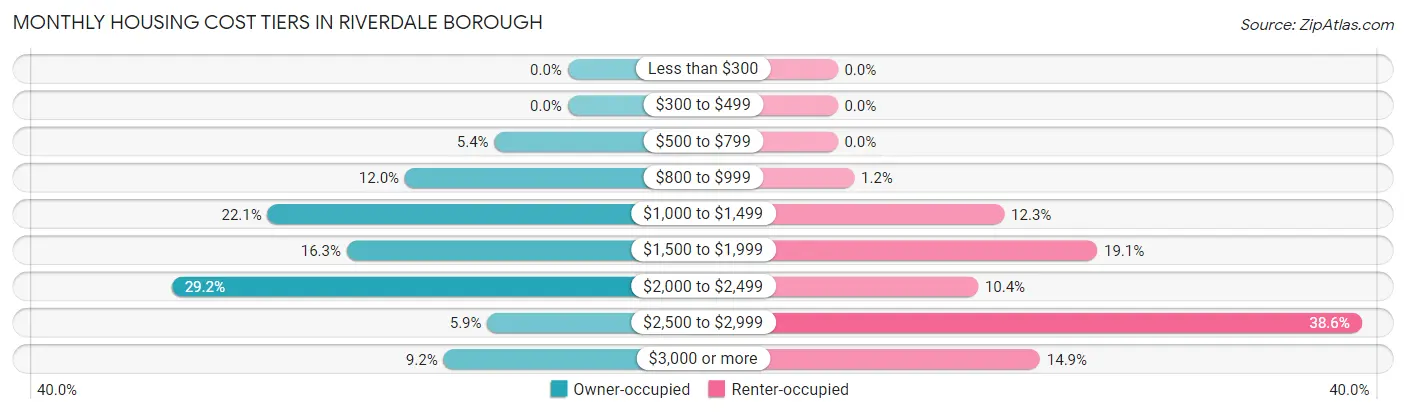
| Monthly Cost | Owner-occupied | Renter-occupied |
| Less than $300 | 0 (0.0%) | 0 (0.0%) |
| $300 to $499 | 0 (0.0%) | 0 (0.0%) |
| $500 to $799 | 72 (5.4%) | 0 (0.0%) |
| $800 to $999 | 160 (12.0%) | 7 (1.2%) |
| $1,000 to $1,499 | 295 (22.1%) | 70 (12.3%) |
| $1,500 to $1,999 | 217 (16.3%) | 109 (19.1%) |
| $2,000 to $2,499 | 389 (29.2%) | 59 (10.3%) |
| $2,500 to $2,999 | 79 (5.9%) | 220 (38.6%) |
| $3,000 or more | 122 (9.1%) | 85 (14.9%) |
| Total | 1,334 (100.0%) | 570 (100.0%) |
Physical Housing Characteristics in Riverdale borough
Housing Structures in Riverdale borough
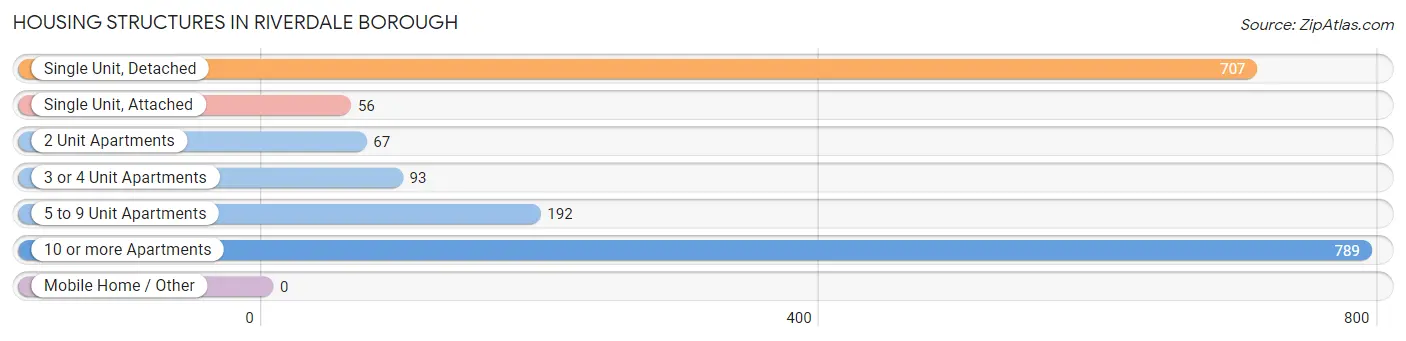
| Structure Type | # Housing Units | % Housing Units |
| Single Unit, Detached | 707 | 37.1% |
| Single Unit, Attached | 56 | 2.9% |
| 2 Unit Apartments | 67 | 3.5% |
| 3 or 4 Unit Apartments | 93 | 4.9% |
| 5 to 9 Unit Apartments | 192 | 10.1% |
| 10 or more Apartments | 789 | 41.4% |
| Mobile Home / Other | 0 | 0.0% |
| Total | 1,904 | 100.0% |
Housing Structures by Occupancy in Riverdale borough
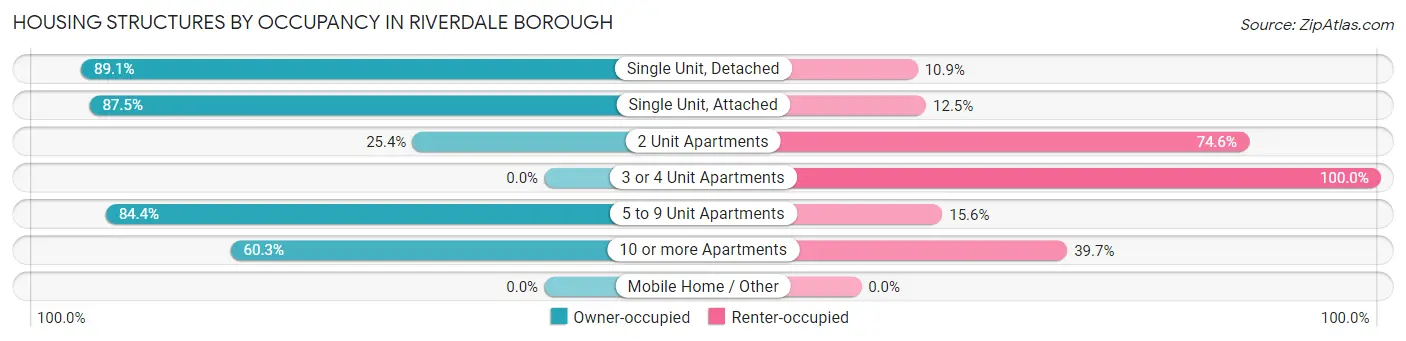
| Structure Type | Owner-occupied | Renter-occupied |
| Single Unit, Detached | 630 (89.1%) | 77 (10.9%) |
| Single Unit, Attached | 49 (87.5%) | 7 (12.5%) |
| 2 Unit Apartments | 17 (25.4%) | 50 (74.6%) |
| 3 or 4 Unit Apartments | 0 (0.0%) | 93 (100.0%) |
| 5 to 9 Unit Apartments | 162 (84.4%) | 30 (15.6%) |
| 10 or more Apartments | 476 (60.3%) | 313 (39.7%) |
| Mobile Home / Other | 0 (0.0%) | 0 (0.0%) |
| Total | 1,334 (70.1%) | 570 (29.9%) |
Housing Structures by Number of Rooms in Riverdale borough
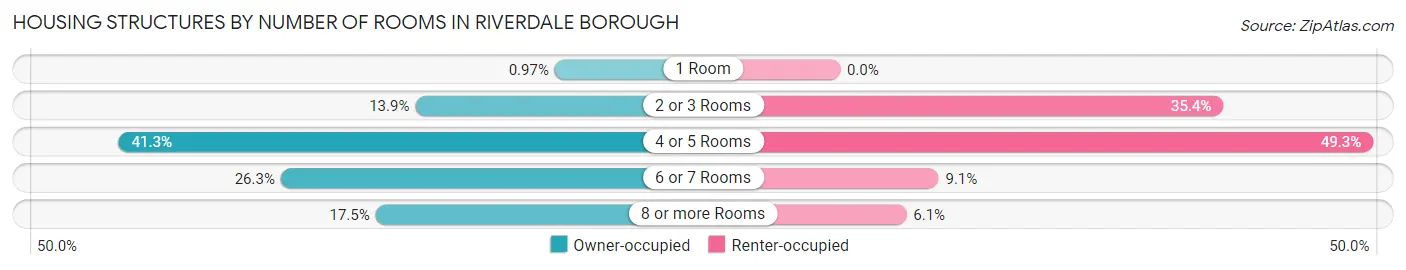
| Number of Rooms | Owner-occupied | Renter-occupied |
| 1 Room | 13 (1.0%) | 0 (0.0%) |
| 2 or 3 Rooms | 185 (13.9%) | 202 (35.4%) |
| 4 or 5 Rooms | 551 (41.3%) | 281 (49.3%) |
| 6 or 7 Rooms | 351 (26.3%) | 52 (9.1%) |
| 8 or more Rooms | 234 (17.5%) | 35 (6.1%) |
| Total | 1,334 (100.0%) | 570 (100.0%) |
Housing Structure by Heating Type in Riverdale borough
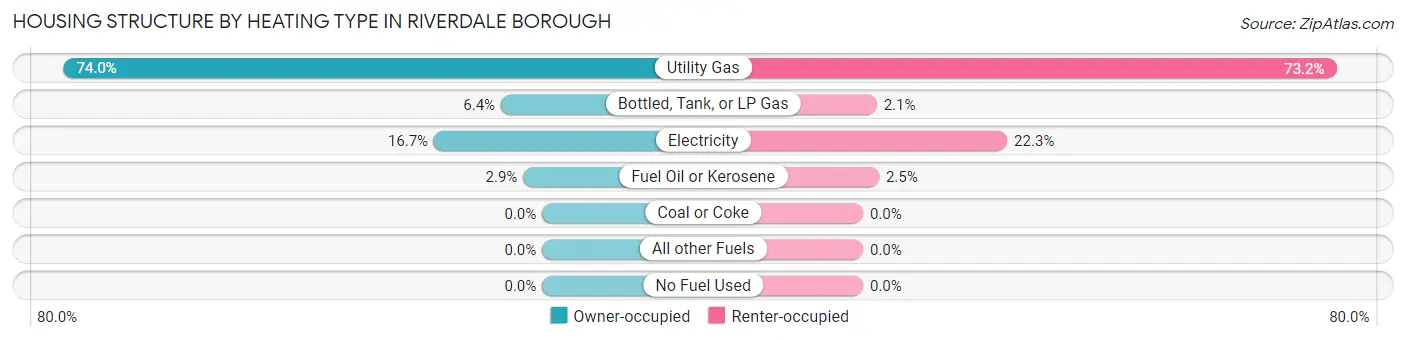
| Heating Type | Owner-occupied | Renter-occupied |
| Utility Gas | 987 (74.0%) | 417 (73.2%) |
| Bottled, Tank, or LP Gas | 85 (6.4%) | 12 (2.1%) |
| Electricity | 223 (16.7%) | 127 (22.3%) |
| Fuel Oil or Kerosene | 39 (2.9%) | 14 (2.5%) |
| Coal or Coke | 0 (0.0%) | 0 (0.0%) |
| All other Fuels | 0 (0.0%) | 0 (0.0%) |
| No Fuel Used | 0 (0.0%) | 0 (0.0%) |
| Total | 1,334 (100.0%) | 570 (100.0%) |
Household Vehicle Usage in Riverdale borough
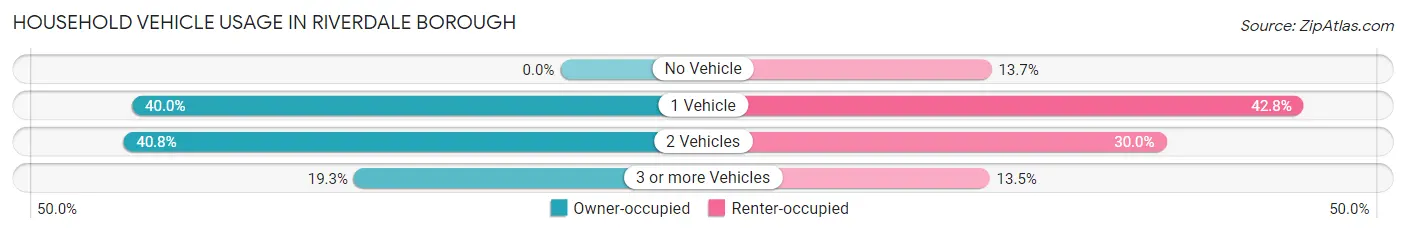
| Vehicles per Household | Owner-occupied | Renter-occupied |
| No Vehicle | 0 (0.0%) | 78 (13.7%) |
| 1 Vehicle | 533 (40.0%) | 244 (42.8%) |
| 2 Vehicles | 544 (40.8%) | 171 (30.0%) |
| 3 or more Vehicles | 257 (19.3%) | 77 (13.5%) |
| Total | 1,334 (100.0%) | 570 (100.0%) |
Real Estate & Mortgages in Riverdale borough
Real Estate and Mortgage Overview in Riverdale borough
| Characteristic | Without Mortgage | With Mortgage |
| Housing Units | 510 | 824 |
| Median Property Value | $385,200 | $381,700 |
| Median Household Income | $98,614 | $260 |
| Monthly Housing Costs | $1,042 | $122 |
| Real Estate Taxes | $6,637 | $19 |
Property Value by Mortgage Status in Riverdale borough
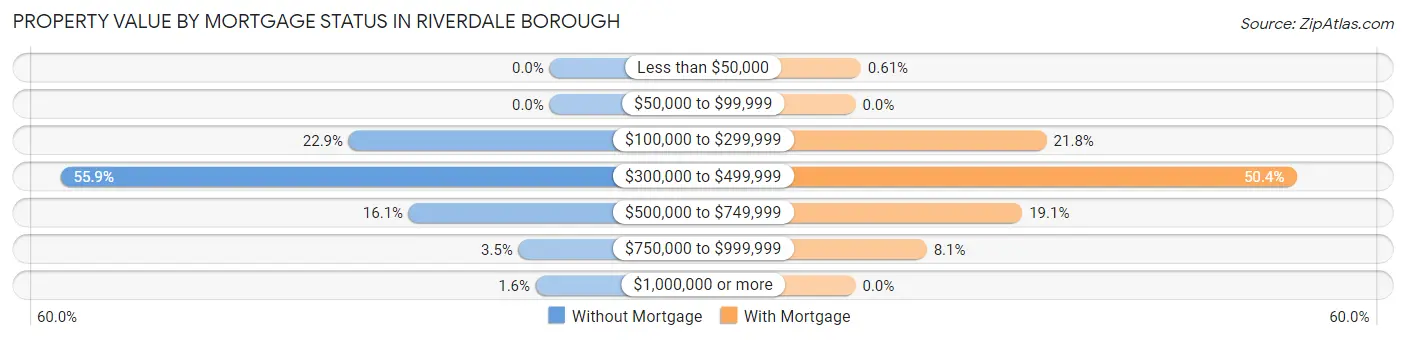
| Property Value | Without Mortgage | With Mortgage |
| Less than $50,000 | 0 (0.0%) | 5 (0.6%) |
| $50,000 to $99,999 | 0 (0.0%) | 0 (0.0%) |
| $100,000 to $299,999 | 117 (22.9%) | 180 (21.8%) |
| $300,000 to $499,999 | 285 (55.9%) | 415 (50.4%) |
| $500,000 to $749,999 | 82 (16.1%) | 157 (19.1%) |
| $750,000 to $999,999 | 18 (3.5%) | 67 (8.1%) |
| $1,000,000 or more | 8 (1.6%) | 0 (0.0%) |
| Total | 510 (100.0%) | 824 (100.0%) |
Household Income by Mortgage Status in Riverdale borough
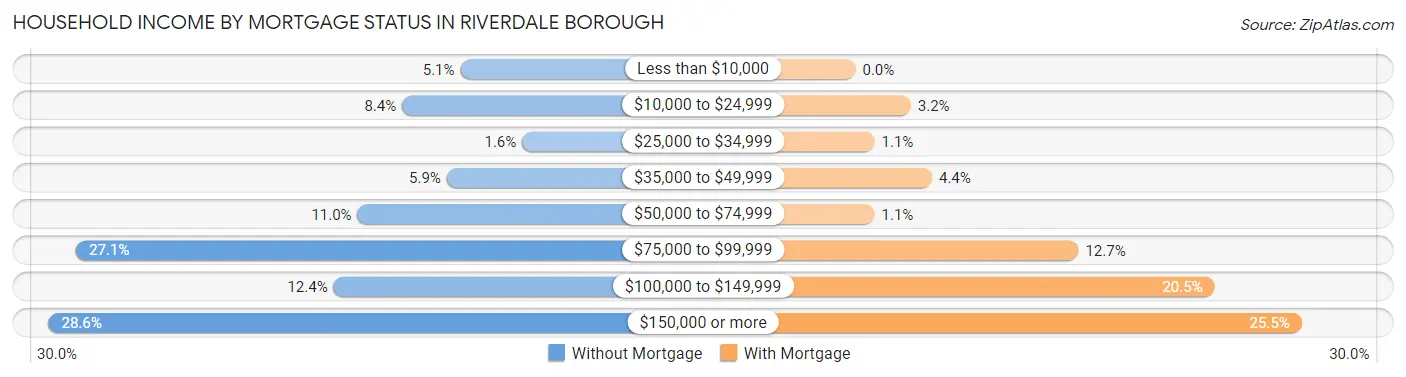
| Household Income | Without Mortgage | With Mortgage |
| Less than $10,000 | 26 (5.1%) | 0 (0.0%) |
| $10,000 to $24,999 | 43 (8.4%) | 26 (3.2%) |
| $25,000 to $34,999 | 8 (1.6%) | 9 (1.1%) |
| $35,000 to $49,999 | 30 (5.9%) | 36 (4.4%) |
| $50,000 to $74,999 | 56 (11.0%) | 9 (1.1%) |
| $75,000 to $99,999 | 138 (27.1%) | 105 (12.7%) |
| $100,000 to $149,999 | 63 (12.3%) | 169 (20.5%) |
| $150,000 or more | 146 (28.6%) | 210 (25.5%) |
| Total | 510 (100.0%) | 824 (100.0%) |
Property Value to Household Income Ratio in Riverdale borough
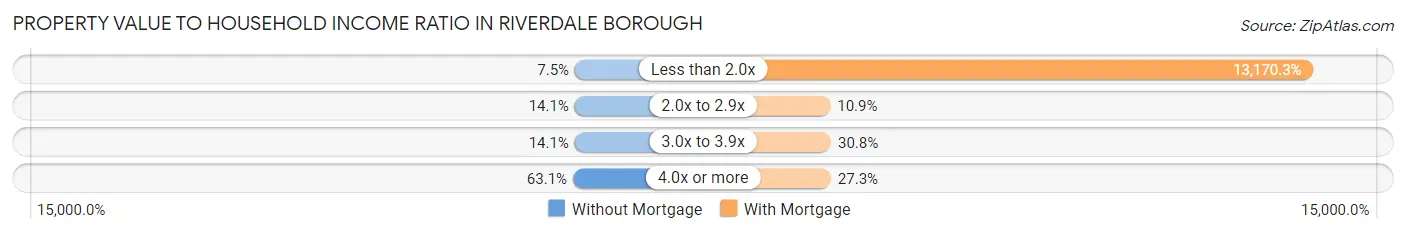
| Value-to-Income Ratio | Without Mortgage | With Mortgage |
| Less than 2.0x | 38 (7.4%) | 108,523 (13,170.3%) |
| 2.0x to 2.9x | 72 (14.1%) | 90 (10.9%) |
| 3.0x to 3.9x | 72 (14.1%) | 254 (30.8%) |
| 4.0x or more | 322 (63.1%) | 225 (27.3%) |
| Total | 510 (100.0%) | 824 (100.0%) |
Real Estate Taxes by Mortgage Status in Riverdale borough
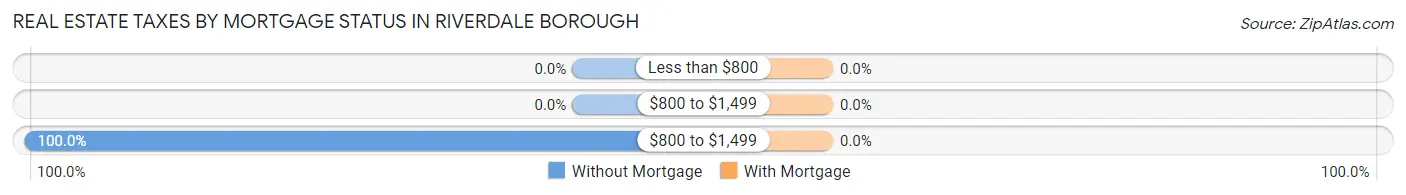
| Property Taxes | Without Mortgage | With Mortgage |
| Less than $800 | 0 (0.0%) | 0 (0.0%) |
| $800 to $1,499 | 0 (0.0%) | 0 (0.0%) |
| $800 to $1,499 | 510 (100.0%) | 0 (0.0%) |
| Total | 510 (100.0%) | 824 (100.0%) |
Health & Disability in Riverdale borough
Health Insurance Coverage by Age in Riverdale borough
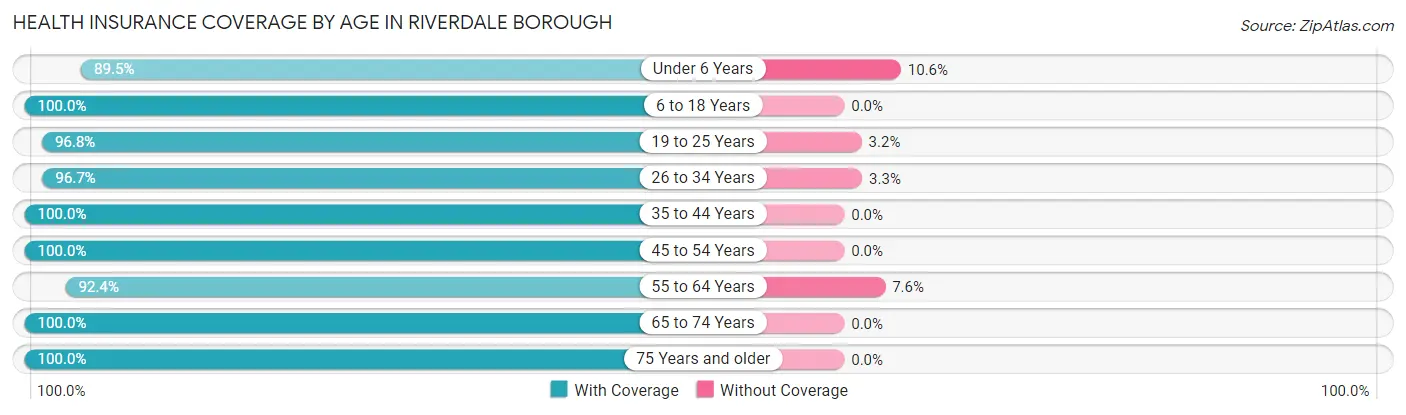
| Age Bracket | With Coverage | Without Coverage |
| Under 6 Years | 229 (89.4%) | 27 (10.5%) |
| 6 to 18 Years | 515 (100.0%) | 0 (0.0%) |
| 19 to 25 Years | 269 (96.8%) | 9 (3.2%) |
| 26 to 34 Years | 377 (96.7%) | 13 (3.3%) |
| 35 to 44 Years | 441 (100.0%) | 0 (0.0%) |
| 45 to 54 Years | 586 (100.0%) | 0 (0.0%) |
| 55 to 64 Years | 726 (92.4%) | 60 (7.6%) |
| 65 to 74 Years | 532 (100.0%) | 0 (0.0%) |
| 75 Years and older | 297 (100.0%) | 0 (0.0%) |
| Total | 3,972 (97.3%) | 109 (2.7%) |
Health Insurance Coverage by Citizenship Status in Riverdale borough
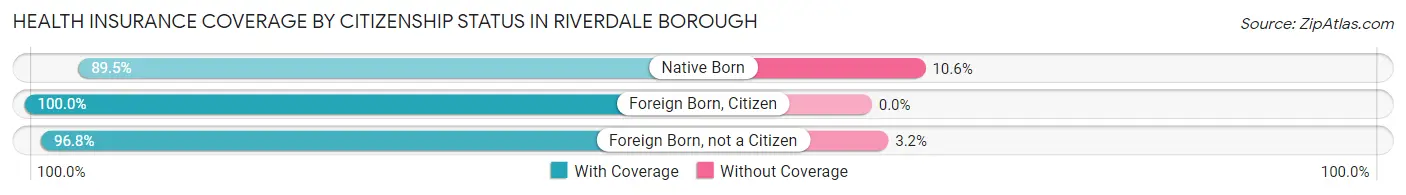
| Citizenship Status | With Coverage | Without Coverage |
| Native Born | 229 (89.4%) | 27 (10.5%) |
| Foreign Born, Citizen | 515 (100.0%) | 0 (0.0%) |
| Foreign Born, not a Citizen | 269 (96.8%) | 9 (3.2%) |
Health Insurance Coverage by Household Income in Riverdale borough
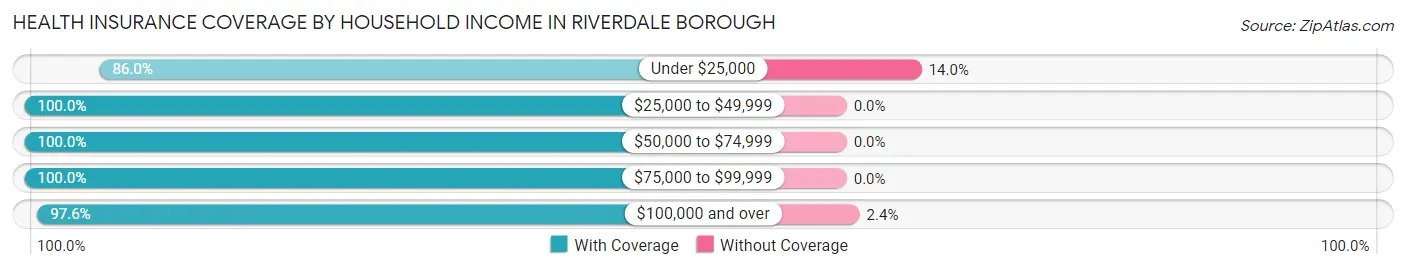
| Household Income | With Coverage | Without Coverage |
| Under $25,000 | 294 (86.0%) | 48 (14.0%) |
| $25,000 to $49,999 | 254 (100.0%) | 0 (0.0%) |
| $50,000 to $74,999 | 331 (100.0%) | 0 (0.0%) |
| $75,000 to $99,999 | 623 (100.0%) | 0 (0.0%) |
| $100,000 and over | 2,470 (97.6%) | 61 (2.4%) |
Public vs Private Health Insurance Coverage by Age in Riverdale borough
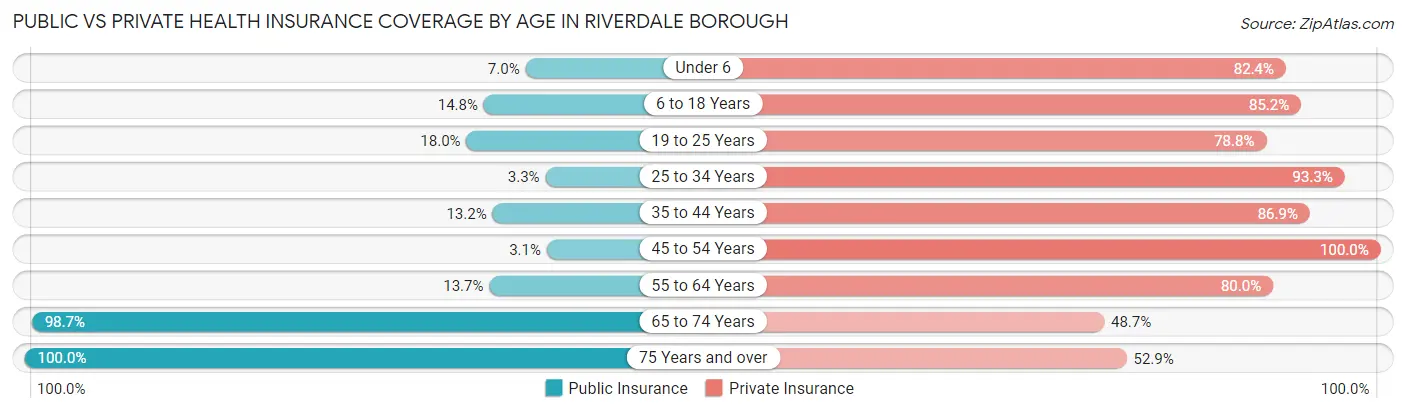
| Age Bracket | Public Insurance | Private Insurance |
| Under 6 | 18 (7.0%) | 211 (82.4%) |
| 6 to 18 Years | 76 (14.8%) | 439 (85.2%) |
| 19 to 25 Years | 50 (18.0%) | 219 (78.8%) |
| 25 to 34 Years | 13 (3.3%) | 364 (93.3%) |
| 35 to 44 Years | 58 (13.2%) | 383 (86.9%) |
| 45 to 54 Years | 18 (3.1%) | 586 (100.0%) |
| 55 to 64 Years | 108 (13.7%) | 629 (80.0%) |
| 65 to 74 Years | 525 (98.7%) | 259 (48.7%) |
| 75 Years and over | 297 (100.0%) | 157 (52.9%) |
| Total | 1,163 (28.5%) | 3,247 (79.6%) |
Disability Status by Sex by Age in Riverdale borough
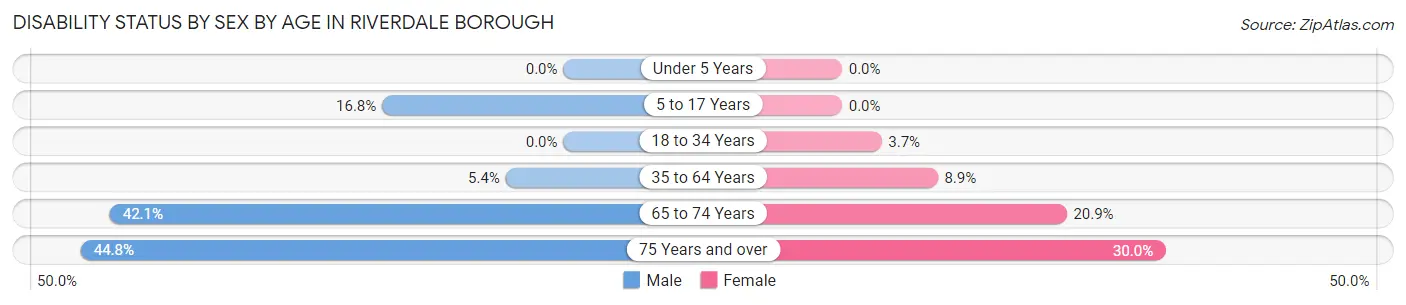
| Age Bracket | Male | Female |
| Under 5 Years | 0 (0.0%) | 0 (0.0%) |
| 5 to 17 Years | 73 (16.8%) | 0 (0.0%) |
| 18 to 34 Years | 0 (0.0%) | 12 (3.7%) |
| 35 to 64 Years | 47 (5.3%) | 83 (8.9%) |
| 65 to 74 Years | 125 (42.1%) | 49 (20.8%) |
| 75 Years and over | 30 (44.8%) | 69 (30.0%) |
Disability Class by Sex by Age in Riverdale borough
Disability Class: Hearing Difficulty
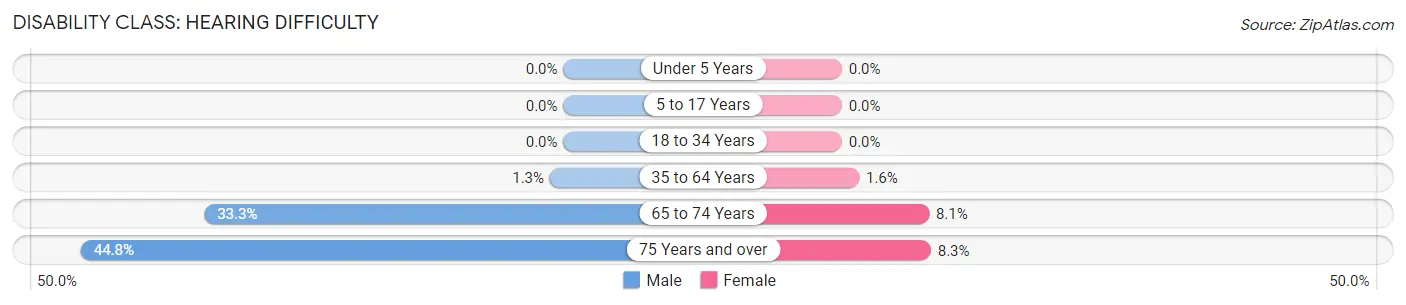
| Age Bracket | Male | Female |
| Under 5 Years | 0 (0.0%) | 0 (0.0%) |
| 5 to 17 Years | 0 (0.0%) | 0 (0.0%) |
| 18 to 34 Years | 0 (0.0%) | 0 (0.0%) |
| 35 to 64 Years | 11 (1.3%) | 15 (1.6%) |
| 65 to 74 Years | 99 (33.3%) | 19 (8.1%) |
| 75 Years and over | 30 (44.8%) | 19 (8.3%) |
Disability Class: Vision Difficulty
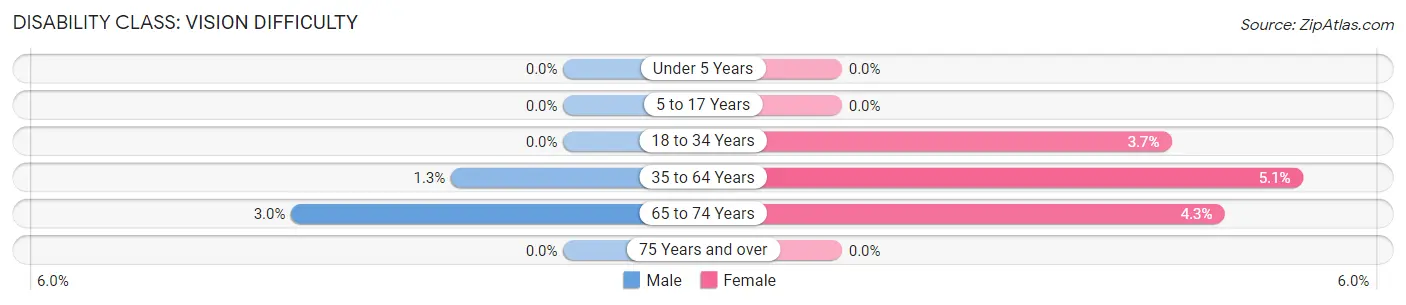
| Age Bracket | Male | Female |
| Under 5 Years | 0 (0.0%) | 0 (0.0%) |
| 5 to 17 Years | 0 (0.0%) | 0 (0.0%) |
| 18 to 34 Years | 0 (0.0%) | 12 (3.7%) |
| 35 to 64 Years | 11 (1.3%) | 48 (5.1%) |
| 65 to 74 Years | 9 (3.0%) | 10 (4.3%) |
| 75 Years and over | 0 (0.0%) | 0 (0.0%) |
Disability Class: Cognitive Difficulty
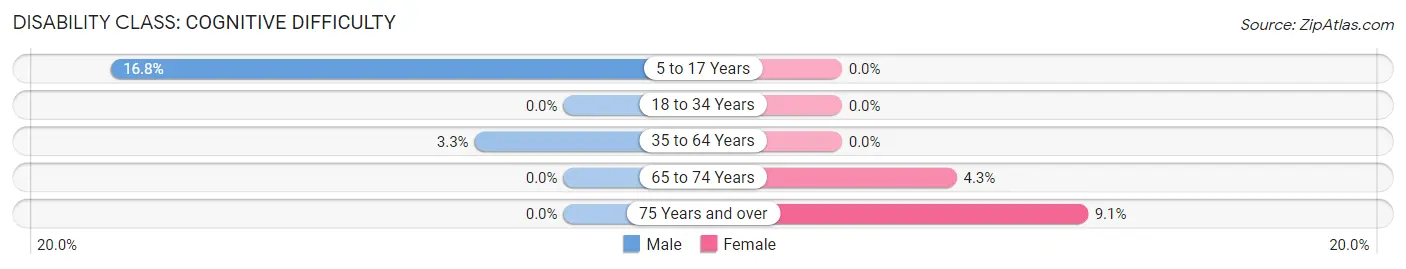
| Age Bracket | Male | Female |
| 5 to 17 Years | 73 (16.8%) | 0 (0.0%) |
| 18 to 34 Years | 0 (0.0%) | 0 (0.0%) |
| 35 to 64 Years | 29 (3.3%) | 0 (0.0%) |
| 65 to 74 Years | 0 (0.0%) | 10 (4.3%) |
| 75 Years and over | 0 (0.0%) | 21 (9.1%) |
Disability Class: Ambulatory Difficulty
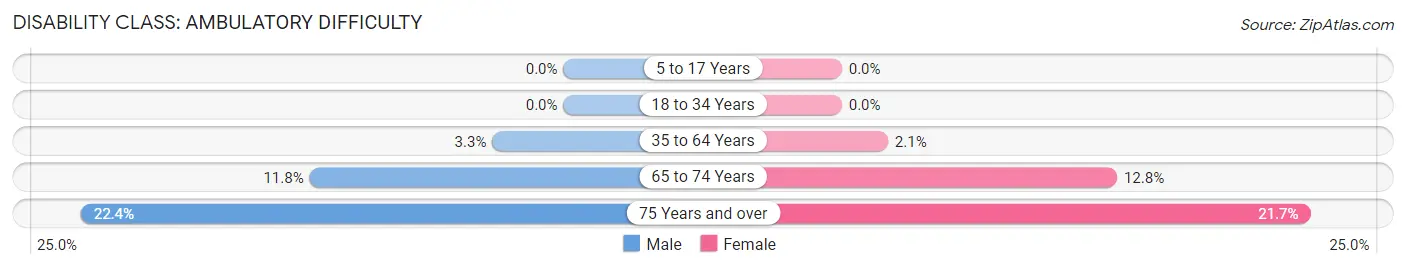
| Age Bracket | Male | Female |
| 5 to 17 Years | 0 (0.0%) | 0 (0.0%) |
| 18 to 34 Years | 0 (0.0%) | 0 (0.0%) |
| 35 to 64 Years | 29 (3.3%) | 20 (2.1%) |
| 65 to 74 Years | 35 (11.8%) | 30 (12.8%) |
| 75 Years and over | 15 (22.4%) | 50 (21.7%) |
Disability Class: Self-Care Difficulty
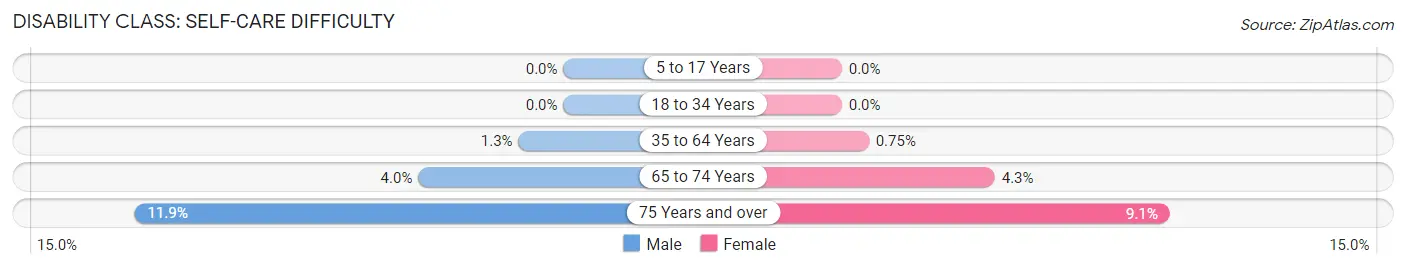
| Age Bracket | Male | Female |
| 5 to 17 Years | 0 (0.0%) | 0 (0.0%) |
| 18 to 34 Years | 0 (0.0%) | 0 (0.0%) |
| 35 to 64 Years | 11 (1.3%) | 7 (0.7%) |
| 65 to 74 Years | 12 (4.0%) | 10 (4.3%) |
| 75 Years and over | 8 (11.9%) | 21 (9.1%) |
Technology Access in Riverdale borough
Computing Device Access in Riverdale borough
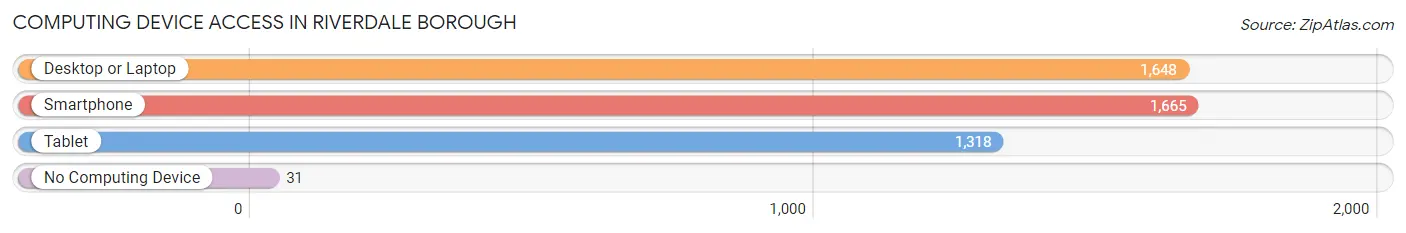
| Device Type | # Households | % Households |
| Desktop or Laptop | 1,648 | 86.6% |
| Smartphone | 1,665 | 87.5% |
| Tablet | 1,318 | 69.2% |
| No Computing Device | 31 | 1.6% |
| Total | 1,904 | 100.0% |
Internet Access in Riverdale borough
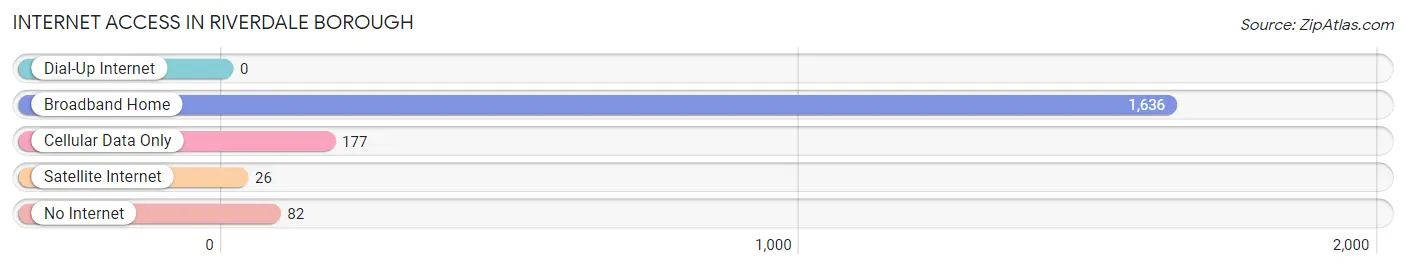
| Internet Type | # Households | % Households |
| Dial-Up Internet | 0 | 0.0% |
| Broadband Home | 1,636 | 85.9% |
| Cellular Data Only | 177 | 9.3% |
| Satellite Internet | 26 | 1.4% |
| No Internet | 82 | 4.3% |
| Total | 1,904 | 100.0% |
Riverdale borough Summary
Riverdale Borough is a small borough located in Morris County, New Jersey. It is situated in the northern part of the state, just south of the New York border. The borough is bordered by the towns of Butler, Kinnelon, and Pequannock. The population of Riverdale Borough was 5,819 as of the 2010 census.
Geography
Riverdale Borough is located at 40°54'25" North, 74°20'45" West (40.9069, -74.3458). According to the United States Census Bureau, the borough has a total area of 2.2 square miles (5.7 km2), all of which is land.
The borough is located in the Ramapo Valley, which is part of the Great Appalachian Valley. The borough is situated on the western side of the Ramapo Mountains, which form the eastern border of the borough. The borough is also located on the Passaic River, which forms the western border of the borough.
Climate
Riverdale Borough has a humid continental climate, with cold winters and hot, humid summers. The average annual temperature is 48°F (9°C). The average annual precipitation is 44.3 inches (112.5 cm).
Demographics
As of the 2010 census, there were 5,819 people, 2,093 households, and 1,541 families residing in the borough. The population density was 2,637.2 people per square mile (1,017.2/km2). There were 2,209 housing units at an average density of 990.2 per square mile (382.2/km2). The racial makeup of the borough was 87.2% White, 4.2% African American, 0.2% Native American, 4.7% Asian, 0.1% Pacific Islander, 1.7% from other races, and 2.0% from two or more races. Hispanic or Latino of any race were 6.7% of the population.
Economy
Riverdale Borough is a small, rural community with a primarily residential economy. The borough is home to several small businesses, including a few restaurants, a grocery store, and a few retail stores. The borough also has a few industrial businesses, including a printing company and a plastics manufacturer.
The borough is served by the New Jersey Transit bus system, which provides service to New York City and other nearby towns. The borough is also served by the New Jersey Turnpike, which runs through the borough.
Education
Riverdale Borough is served by the Riverdale School District, which consists of two elementary schools, one middle school, and one high school. The district also operates a preschool and a special education program. The district is also home to the Riverdale Public Library, which serves the borough and surrounding communities.
Conclusion
Riverdale Borough is a small borough located in Morris County, New Jersey. It is situated in the northern part of the state, just south of the New York border. The borough is bordered by the towns of Butler, Kinnelon, and Pequannock. The population of Riverdale Borough was 5,819 as of the 2010 census. The borough has a humid continental climate, with cold winters and hot, humid summers. The borough has a primarily residential economy, with a few small businesses and industrial businesses. The borough is served by the Riverdale School District, which consists of two elementary schools, one middle school, and one high school. The district also operates a preschool and a special education program. The district is also home to the Riverdale Public Library, which serves the borough and surrounding communities.
Common Questions
What is Per Capita Income in Riverdale borough?
Per Capita income in Riverdale borough is $57,148.
What is the Median Family Income in Riverdale borough?
Median Family Income in Riverdale borough is $145,625.
What is the Median Household income in Riverdale borough?
Median Household Income in Riverdale borough is $103,214.
What is Income or Wage Gap in Riverdale borough?
Income or Wage Gap in Riverdale borough is 50.3%.
Women in Riverdale borough earn 49.7 cents for every dollar earned by a man.
What is Inequality or Gini Index in Riverdale borough?
Inequality or Gini Index in Riverdale borough is 0.39.
What is the Total Population of Riverdale borough?
Total Population of Riverdale borough is 4,081.
What is the Total Male Population of Riverdale borough?
Total Male Population of Riverdale borough is 2,070.
What is the Total Female Population of Riverdale borough?
Total Female Population of Riverdale borough is 2,011.
What is the Ratio of Males per 100 Females in Riverdale borough?
There are 102.93 Males per 100 Females in Riverdale borough.
What is the Ratio of Females per 100 Males in Riverdale borough?
There are 97.15 Females per 100 Males in Riverdale borough.
What is the Median Population Age in Riverdale borough?
Median Population Age in Riverdale borough is 49.0 Years.
What is the Average Family Size in Riverdale borough
Average Family Size in Riverdale borough is 3.0 People.
What is the Average Household Size in Riverdale borough
Average Household Size in Riverdale borough is 2.1 People.
How Large is the Labor Force in Riverdale borough?
There are 2,290 People in the Labor Forcein in Riverdale borough.
What is the Percentage of People in the Labor Force in Riverdale borough?
66.7% of People are in the Labor Force in Riverdale borough.
What is the Unemployment Rate in Riverdale borough?
Unemployment Rate in Riverdale borough is 2.4%.