Zip Codes with the Highest Percentage of Households Without a Vehicle in Camden, NJ
RELATED REPORTS & OPTIONS
Households without a Cars
Camden
Compare Zip Codes
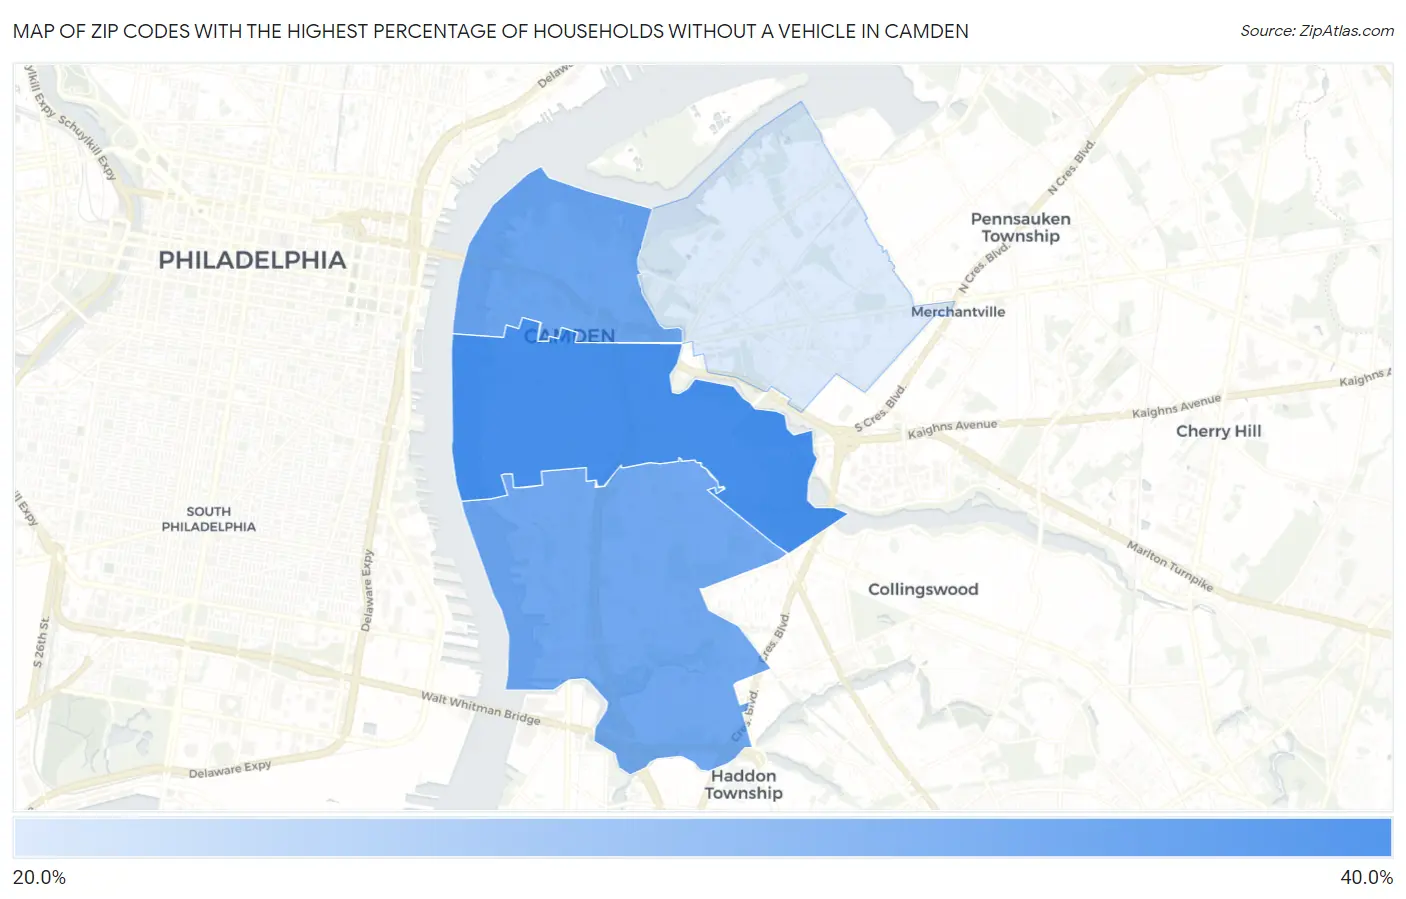
Map of Zip Codes with the Highest Percentage of Households Without a Vehicle in Camden
28.3%
37.7%
Zip Codes with the Highest Percentage of Households Without a Vehicle in Camden, NJ
| Zip Code | Housholds Without a Car | vs State | vs National | |
| 1. | 08103 | 37.7% | 11.3%(+26.4)#19 | 8.3%(+29.4)#567 |
| 2. | 08102 | 35.3% | 11.3%(+24.0)#22 | 8.3%(+27.0)#630 |
| 3. | 08104 | 35.0% | 11.3%(+23.7)#23 | 8.3%(+26.7)#637 |
| 4. | 08105 | 28.3% | 11.3%(+17.0)#38 | 8.3%(+20.0)#880 |
1
Common Questions
What are the Top 3 Zip Codes with the Highest Percentage of Households Without a Vehicle in Camden, NJ?
Top 3 Zip Codes with the Highest Percentage of Households Without a Vehicle in Camden, NJ are:
What zip code has the Highest Percentage of Households Without a Vehicle in Camden, NJ?
08103 has the Highest Percentage of Households Without a Vehicle in Camden, NJ with 37.7%.
What is the Percentage of Households Without a Vehicle in Camden, NJ?
Percentage of Households Without a Vehicle in Camden is 32.7%.
What is the Percentage of Households Without a Vehicle in New Jersey?
Percentage of Households Without a Vehicle in New Jersey is 11.3%.
What is the Percentage of Households Without a Vehicle in the United States?
Percentage of Households Without a Vehicle in the United States is 8.3%.