Zip Codes with the Highest Percentage of Households Without a Vehicle in Absecon, NJ
RELATED REPORTS & OPTIONS
Households without a Cars
Absecon
Compare Zip Codes
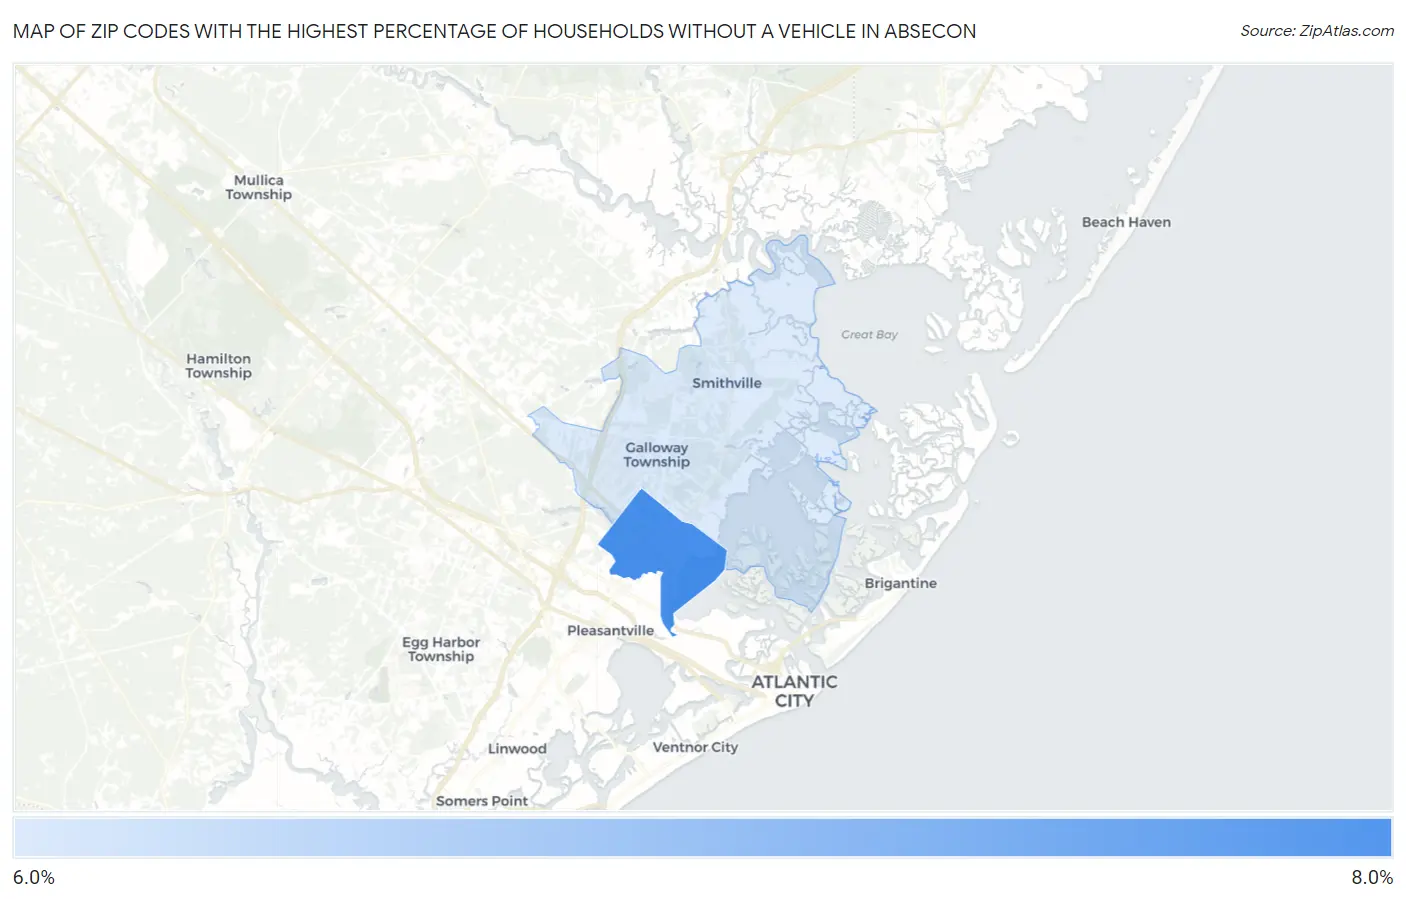
Map of Zip Codes with the Highest Percentage of Households Without a Vehicle in Absecon
6.1%
6.9%
Zip Codes with the Highest Percentage of Households Without a Vehicle in Absecon, NJ
| Zip Code | Housholds Without a Car | vs State | vs National | |
| 1. | 08201 | 6.9% | 11.3%(-4.40)#187 | 8.3%(-1.40)#8,759 |
| 2. | 08205 | 6.1% | 11.3%(-5.20)#224 | 8.3%(-2.20)#10,202 |
1
Common Questions
What are the Top Zip Codes with the Highest Percentage of Households Without a Vehicle in Absecon, NJ?
Top Zip Codes with the Highest Percentage of Households Without a Vehicle in Absecon, NJ are:
What zip code has the Highest Percentage of Households Without a Vehicle in Absecon, NJ?
08201 has the Highest Percentage of Households Without a Vehicle in Absecon, NJ with 6.9%.
What is the Percentage of Households Without a Vehicle in Absecon, NJ?
Percentage of Households Without a Vehicle in Absecon is 6.1%.
What is the Percentage of Households Without a Vehicle in New Jersey?
Percentage of Households Without a Vehicle in New Jersey is 11.3%.
What is the Percentage of Households Without a Vehicle in the United States?
Percentage of Households Without a Vehicle in the United States is 8.3%.