Zip Codes with the Highest Percentage of Households Without a Vehicle in Trenton, NJ
RELATED REPORTS & OPTIONS
Households without a Cars
Trenton
Compare Zip Codes
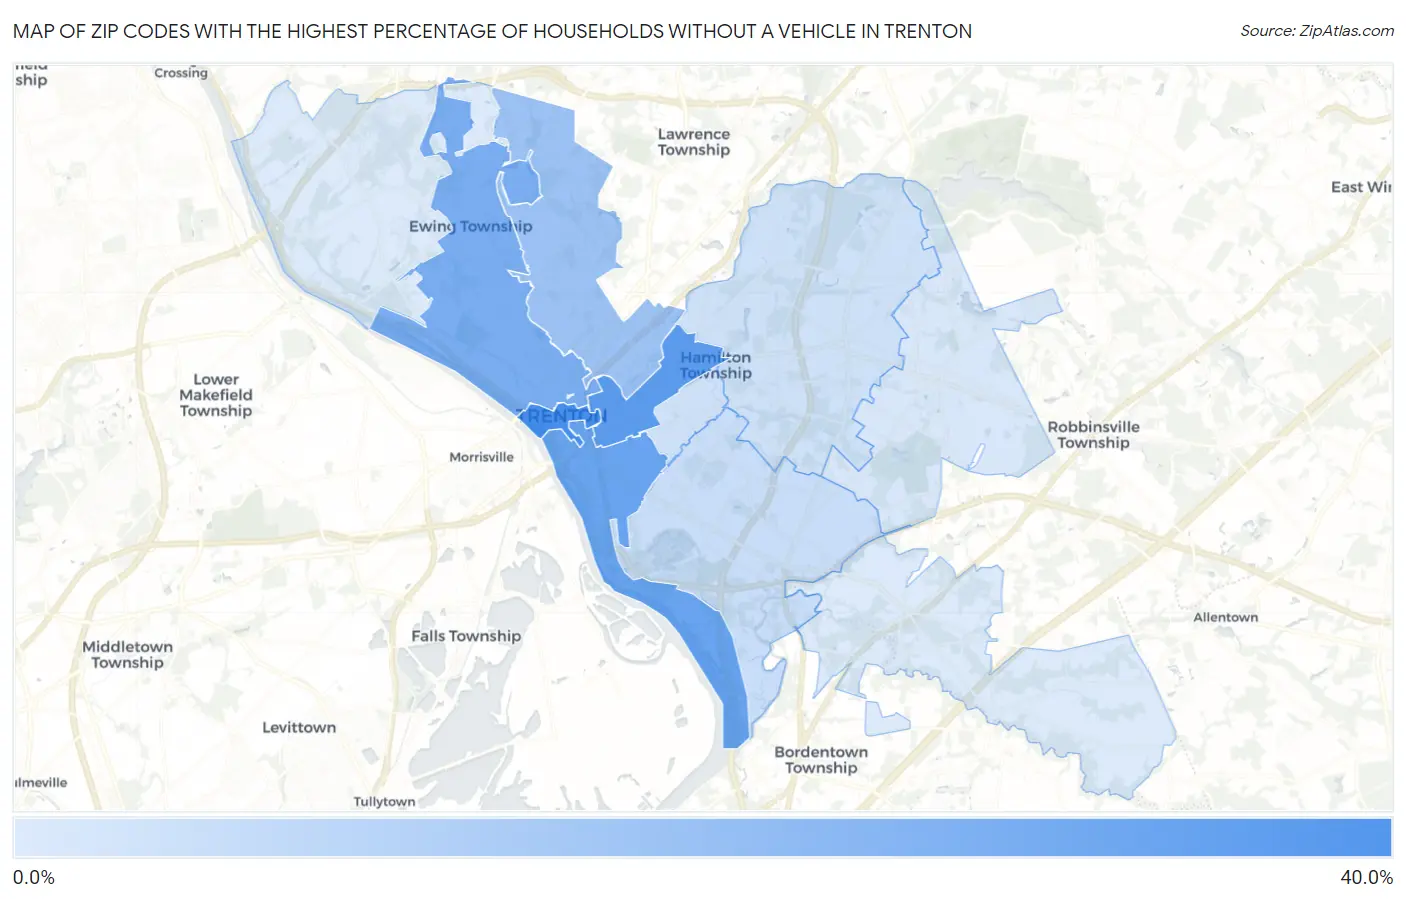
Map of Zip Codes with the Highest Percentage of Households Without a Vehicle in Trenton
3.1%
38.5%
Zip Codes with the Highest Percentage of Households Without a Vehicle in Trenton, NJ
| Zip Code | Housholds Without a Car | vs State | vs National | |
| 1. | 08608 | 38.5% | 11.3%(+27.2)#18 | 8.3%(+30.2)#548 |
| 2. | 08609 | 33.6% | 11.3%(+22.3)#27 | 8.3%(+25.3)#670 |
| 3. | 08611 | 29.4% | 11.3%(+18.1)#37 | 8.3%(+21.1)#829 |
| 4. | 08618 | 25.2% | 11.3%(+13.9)#46 | 8.3%(+16.9)#1,052 |
| 5. | 08638 | 17.8% | 11.3%(+6.50)#63 | 8.3%(+9.50)#1,812 |
| 6. | 08610 | 7.2% | 11.3%(-4.10)#175 | 8.3%(-1.10)#8,200 |
| 7. | 08619 | 6.1% | 11.3%(-5.20)#226 | 8.3%(-2.20)#10,225 |
| 8. | 08629 | 6.0% | 11.3%(-5.30)#232 | 8.3%(-2.30)#10,483 |
| 9. | 08690 | 4.1% | 11.3%(-7.20)#336 | 8.3%(-4.20)#15,419 |
| 10. | 08620 | 3.3% | 11.3%(-8.00)#386 | 8.3%(-5.00)#18,056 |
| 11. | 08628 | 3.1% | 11.3%(-8.20)#403 | 8.3%(-5.20)#18,805 |
1
Common Questions
What are the Top 10 Zip Codes with the Highest Percentage of Households Without a Vehicle in Trenton, NJ?
Top 10 Zip Codes with the Highest Percentage of Households Without a Vehicle in Trenton, NJ are:
What zip code has the Highest Percentage of Households Without a Vehicle in Trenton, NJ?
08608 has the Highest Percentage of Households Without a Vehicle in Trenton, NJ with 38.5%.
What is the Percentage of Households Without a Vehicle in Trenton, NJ?
Percentage of Households Without a Vehicle in Trenton is 29.4%.
What is the Percentage of Households Without a Vehicle in New Jersey?
Percentage of Households Without a Vehicle in New Jersey is 11.3%.
What is the Percentage of Households Without a Vehicle in the United States?
Percentage of Households Without a Vehicle in the United States is 8.3%.