Brookfield, NJ Map & Demographics
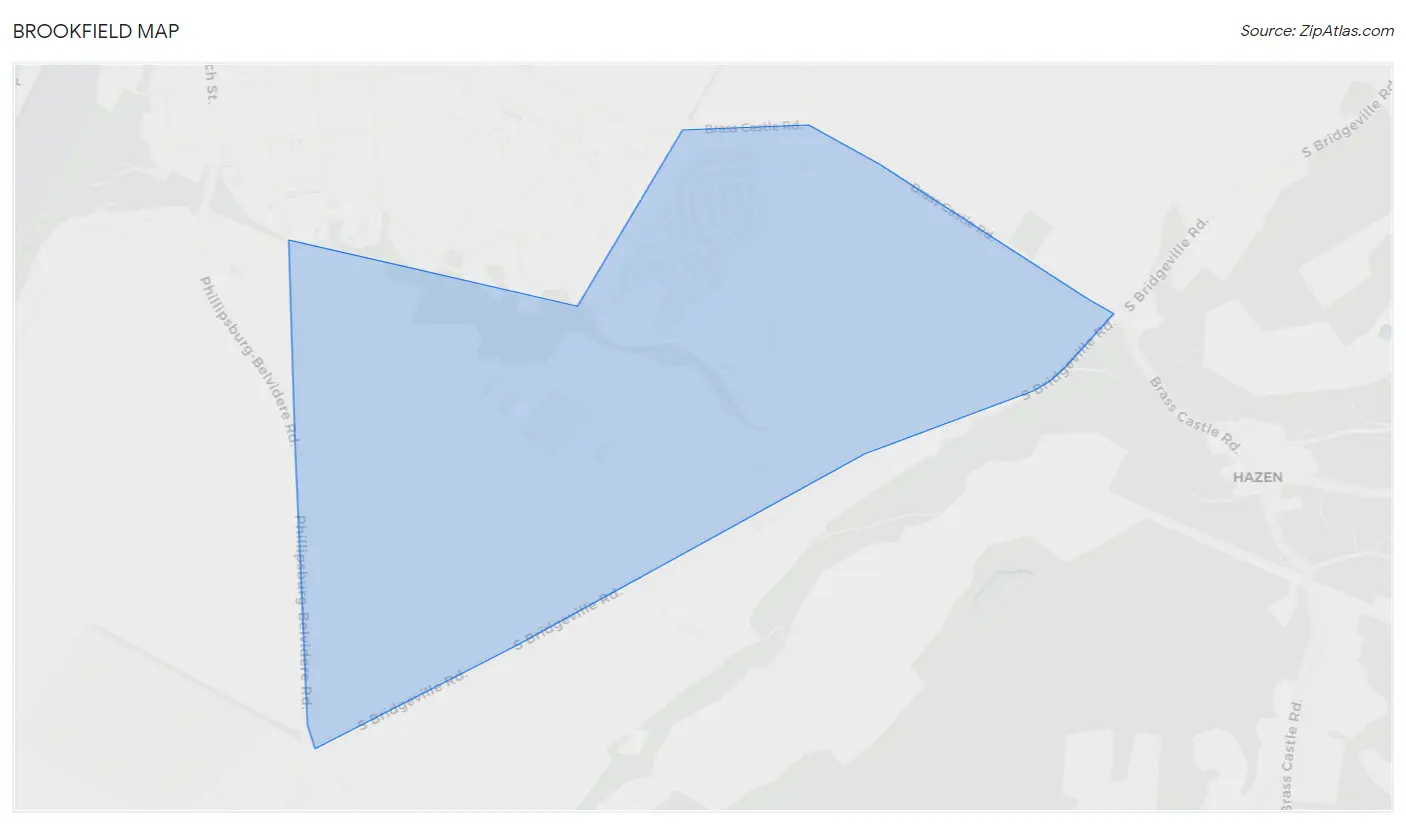
Brookfield Map
Brookfield Overview
$41,338
PER CAPITA INCOME
$91,229
AVG FAMILY INCOME
$54,015
AVG HOUSEHOLD INCOME
0.28
INEQUALITY / GINI INDEX
774
TOTAL POPULATION
250
MALE POPULATION
524
FEMALE POPULATION
47.71
MALES / 100 FEMALES
209.60
FEMALES / 100 MALES
82.5
MEDIAN AGE
2.0
AVG FAMILY SIZE
1.4
AVG HOUSEHOLD SIZE
99
LABOR FORCE [ PEOPLE ]
12.8%
PERCENT IN LABOR FORCE
Income in Brookfield
Income Overview in Brookfield
Per Capita Income in Brookfield is $41,338, while median incomes of families and households are $91,229 and $54,015 respectively.
| Characteristic | Number | Measure |
| Per Capita Income | 774 | $41,338 |
| Median Family Income | 196 | $91,229 |
| Mean Family Income | 196 | $82,421 |
| Median Household Income | 562 | $54,015 |
| Mean Household Income | 562 | $57,013 |
| Income Deficit | 196 | $0 |
| Wage / Income Gap (%) | 774 | 0.00% |
| Wage / Income Gap ($) | 774 | 100.00¢ per $1 |
| Gini / Inequality Index | 774 | 0.28 |
Earnings by Sex in Brookfield
| Sex | Number | Average Earnings |
| Male | 40 (40.4%) | $0 |
| Female | 59 (59.6%) | $0 |
| Total | 99 (100.0%) | $0 |
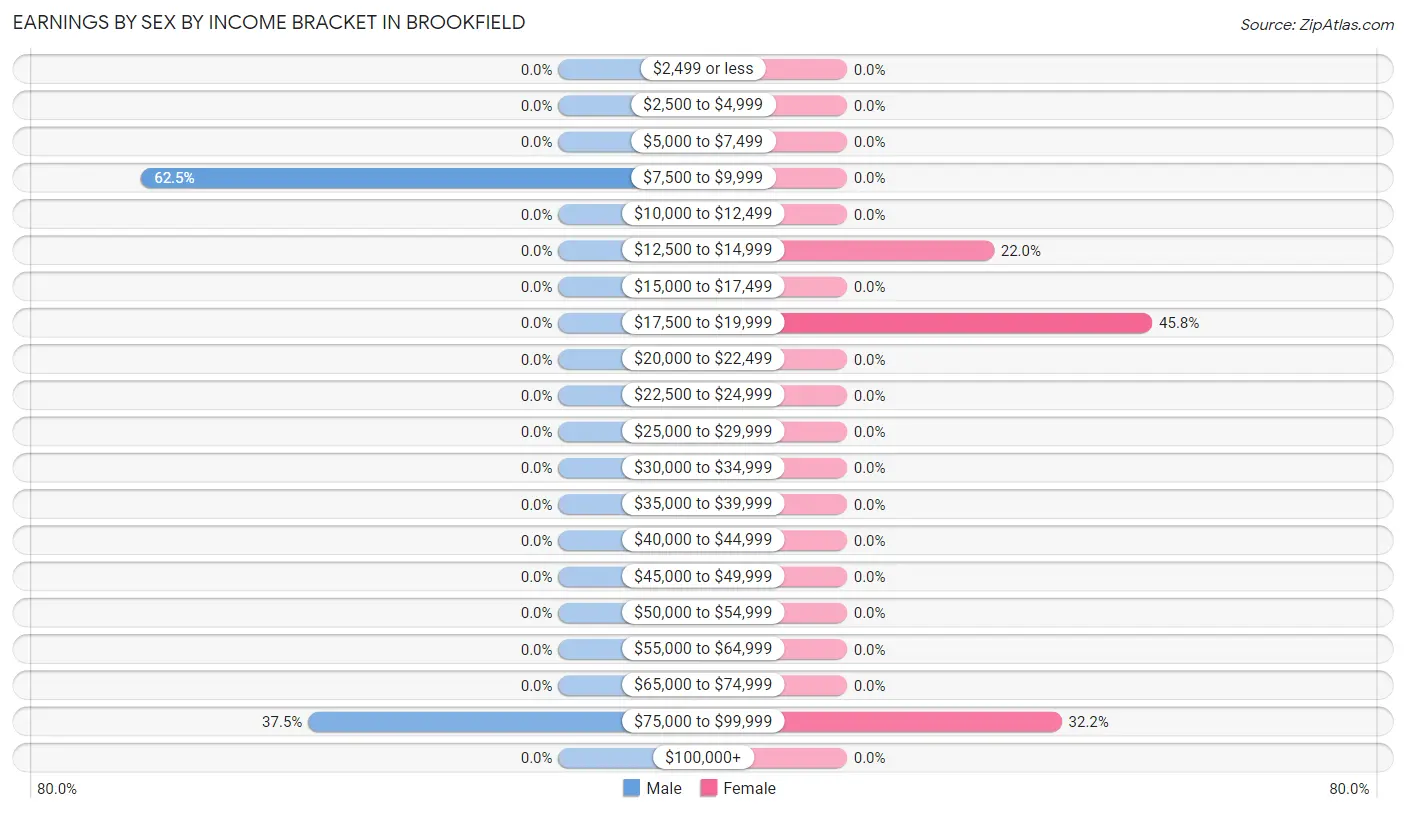
Earnings by Sex by Income Bracket in Brookfield
The most common earnings brackets in Brookfield are $7,500 to $9,999 for men (25 | 62.5%) and $17,500 to $19,999 for women (27 | 45.8%).
| Income | Male | Female |
| $2,499 or less | 0 (0.0%) | 0 (0.0%) |
| $2,500 to $4,999 | 0 (0.0%) | 0 (0.0%) |
| $5,000 to $7,499 | 0 (0.0%) | 0 (0.0%) |
| $7,500 to $9,999 | 25 (62.5%) | 0 (0.0%) |
| $10,000 to $12,499 | 0 (0.0%) | 0 (0.0%) |
| $12,500 to $14,999 | 0 (0.0%) | 13 (22.0%) |
| $15,000 to $17,499 | 0 (0.0%) | 0 (0.0%) |
| $17,500 to $19,999 | 0 (0.0%) | 27 (45.8%) |
| $20,000 to $22,499 | 0 (0.0%) | 0 (0.0%) |
| $22,500 to $24,999 | 0 (0.0%) | 0 (0.0%) |
| $25,000 to $29,999 | 0 (0.0%) | 0 (0.0%) |
| $30,000 to $34,999 | 0 (0.0%) | 0 (0.0%) |
| $35,000 to $39,999 | 0 (0.0%) | 0 (0.0%) |
| $40,000 to $44,999 | 0 (0.0%) | 0 (0.0%) |
| $45,000 to $49,999 | 0 (0.0%) | 0 (0.0%) |
| $50,000 to $54,999 | 0 (0.0%) | 0 (0.0%) |
| $55,000 to $64,999 | 0 (0.0%) | 0 (0.0%) |
| $65,000 to $74,999 | 0 (0.0%) | 0 (0.0%) |
| $75,000 to $99,999 | 15 (37.5%) | 19 (32.2%) |
| $100,000+ | 0 (0.0%) | 0 (0.0%) |
| Total | 40 (100.0%) | 59 (100.0%) |
Earnings by Sex by Educational Attainment in Brookfield
| Educational Attainment | Male Income | Female Income |
| Less than High School | - | - |
| High School Diploma | - | - |
| College or Associate's Degree | - | - |
| Bachelor's Degree | - | - |
| Graduate Degree | - | - |
| Total | - | - |
Family Income in Brookfield
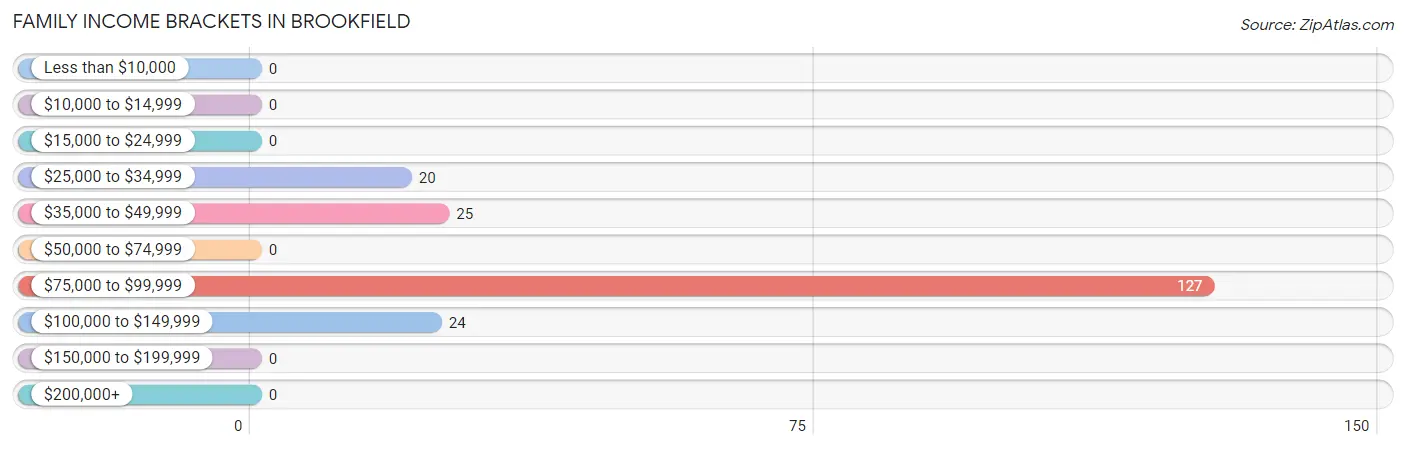
Family Income Brackets in Brookfield
According to the Brookfield family income data, there are 127 families falling into the $75,000 to $99,999 income range, which is the most common income bracket and makes up 64.8% of all families.
| Income Bracket | # Families | % Families |
| Less than $10,000 | 0 | 0.0% |
| $10,000 to $14,999 | 0 | 0.0% |
| $15,000 to $24,999 | 0 | 0.0% |
| $25,000 to $34,999 | 20 | 10.2% |
| $35,000 to $49,999 | 25 | 12.8% |
| $50,000 to $74,999 | 0 | 0.0% |
| $75,000 to $99,999 | 127 | 64.8% |
| $100,000 to $149,999 | 24 | 12.2% |
| $150,000 to $199,999 | 0 | 0.0% |
| $200,000+ | 0 | 0.0% |
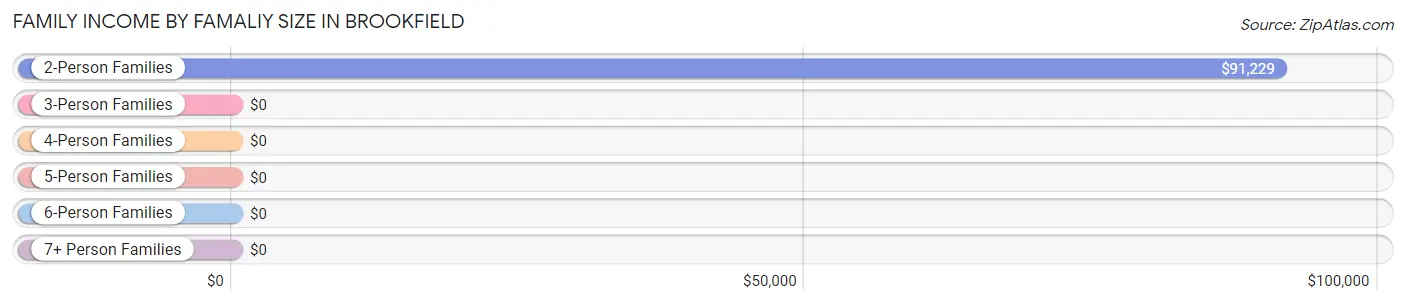
Family Income by Famaliy Size in Brookfield
2-person families (196 | 100.0%) account for the highest median family income in Brookfield with $91,229 per family, while 2-person families (196 | 100.0%) have the highest median income of $45,614 per family member.
| Income Bracket | # Families | Median Income |
| 2-Person Families | 196 (100.0%) | $91,229 |
| 3-Person Families | 0 (0.0%) | $0 |
| 4-Person Families | 0 (0.0%) | $0 |
| 5-Person Families | 0 (0.0%) | $0 |
| 6-Person Families | 0 (0.0%) | $0 |
| 7+ Person Families | 0 (0.0%) | $0 |
| Total | 196 (100.0%) | $91,229 |
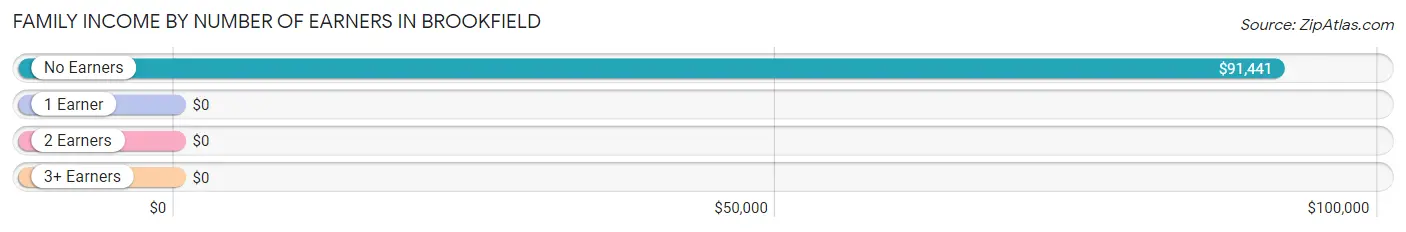
Family Income by Number of Earners in Brookfield
| Number of Earners | # Families | Median Income |
| No Earners | 156 (79.6%) | $91,441 |
| 1 Earner | 0 (0.0%) | $0 |
| 2 Earners | 40 (20.4%) | $0 |
| 3+ Earners | 0 (0.0%) | $0 |
| Total | 196 (100.0%) | $91,229 |
Household Income in Brookfield
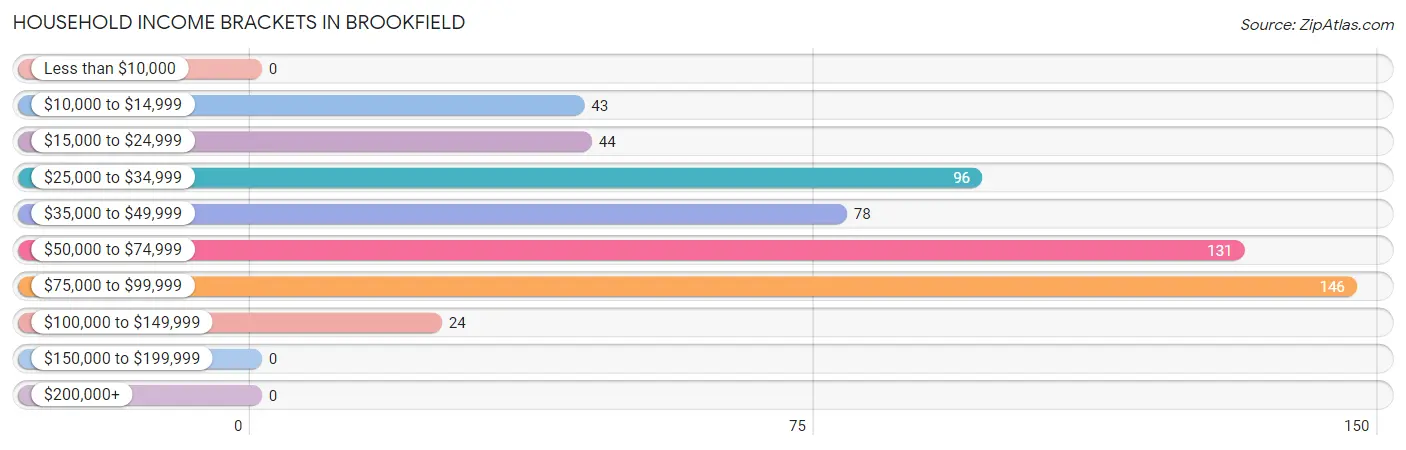
Household Income Brackets in Brookfield
With 146 households falling in the category, the $75,000 to $99,999 income range is the most frequent in Brookfield, accounting for 26.0% of all households.
| Income Bracket | # Households | % Households |
| Less than $10,000 | 0 | 0.0% |
| $10,000 to $14,999 | 43 | 7.7% |
| $15,000 to $24,999 | 44 | 7.8% |
| $25,000 to $34,999 | 96 | 17.1% |
| $35,000 to $49,999 | 78 | 13.9% |
| $50,000 to $74,999 | 131 | 23.3% |
| $75,000 to $99,999 | 146 | 26.0% |
| $100,000 to $149,999 | 24 | 4.3% |
| $150,000 to $199,999 | 0 | 0.0% |
| $200,000+ | 0 | 0.0% |
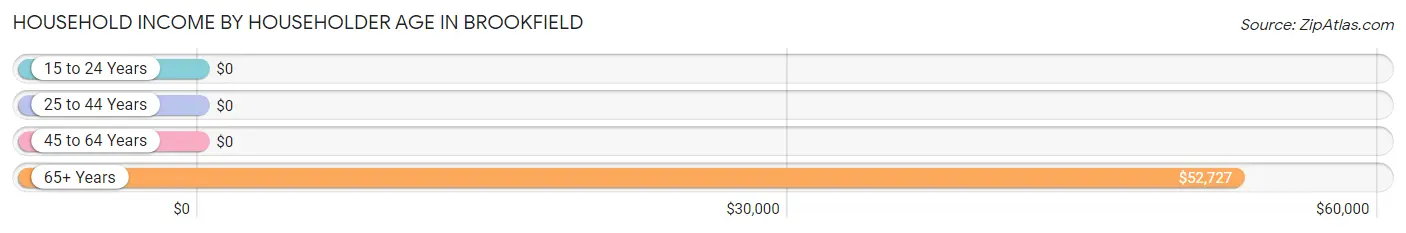
Household Income by Householder Age in Brookfield
The median household income in Brookfield is $54,015, with the highest median household income of $52,727 found in the 65+ years age bracket for the primary householder. A total of 528 households (94.0%) fall into this category.
| Income Bracket | # Households | Median Income |
| 15 to 24 Years | 0 (0.0%) | $0 |
| 25 to 44 Years | 0 (0.0%) | $0 |
| 45 to 64 Years | 34 (6.0%) | $0 |
| 65+ Years | 528 (94.0%) | $52,727 |
| Total | 562 (100.0%) | $54,015 |
Poverty in Brookfield
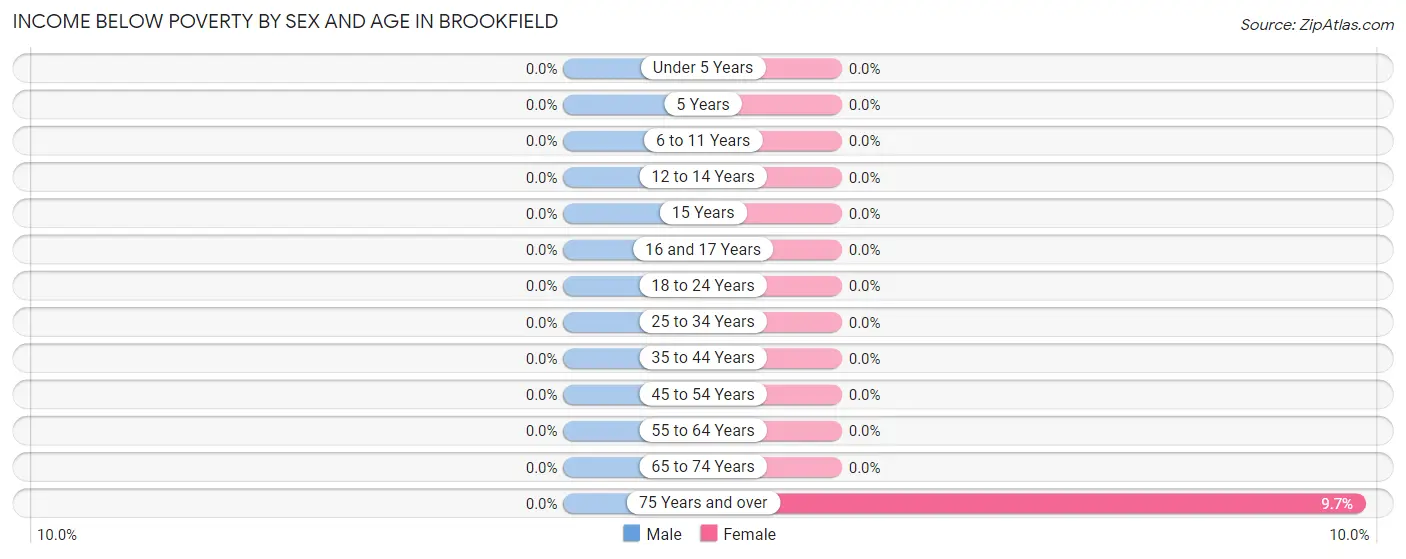
Income Below Poverty by Sex and Age in Brookfield
| Age Bracket | Male | Female |
| Under 5 Years | 0 (0.0%) | 0 (0.0%) |
| 5 Years | 0 (0.0%) | 0 (0.0%) |
| 6 to 11 Years | 0 (0.0%) | 0 (0.0%) |
| 12 to 14 Years | 0 (0.0%) | 0 (0.0%) |
| 15 Years | 0 (0.0%) | 0 (0.0%) |
| 16 and 17 Years | 0 (0.0%) | 0 (0.0%) |
| 18 to 24 Years | 0 (0.0%) | 0 (0.0%) |
| 25 to 34 Years | 0 (0.0%) | 0 (0.0%) |
| 35 to 44 Years | 0 (0.0%) | 0 (0.0%) |
| 45 to 54 Years | 0 (0.0%) | 0 (0.0%) |
| 55 to 64 Years | 0 (0.0%) | 0 (0.0%) |
| 65 to 74 Years | 0 (0.0%) | 0 (0.0%) |
| 75 Years and over | 0 (0.0%) | 43 (9.7%) |
| Total | 0 (0.0%) | 43 (8.2%) |
Income Above Poverty by Sex and Age in Brookfield
According to the poverty statistics in Brookfield, males aged 55 to 64 years and females aged 55 to 64 years are the age groups that are most secure financially, with 100.0% of males and 100.0% of females in these age groups living above the poverty line.

| Age Bracket | Male | Female |
| Under 5 Years | 0 (0.0%) | 0 (0.0%) |
| 5 Years | 0 (0.0%) | 0 (0.0%) |
| 6 to 11 Years | 0 (0.0%) | 0 (0.0%) |
| 12 to 14 Years | 0 (0.0%) | 0 (0.0%) |
| 15 Years | 0 (0.0%) | 0 (0.0%) |
| 16 and 17 Years | 0 (0.0%) | 0 (0.0%) |
| 18 to 24 Years | 0 (0.0%) | 0 (0.0%) |
| 25 to 34 Years | 0 (0.0%) | 0 (0.0%) |
| 35 to 44 Years | 0 (0.0%) | 0 (0.0%) |
| 45 to 54 Years | 0 (0.0%) | 0 (0.0%) |
| 55 to 64 Years | 15 (100.0%) | 59 (100.0%) |
| 65 to 74 Years | 45 (100.0%) | 22 (100.0%) |
| 75 Years and over | 190 (100.0%) | 400 (90.3%) |
| Total | 250 (100.0%) | 481 (91.8%) |
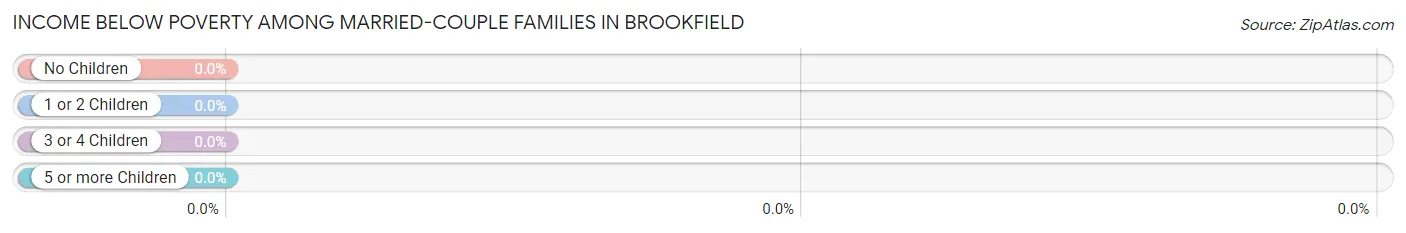
Income Below Poverty Among Married-Couple Families in Brookfield
| Children | Above Poverty | Below Poverty |
| No Children | 196 (100.0%) | 0 (0.0%) |
| 1 or 2 Children | 0 (0.0%) | 0 (0.0%) |
| 3 or 4 Children | 0 (0.0%) | 0 (0.0%) |
| 5 or more Children | 0 (0.0%) | 0 (0.0%) |
| Total | 196 (100.0%) | 0 (0.0%) |
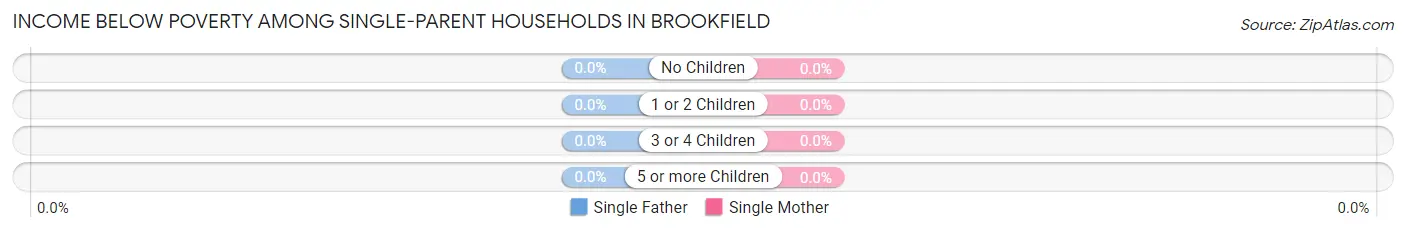
Income Below Poverty Among Single-Parent Households in Brookfield
| Children | Single Father | Single Mother |
| No Children | 0 (0.0%) | 0 (0.0%) |
| 1 or 2 Children | 0 (0.0%) | 0 (0.0%) |
| 3 or 4 Children | 0 (0.0%) | 0 (0.0%) |
| 5 or more Children | 0 (0.0%) | 0 (0.0%) |
| Total | 0 (0.0%) | 0 (0.0%) |
Income Below Poverty Among Married-Couple vs Single-Parent Households in Brookfield
| Children | Married-Couple Families | Single-Parent Households |
| No Children | 0 (0.0%) | 0 (0.0%) |
| 1 or 2 Children | 0 (0.0%) | 0 (0.0%) |
| 3 or 4 Children | 0 (0.0%) | 0 (0.0%) |
| 5 or more Children | 0 (0.0%) | 0 (0.0%) |
| Total | 0 (0.0%) | 0 (0.0%) |
Race in Brookfield
The most populous races in Brookfield are , and White / Caucasian (774 | 100.0%).
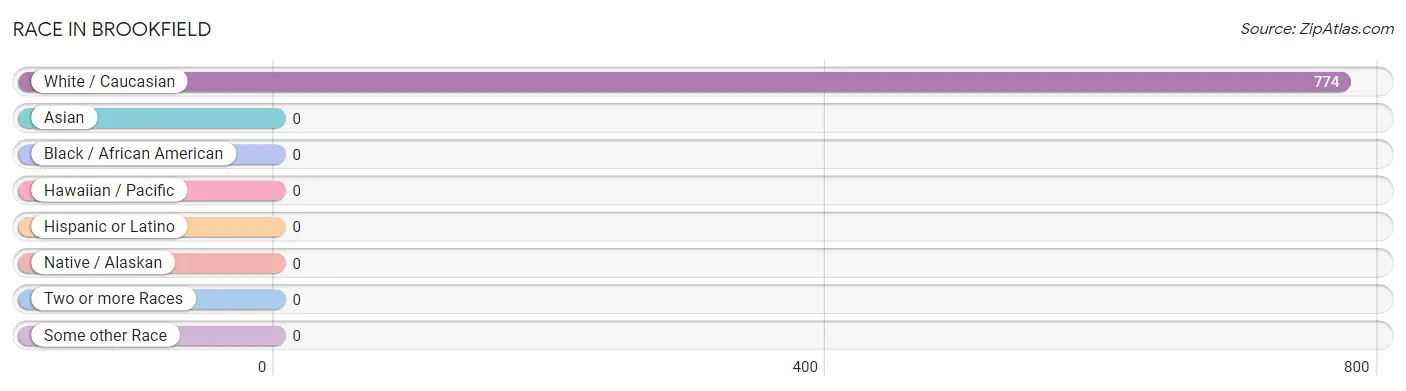
| Race | # Population | % Population |
| Asian | 0 | 0.0% |
| Black / African American | 0 | 0.0% |
| Hawaiian / Pacific | 0 | 0.0% |
| Hispanic or Latino | 0 | 0.0% |
| Native / Alaskan | 0 | 0.0% |
| White / Caucasian | 774 | 100.0% |
| Two or more Races | 0 | 0.0% |
| Some other Race | 0 | 0.0% |
| Total | 774 | 100.0% |
Ancestry in Brookfield
The most populous ancestries reported in Brookfield are German (306 | 39.5%), Irish (161 | 20.8%), English (120 | 15.5%), Dutch (106 | 13.7%), and Italian (104 | 13.4%), together accounting for 103.0% of all Brookfield residents.
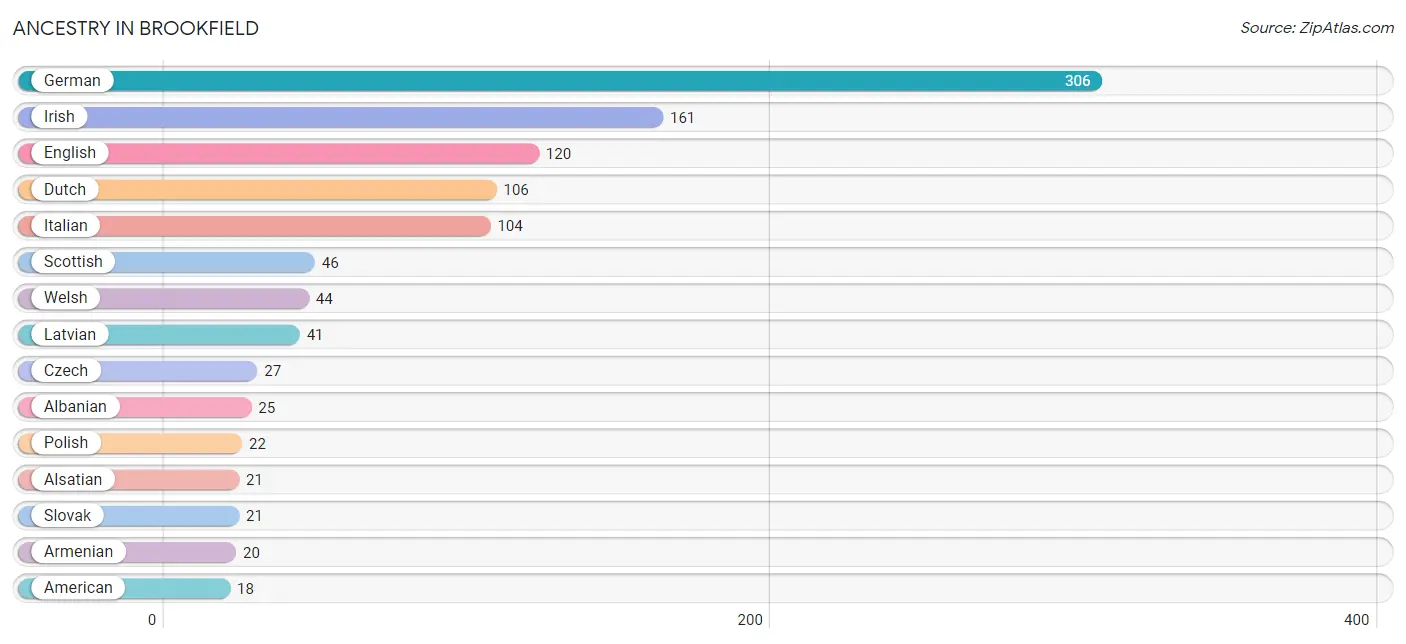
| Ancestry | # Population | % Population |
| Albanian | 25 | 3.2% |
| Alsatian | 21 | 2.7% |
| American | 18 | 2.3% |
| Armenian | 20 | 2.6% |
| Czech | 27 | 3.5% |
| Czechoslovakian | 17 | 2.2% |
| Danish | 18 | 2.3% |
| Dutch | 106 | 13.7% |
| English | 120 | 15.5% |
| French | 15 | 1.9% |
| German | 306 | 39.5% |
| Irish | 161 | 20.8% |
| Italian | 104 | 13.4% |
| Latvian | 41 | 5.3% |
| Polish | 22 | 2.8% |
| Scottish | 46 | 5.9% |
| Slovak | 21 | 2.7% |
| Welsh | 44 | 5.7% | View All 18 Rows |
Immigrants in Brookfield

| Immigration Origin | # Population | % Population | View All 0 Rows |
Sex and Age in Brookfield
Sex and Age in Brookfield
The most populous age groups in Brookfield are 80 to 84 Years (131 | 52.4%) for men and 80 to 84 Years (193 | 36.8%) for women.
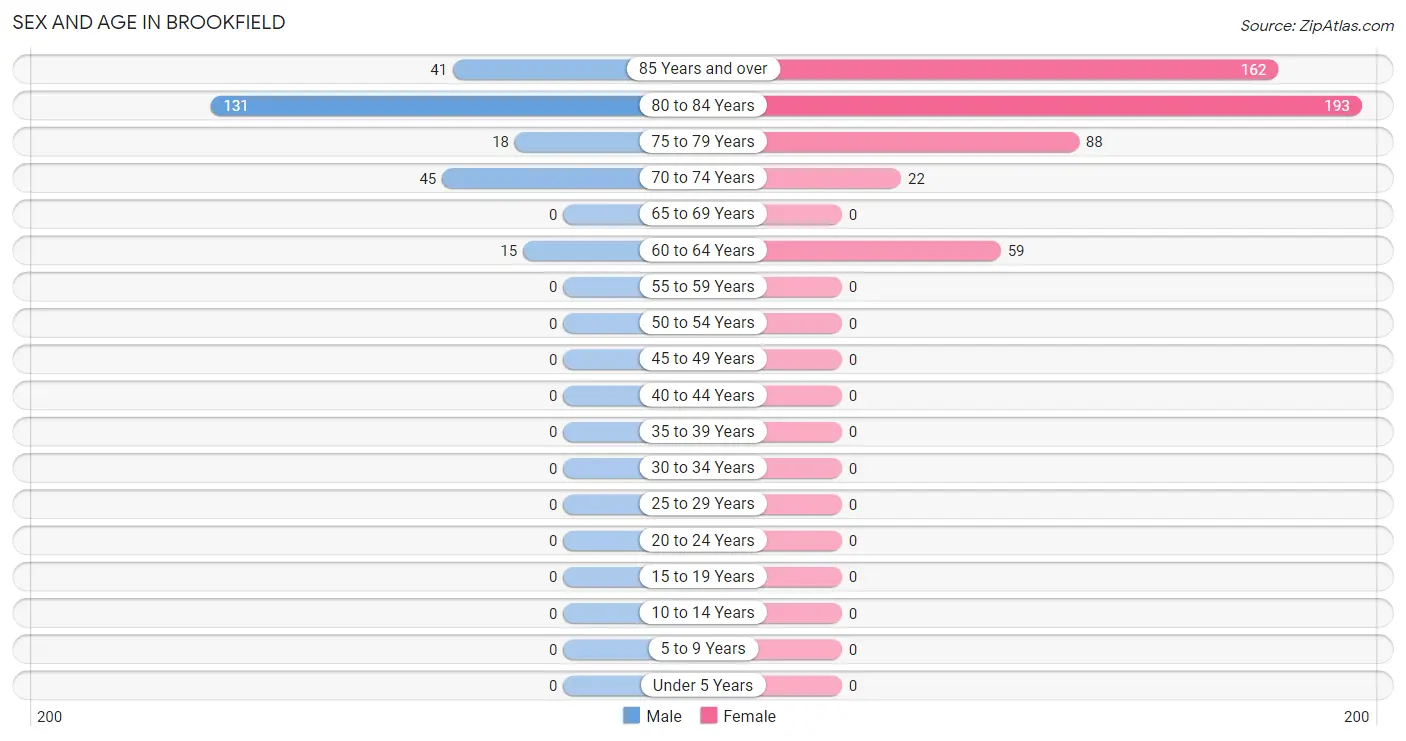
| Age Bracket | Male | Female |
| Under 5 Years | 0 (0.0%) | 0 (0.0%) |
| 5 to 9 Years | 0 (0.0%) | 0 (0.0%) |
| 10 to 14 Years | 0 (0.0%) | 0 (0.0%) |
| 15 to 19 Years | 0 (0.0%) | 0 (0.0%) |
| 20 to 24 Years | 0 (0.0%) | 0 (0.0%) |
| 25 to 29 Years | 0 (0.0%) | 0 (0.0%) |
| 30 to 34 Years | 0 (0.0%) | 0 (0.0%) |
| 35 to 39 Years | 0 (0.0%) | 0 (0.0%) |
| 40 to 44 Years | 0 (0.0%) | 0 (0.0%) |
| 45 to 49 Years | 0 (0.0%) | 0 (0.0%) |
| 50 to 54 Years | 0 (0.0%) | 0 (0.0%) |
| 55 to 59 Years | 0 (0.0%) | 0 (0.0%) |
| 60 to 64 Years | 15 (6.0%) | 59 (11.3%) |
| 65 to 69 Years | 0 (0.0%) | 0 (0.0%) |
| 70 to 74 Years | 45 (18.0%) | 22 (4.2%) |
| 75 to 79 Years | 18 (7.2%) | 88 (16.8%) |
| 80 to 84 Years | 131 (52.4%) | 193 (36.8%) |
| 85 Years and over | 41 (16.4%) | 162 (30.9%) |
| Total | 250 (100.0%) | 524 (100.0%) |
Families and Households in Brookfield
Median Family Size in Brookfield
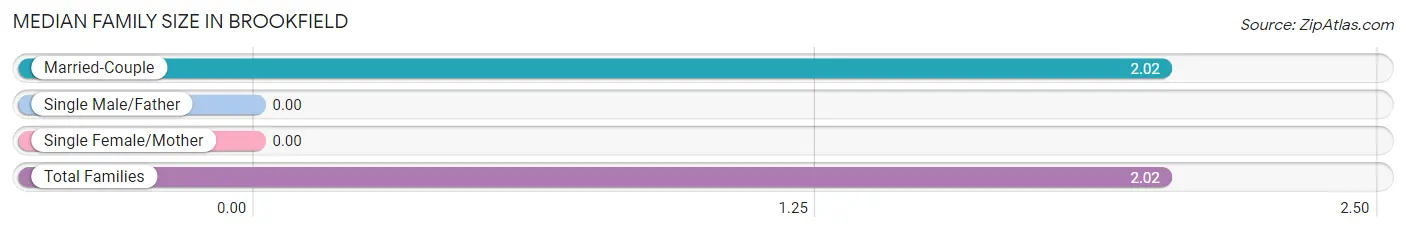
| Family Type | # Families | Family Size |
| Married-Couple | 196 (100.0%) | 2.02 |
| Single Male/Father | 0 (0.0%) | - |
| Single Female/Mother | 0 (0.0%) | - |
| Total Families | 196 (100.0%) | 2.02 |
Median Household Size in Brookfield
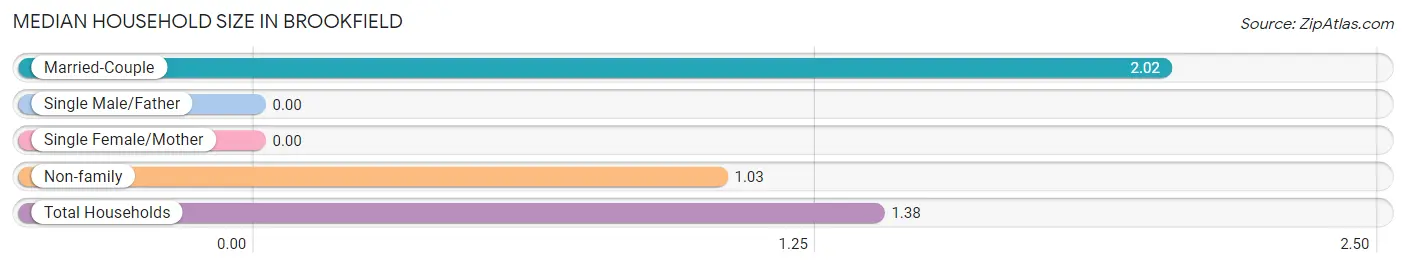
| Household Type | # Households | Household Size |
| Married-Couple | 196 (34.9%) | 2.02 |
| Single Male/Father | 0 (0.0%) | - |
| Single Female/Mother | 0 (0.0%) | - |
| Non-family | 366 (65.1%) | 1.03 |
| Total Households | 562 (100.0%) | 1.38 |
Household Size by Marriage Status in Brookfield
Out of a total of 562 households in Brookfield, 196 (34.9%) are family households, while 366 (65.1%) are nonfamily households. The most numerous type of family households are 2-person households, comprising 196, and the most common type of nonfamily households are 1-person households, comprising 345.
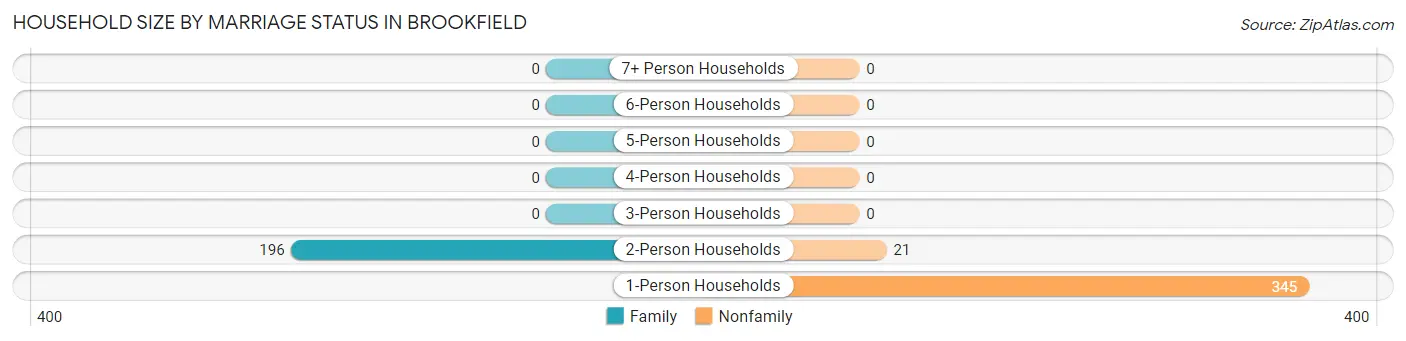
| Household Size | Family Households | Nonfamily Households |
| 1-Person Households | - | 345 (61.4%) |
| 2-Person Households | 196 (34.9%) | 21 (3.7%) |
| 3-Person Households | 0 (0.0%) | 0 (0.0%) |
| 4-Person Households | 0 (0.0%) | 0 (0.0%) |
| 5-Person Households | 0 (0.0%) | 0 (0.0%) |
| 6-Person Households | 0 (0.0%) | 0 (0.0%) |
| 7+ Person Households | 0 (0.0%) | 0 (0.0%) |
| Total | 196 (34.9%) | 366 (65.1%) |
Female Fertility in Brookfield
Fertility by Age in Brookfield
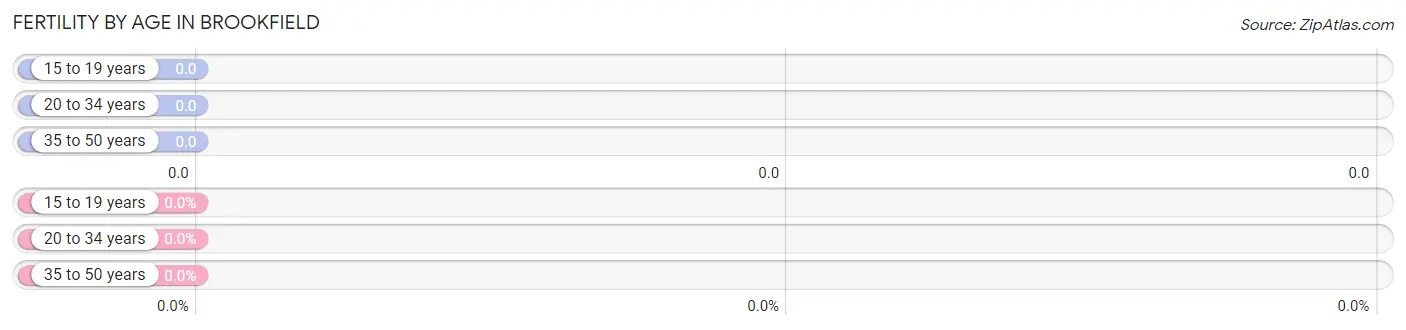
| Age Bracket | Women with Births | Births / 1,000 Women |
| 15 to 19 years | 0 (0.0%) | 0.0 |
| 20 to 34 years | 0 (0.0%) | 0.0 |
| 35 to 50 years | 0 (0.0%) | 0.0 |
| Total | 0 (0.0%) | 0.0 |
Fertility by Age by Marriage Status in Brookfield
| Age Bracket | Married | Unmarried |
| 15 to 19 years | 0 (0.0%) | 0 (0.0%) |
| 20 to 34 years | 0 (0.0%) | 0 (0.0%) |
| 35 to 50 years | 0 (0.0%) | 0 (0.0%) |
| Total | 0 (0.0%) | 0 (0.0%) |
Fertility by Education in Brookfield
| Educational Attainment | Women with Births | Births / 1,000 Women |
| Less than High School | 0 (0.0%) | 0.0 |
| High School Diploma | 0 (0.0%) | 0.0 |
| College or Associate's Degree | 0 (0.0%) | 0.0 |
| Bachelor's Degree | 0 (0.0%) | 0.0 |
| Graduate Degree | 0 (0.0%) | 0.0 |
| Total | 0 (0.0%) | 0.0 |
Fertility by Education by Marriage Status in Brookfield
| Educational Attainment | Married | Unmarried |
| Less than High School | 0 (0.0%) | 0 (0.0%) |
| High School Diploma | 0 (0.0%) | 0 (0.0%) |
| College or Associate's Degree | 0 (0.0%) | 0 (0.0%) |
| Bachelor's Degree | 0 (0.0%) | 0 (0.0%) |
| Graduate Degree | 0 (0.0%) | 0 (0.0%) |
| Total | 0 (0.0%) | 0 (0.0%) |
Employment Characteristics in Brookfield
Employment by Class of Employer in Brookfield
Among the 99 employed individuals in Brookfield, private company employees (74 | 74.8%), and not-for-profit organizations (25 | 25.3%) make up the most common classes of employment.
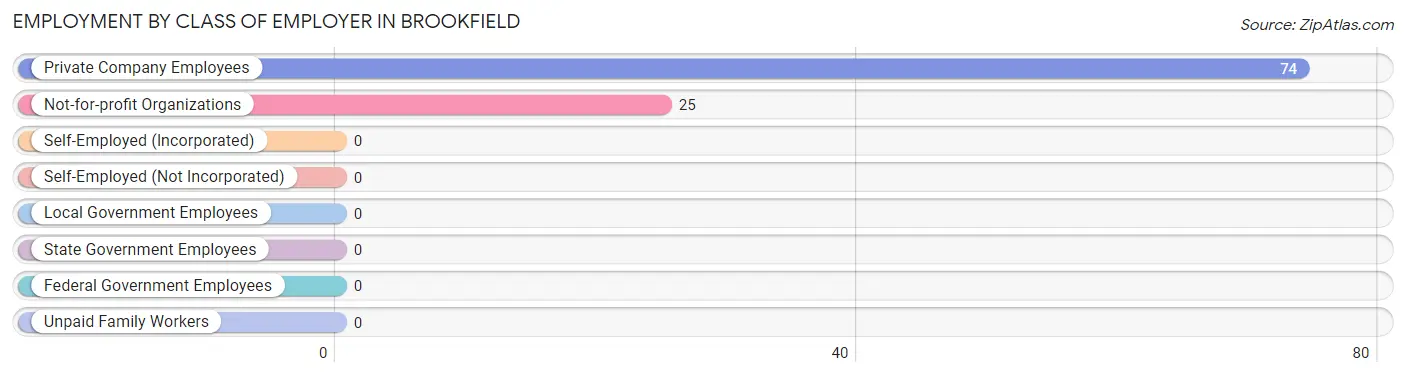
| Employer Class | # Employees | % Employees |
| Private Company Employees | 74 | 74.8% |
| Self-Employed (Incorporated) | 0 | 0.0% |
| Self-Employed (Not Incorporated) | 0 | 0.0% |
| Not-for-profit Organizations | 25 | 25.3% |
| Local Government Employees | 0 | 0.0% |
| State Government Employees | 0 | 0.0% |
| Federal Government Employees | 0 | 0.0% |
| Unpaid Family Workers | 0 | 0.0% |
| Total | 99 | 100.0% |
Employment Status by Age in Brookfield
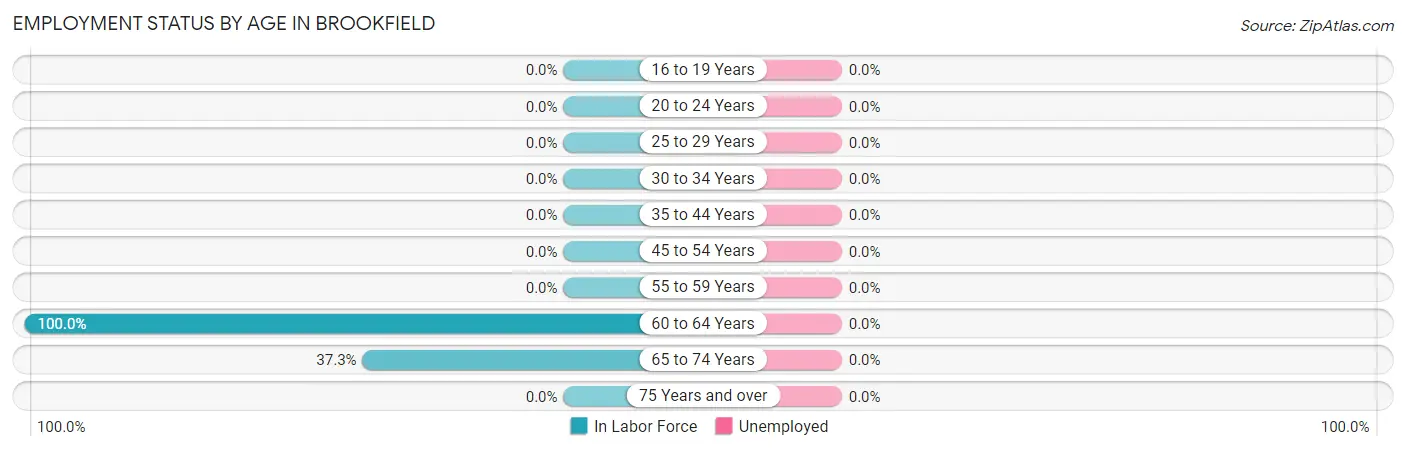
| Age Bracket | In Labor Force | Unemployed |
| 16 to 19 Years | 0 (0.0%) | 0 (0.0%) |
| 20 to 24 Years | 0 (0.0%) | 0 (0.0%) |
| 25 to 29 Years | 0 (0.0%) | 0 (0.0%) |
| 30 to 34 Years | 0 (0.0%) | 0 (0.0%) |
| 35 to 44 Years | 0 (0.0%) | 0 (0.0%) |
| 45 to 54 Years | 0 (0.0%) | 0 (0.0%) |
| 55 to 59 Years | 0 (0.0%) | 0 (0.0%) |
| 60 to 64 Years | 74 (100.0%) | 0 (0.0%) |
| 65 to 74 Years | 25 (37.3%) | 0 (0.0%) |
| 75 Years and over | 0 (0.0%) | 0 (0.0%) |
| Total | 99 (12.8%) | 0 (0.0%) |
Employment Status by Educational Attainment in Brookfield
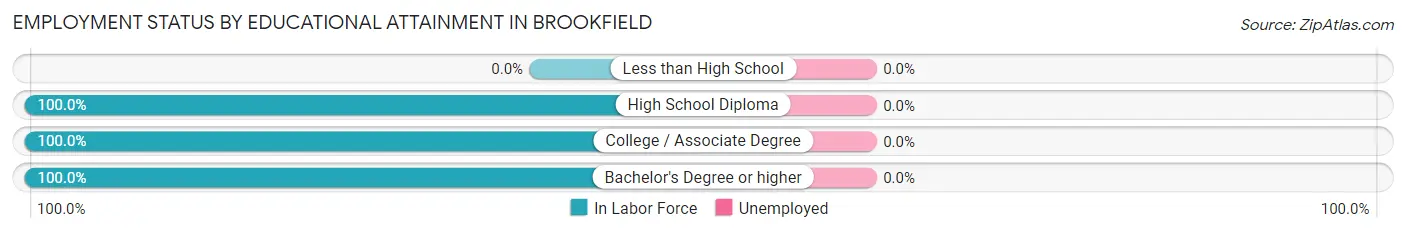
| Educational Attainment | In Labor Force | Unemployed |
| Less than High School | 0 (0.0%) | 0 (0.0%) |
| High School Diploma | 46 (100.0%) | 0 (0.0%) |
| College / Associate Degree | 13 (100.0%) | 0 (0.0%) |
| Bachelor's Degree or higher | 15 (100.0%) | 0 (0.0%) |
| Total | 74 (100.0%) | 0 (0.0%) |
Employment Occupations by Sex in Brookfield
Management, Business, Science and Arts Occupations
The most common Management, Business, Science and Arts occupations in Brookfield are , and Management (15 | 15.1%).
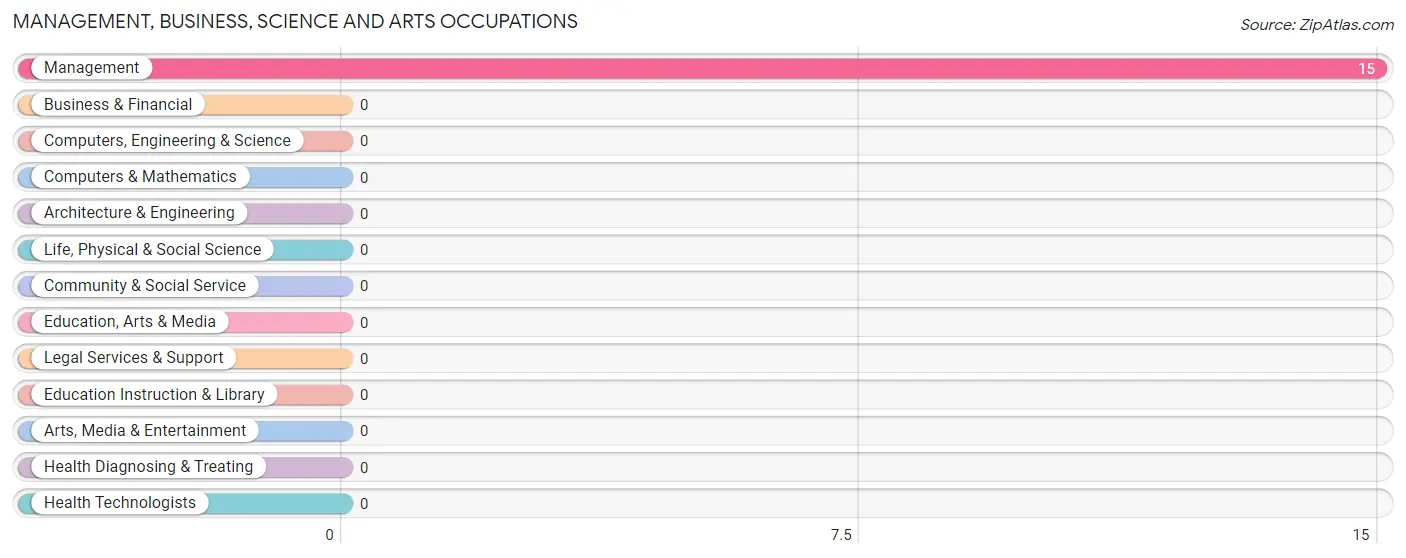
Management, Business, Science and Arts Occupations by Sex
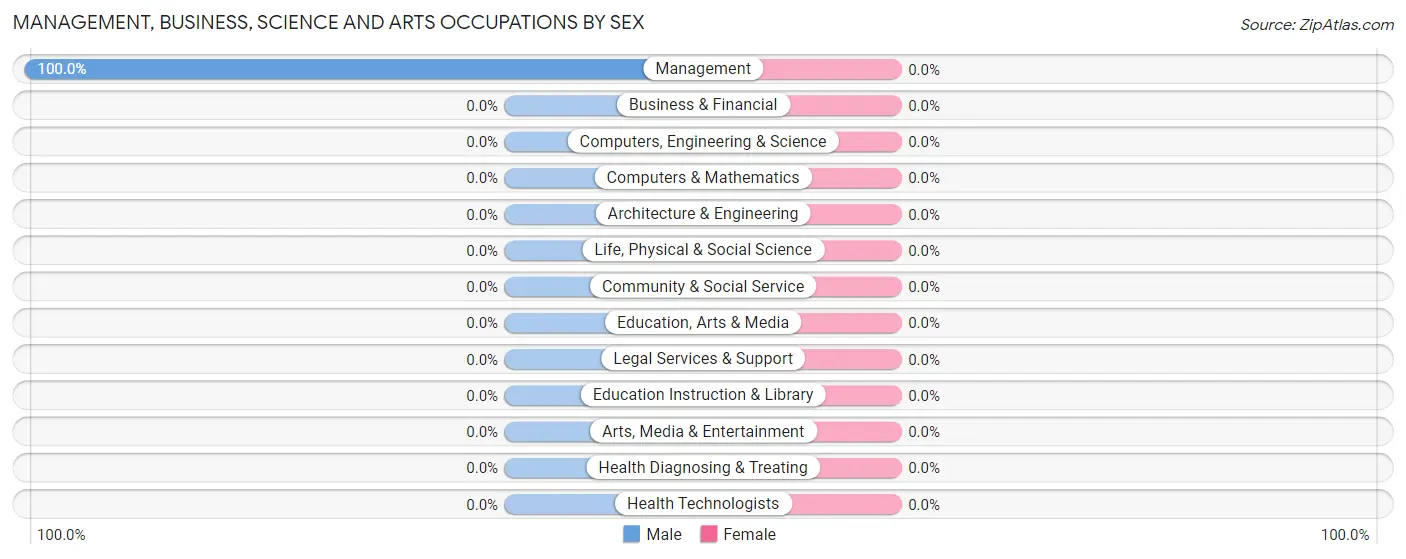
| Occupation | Male | Female |
| Management | 15 (100.0%) | 0 (0.0%) |
| Business & Financial | 0 (0.0%) | 0 (0.0%) |
| Computers, Engineering & Science | 0 (0.0%) | 0 (0.0%) |
| Computers & Mathematics | 0 (0.0%) | 0 (0.0%) |
| Architecture & Engineering | 0 (0.0%) | 0 (0.0%) |
| Life, Physical & Social Science | 0 (0.0%) | 0 (0.0%) |
| Community & Social Service | 0 (0.0%) | 0 (0.0%) |
| Education, Arts & Media | 0 (0.0%) | 0 (0.0%) |
| Legal Services & Support | 0 (0.0%) | 0 (0.0%) |
| Education Instruction & Library | 0 (0.0%) | 0 (0.0%) |
| Arts, Media & Entertainment | 0 (0.0%) | 0 (0.0%) |
| Health Diagnosing & Treating | 0 (0.0%) | 0 (0.0%) |
| Health Technologists | 0 (0.0%) | 0 (0.0%) |
| Total (Category) | 15 (100.0%) | 0 (0.0%) |
| Total (Overall) | 40 (40.4%) | 59 (59.6%) |
Services Occupations
The most common Services occupations in Brookfield are , and Personal Care & Service (40 | 40.4%).
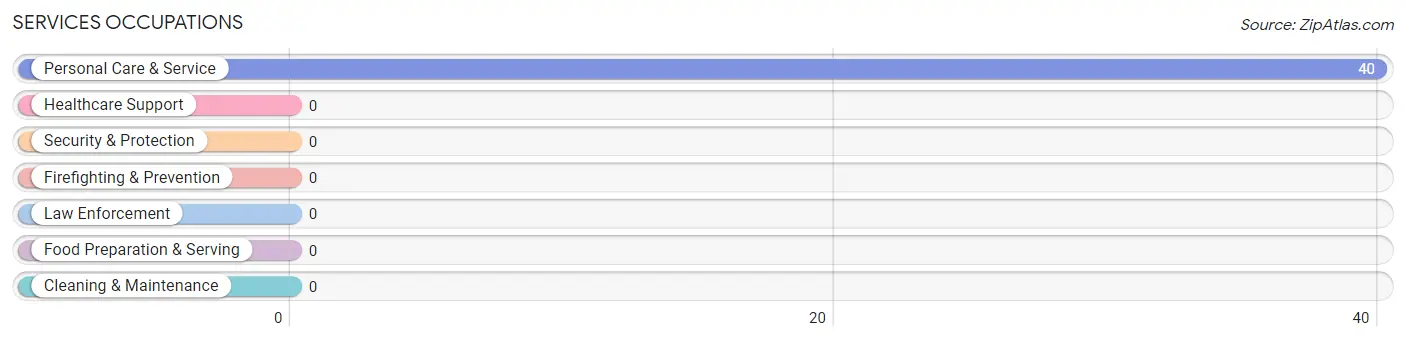
Services Occupations by Sex
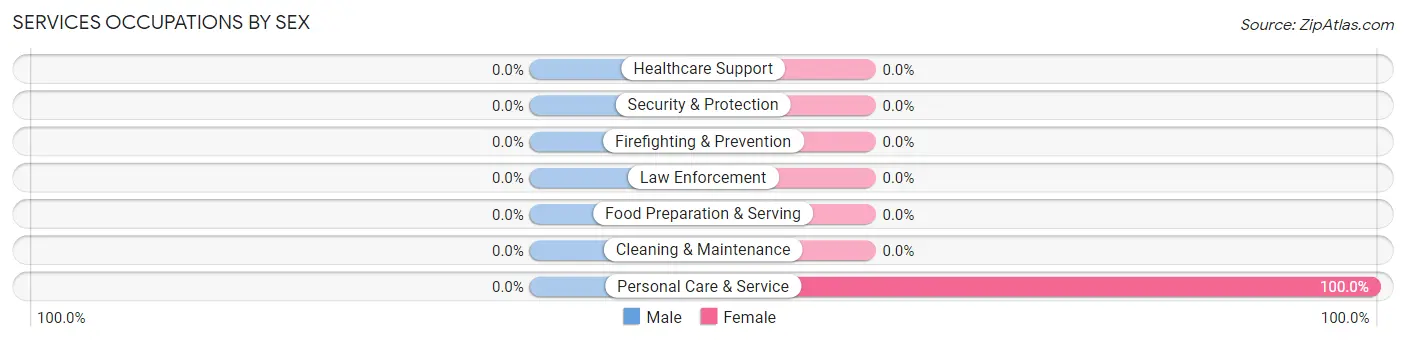
| Occupation | Male | Female |
| Healthcare Support | 0 (0.0%) | 0 (0.0%) |
| Security & Protection | 0 (0.0%) | 0 (0.0%) |
| Firefighting & Prevention | 0 (0.0%) | 0 (0.0%) |
| Law Enforcement | 0 (0.0%) | 0 (0.0%) |
| Food Preparation & Serving | 0 (0.0%) | 0 (0.0%) |
| Cleaning & Maintenance | 0 (0.0%) | 0 (0.0%) |
| Personal Care & Service | 0 (0.0%) | 40 (100.0%) |
| Total (Category) | 0 (0.0%) | 40 (100.0%) |
| Total (Overall) | 40 (40.4%) | 59 (59.6%) |
Sales and Office Occupations
The most common Sales and Office occupations in Brookfield are , and Office & Administration (19 | 19.2%).
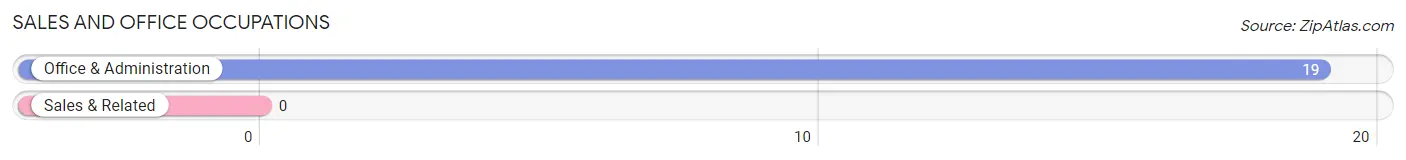
Sales and Office Occupations by Sex
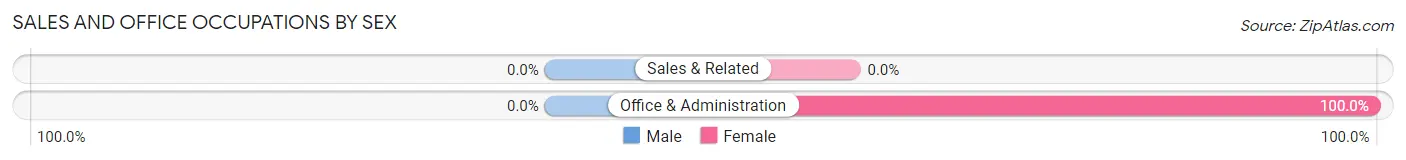
| Occupation | Male | Female |
| Sales & Related | 0 (0.0%) | 0 (0.0%) |
| Office & Administration | 0 (0.0%) | 19 (100.0%) |
| Total (Category) | 0 (0.0%) | 19 (100.0%) |
| Total (Overall) | 40 (40.4%) | 59 (59.6%) |
Natural Resources, Construction and Maintenance Occupations
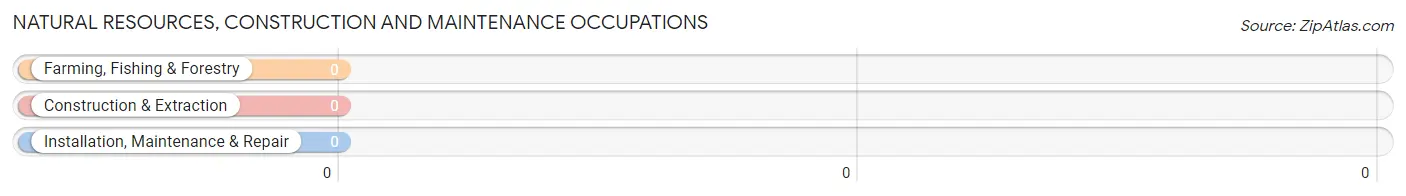
Natural Resources, Construction and Maintenance Occupations by Sex
| Occupation | Male | Female |
| Farming, Fishing & Forestry | 0 (0.0%) | 0 (0.0%) |
| Construction & Extraction | 0 (0.0%) | 0 (0.0%) |
| Installation, Maintenance & Repair | 0 (0.0%) | 0 (0.0%) |
| Total (Category) | 0 (0.0%) | 0 (0.0%) |
| Total (Overall) | 40 (40.4%) | 59 (59.6%) |
Production, Transportation and Moving Occupations
The most common Production, Transportation and Moving occupations in Brookfield are , and Transportation (25 | 25.3%).
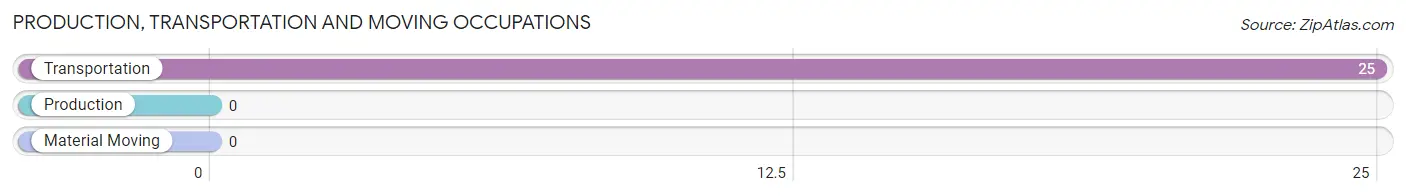
Production, Transportation and Moving Occupations by Sex
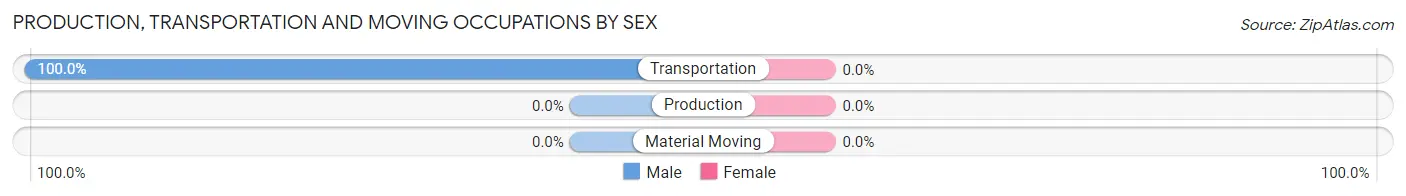
| Occupation | Male | Female |
| Production | 0 (0.0%) | 0 (0.0%) |
| Transportation | 25 (100.0%) | 0 (0.0%) |
| Material Moving | 0 (0.0%) | 0 (0.0%) |
| Total (Category) | 25 (100.0%) | 0 (0.0%) |
| Total (Overall) | 40 (40.4%) | 59 (59.6%) |
Employment Industries by Sex in Brookfield
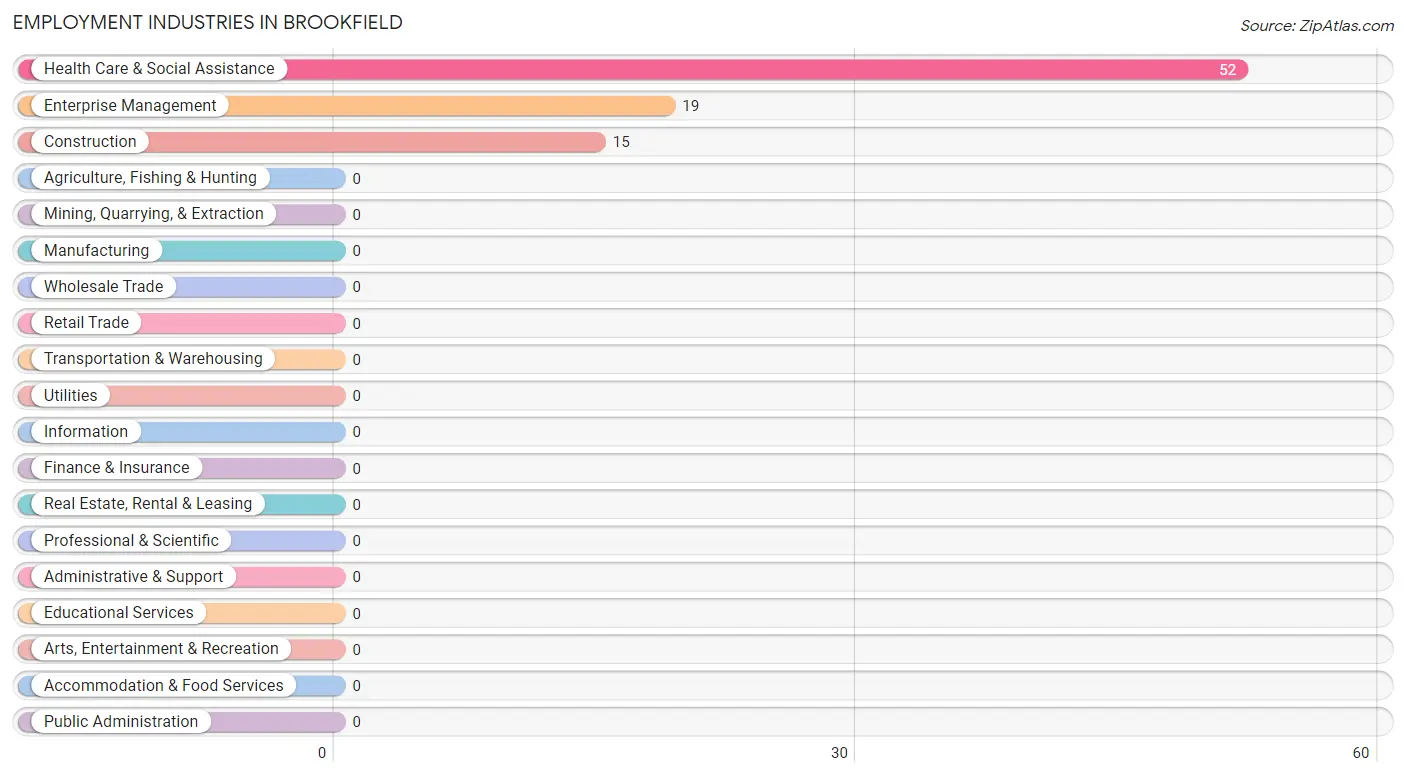
Employment Industries in Brookfield
The major employment industries in Brookfield include Health Care & Social Assistance (52 | 52.5%), Enterprise Management (19 | 19.2%), and Construction (15 | 15.1%).
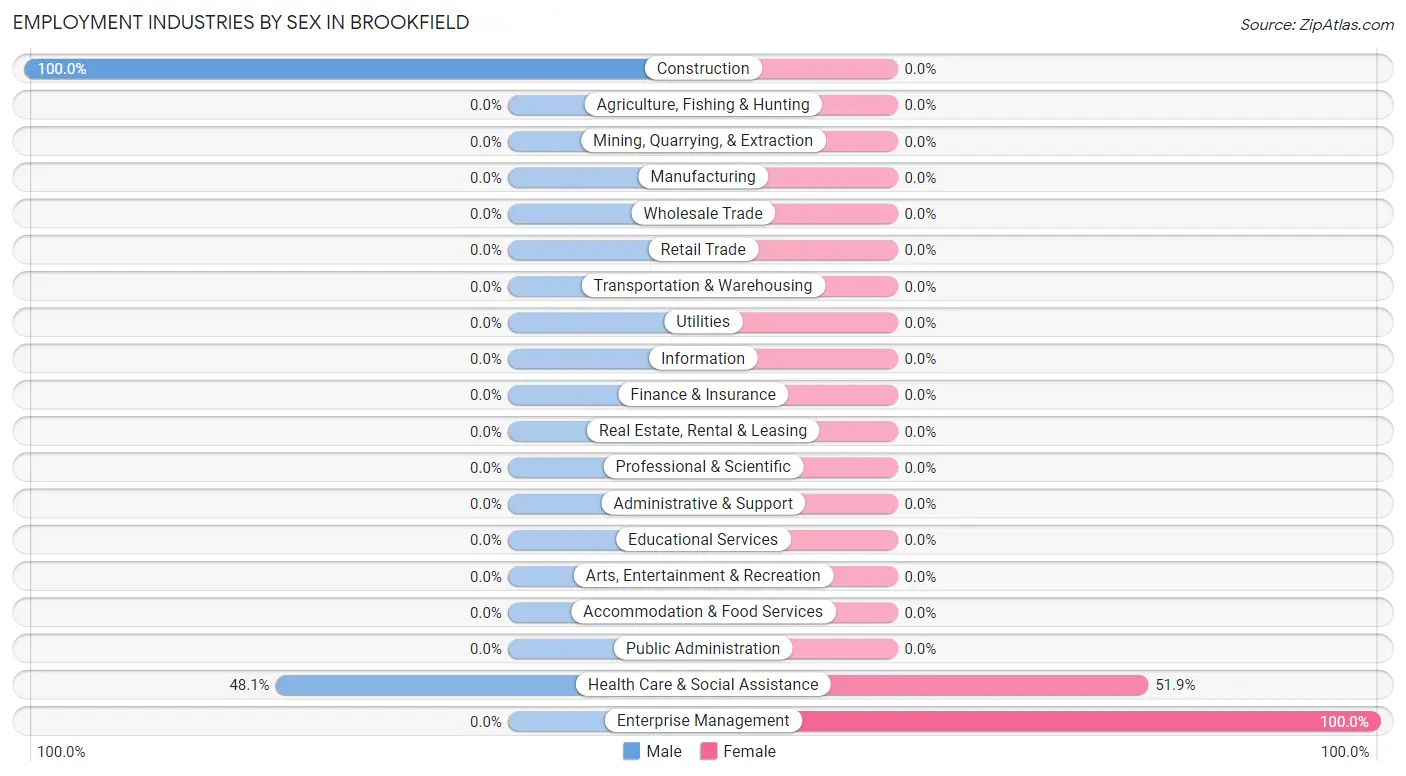
Employment Industries by Sex in Brookfield
The Brookfield industries that see more men than women are Construction (100.0%), and Health Care & Social Assistance (48.1%), whereas the industries that tend to have a higher number of women are Enterprise Management (100.0%), and Health Care & Social Assistance (51.9%).
| Industry | Male | Female |
| Agriculture, Fishing & Hunting | 0 (0.0%) | 0 (0.0%) |
| Mining, Quarrying, & Extraction | 0 (0.0%) | 0 (0.0%) |
| Construction | 15 (100.0%) | 0 (0.0%) |
| Manufacturing | 0 (0.0%) | 0 (0.0%) |
| Wholesale Trade | 0 (0.0%) | 0 (0.0%) |
| Retail Trade | 0 (0.0%) | 0 (0.0%) |
| Transportation & Warehousing | 0 (0.0%) | 0 (0.0%) |
| Utilities | 0 (0.0%) | 0 (0.0%) |
| Information | 0 (0.0%) | 0 (0.0%) |
| Finance & Insurance | 0 (0.0%) | 0 (0.0%) |
| Real Estate, Rental & Leasing | 0 (0.0%) | 0 (0.0%) |
| Professional & Scientific | 0 (0.0%) | 0 (0.0%) |
| Enterprise Management | 0 (0.0%) | 19 (100.0%) |
| Administrative & Support | 0 (0.0%) | 0 (0.0%) |
| Educational Services | 0 (0.0%) | 0 (0.0%) |
| Health Care & Social Assistance | 25 (48.1%) | 27 (51.9%) |
| Arts, Entertainment & Recreation | 0 (0.0%) | 0 (0.0%) |
| Accommodation & Food Services | 0 (0.0%) | 0 (0.0%) |
| Public Administration | 0 (0.0%) | 0 (0.0%) |
| Total | 40 (40.4%) | 59 (59.6%) |
Education in Brookfield
School Enrollment in Brookfield
| School Level | # Students | % Students |
| Nursery / Preschool | 0 | 0.0% |
| Kindergarten | 0 | 0.0% |
| Elementary School | 0 | 0.0% |
| Middle School | 0 | 0.0% |
| High School | 0 | 0.0% |
| College / Undergraduate | 0 | 0.0% |
| Graduate / Professional | 0 | 0.0% |
| Total | 0 | 0.0% |
School Enrollment by Age by Funding Source in Brookfield
| Age Bracket | Public School | Private School |
| 3 to 4 Year Olds | 0 (0.0%) | 0 (0.0%) |
| 5 to 9 Year Old | 0 (0.0%) | 0 (0.0%) |
| 10 to 14 Year Olds | 0 (0.0%) | 0 (0.0%) |
| 15 to 17 Year Olds | 0 (0.0%) | 0 (0.0%) |
| 18 to 19 Year Olds | 0 (0.0%) | 0 (0.0%) |
| 20 to 24 Year Olds | 0 (0.0%) | 0 (0.0%) |
| 25 to 34 Year Olds | 0 (0.0%) | 0 (0.0%) |
| 35 Years and over | 0 (0.0%) | 0 (0.0%) |
| Total | 0 (0.0%) | 0 (0.0%) |
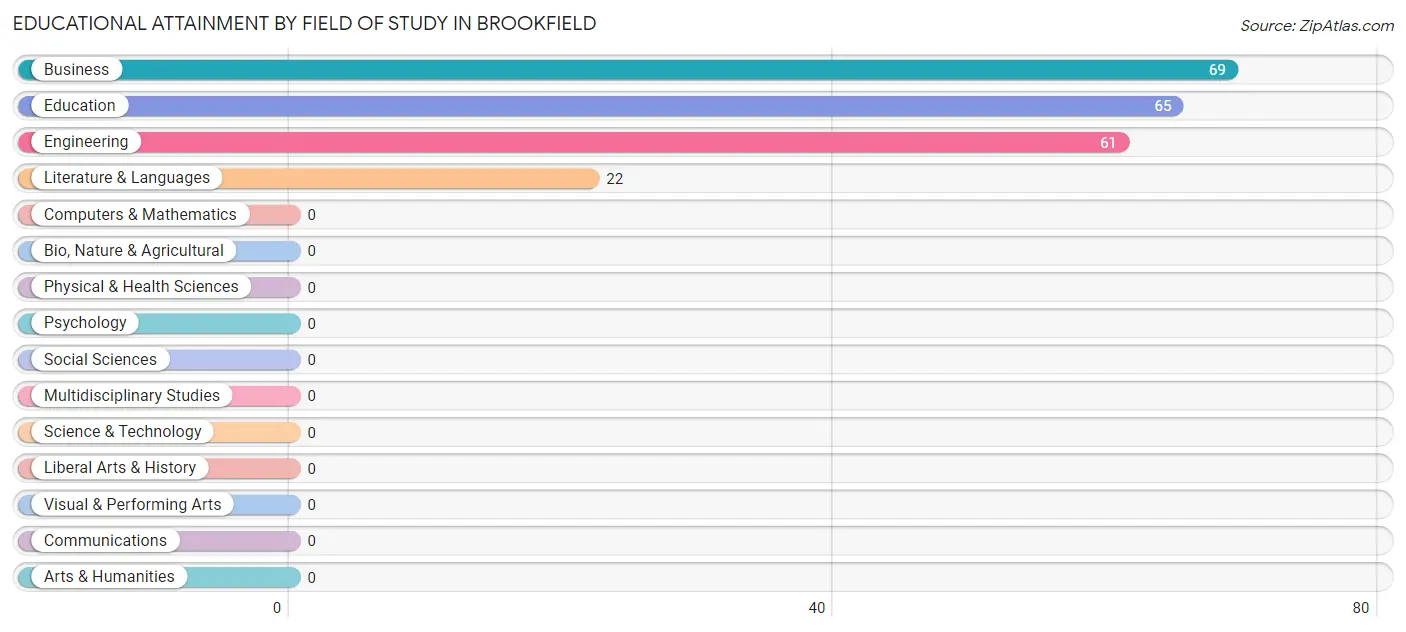
Educational Attainment by Field of Study in Brookfield
Business (69 | 31.8%), education (65 | 29.9%), engineering (61 | 28.1%), and literature & languages (22 | 10.1%) are the most common fields of study among 217 individuals in Brookfield who have obtained a bachelor's degree or higher.
| Field of Study | # Graduates | % Graduates |
| Computers & Mathematics | 0 | 0.0% |
| Bio, Nature & Agricultural | 0 | 0.0% |
| Physical & Health Sciences | 0 | 0.0% |
| Psychology | 0 | 0.0% |
| Social Sciences | 0 | 0.0% |
| Engineering | 61 | 28.1% |
| Multidisciplinary Studies | 0 | 0.0% |
| Science & Technology | 0 | 0.0% |
| Business | 69 | 31.8% |
| Education | 65 | 29.9% |
| Literature & Languages | 22 | 10.1% |
| Liberal Arts & History | 0 | 0.0% |
| Visual & Performing Arts | 0 | 0.0% |
| Communications | 0 | 0.0% |
| Arts & Humanities | 0 | 0.0% |
| Total | 217 | 100.0% |
Transportation & Commute in Brookfield
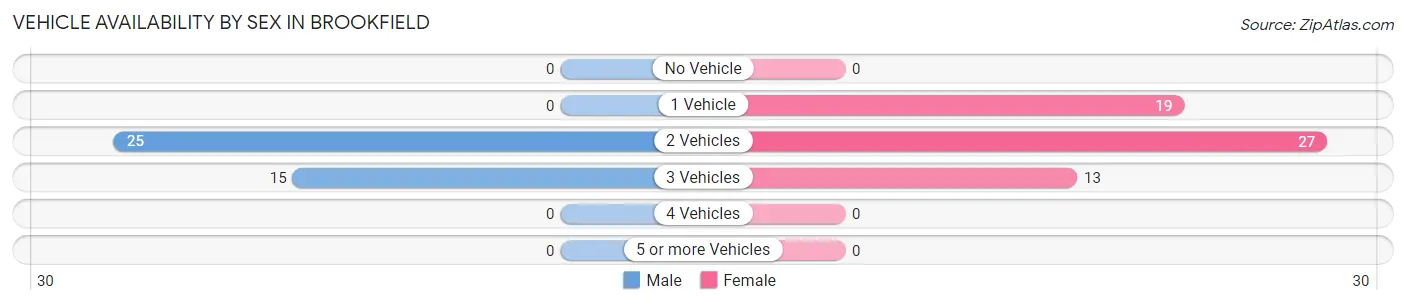
Vehicle Availability by Sex in Brookfield
The most prevalent vehicle ownership categories in Brookfield are males with 2 vehicles (25, accounting for 62.5%) and females with 2 vehicles (27, making up 42.4%).
| Vehicles Available | Male | Female |
| No Vehicle | 0 (0.0%) | 0 (0.0%) |
| 1 Vehicle | 0 (0.0%) | 19 (32.2%) |
| 2 Vehicles | 25 (62.5%) | 27 (45.8%) |
| 3 Vehicles | 15 (37.5%) | 13 (22.0%) |
| 4 Vehicles | 0 (0.0%) | 0 (0.0%) |
| 5 or more Vehicles | 0 (0.0%) | 0 (0.0%) |
| Total | 40 (100.0%) | 59 (100.0%) |
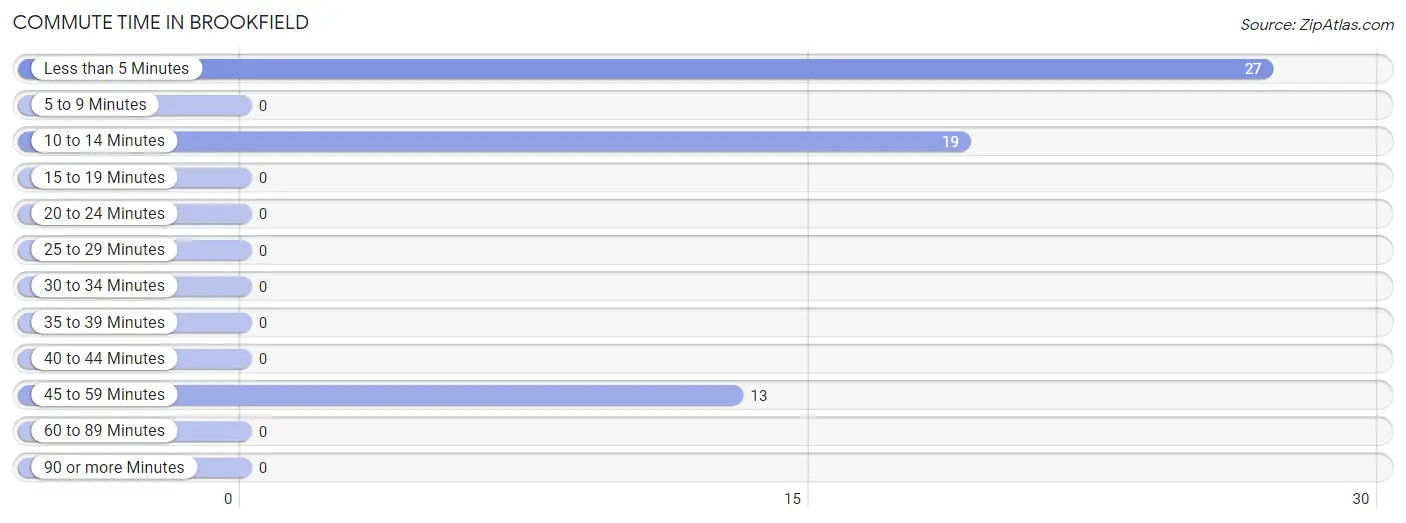
Commute Time in Brookfield
The most frequently occuring commute durations in Brookfield are less than 5 minutes (27 commuters, 45.8%), 10 to 14 minutes (19 commuters, 32.2%), and 45 to 59 minutes (13 commuters, 22.0%).
| Commute Time | # Commuters | % Commuters |
| Less than 5 Minutes | 27 | 45.8% |
| 5 to 9 Minutes | 0 | 0.0% |
| 10 to 14 Minutes | 19 | 32.2% |
| 15 to 19 Minutes | 0 | 0.0% |
| 20 to 24 Minutes | 0 | 0.0% |
| 25 to 29 Minutes | 0 | 0.0% |
| 30 to 34 Minutes | 0 | 0.0% |
| 35 to 39 Minutes | 0 | 0.0% |
| 40 to 44 Minutes | 0 | 0.0% |
| 45 to 59 Minutes | 13 | 22.0% |
| 60 to 89 Minutes | 0 | 0.0% |
| 90 or more Minutes | 0 | 0.0% |
Commute Time by Sex in Brookfield
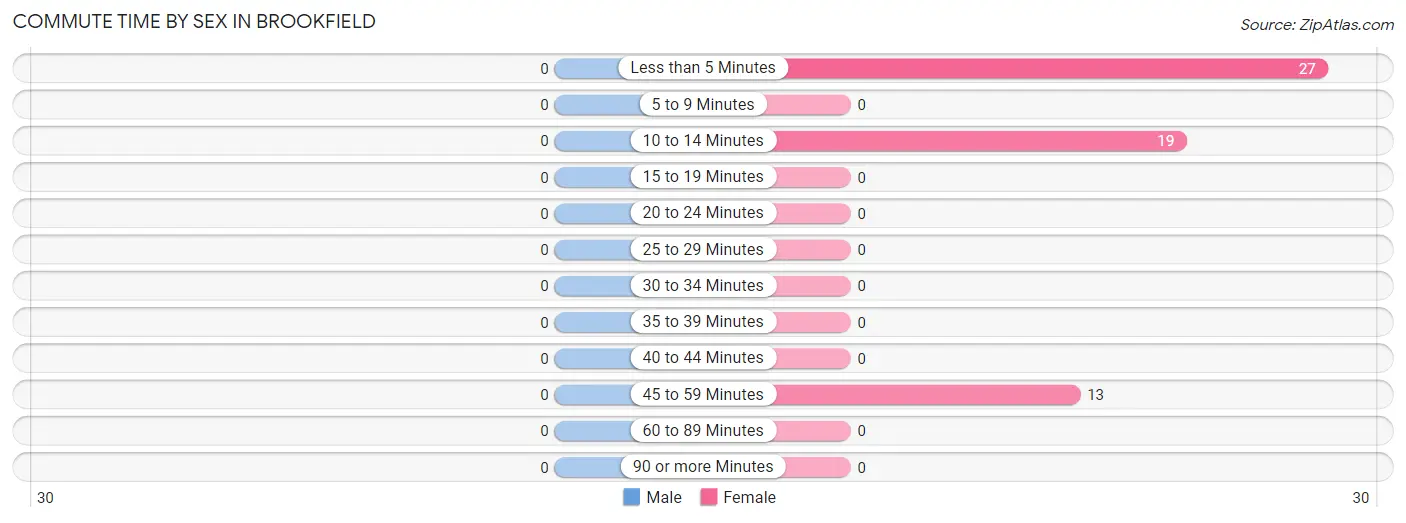
| Commute Time | Male | Female |
| Less than 5 Minutes | 0 (0.0%) | 27 (45.8%) |
| 5 to 9 Minutes | 0 (0.0%) | 0 (0.0%) |
| 10 to 14 Minutes | 0 (0.0%) | 19 (32.2%) |
| 15 to 19 Minutes | 0 (0.0%) | 0 (0.0%) |
| 20 to 24 Minutes | 0 (0.0%) | 0 (0.0%) |
| 25 to 29 Minutes | 0 (0.0%) | 0 (0.0%) |
| 30 to 34 Minutes | 0 (0.0%) | 0 (0.0%) |
| 35 to 39 Minutes | 0 (0.0%) | 0 (0.0%) |
| 40 to 44 Minutes | 0 (0.0%) | 0 (0.0%) |
| 45 to 59 Minutes | 0 (0.0%) | 13 (22.0%) |
| 60 to 89 Minutes | 0 (0.0%) | 0 (0.0%) |
| 90 or more Minutes | 0 (0.0%) | 0 (0.0%) |
Time of Departure to Work by Sex in Brookfield
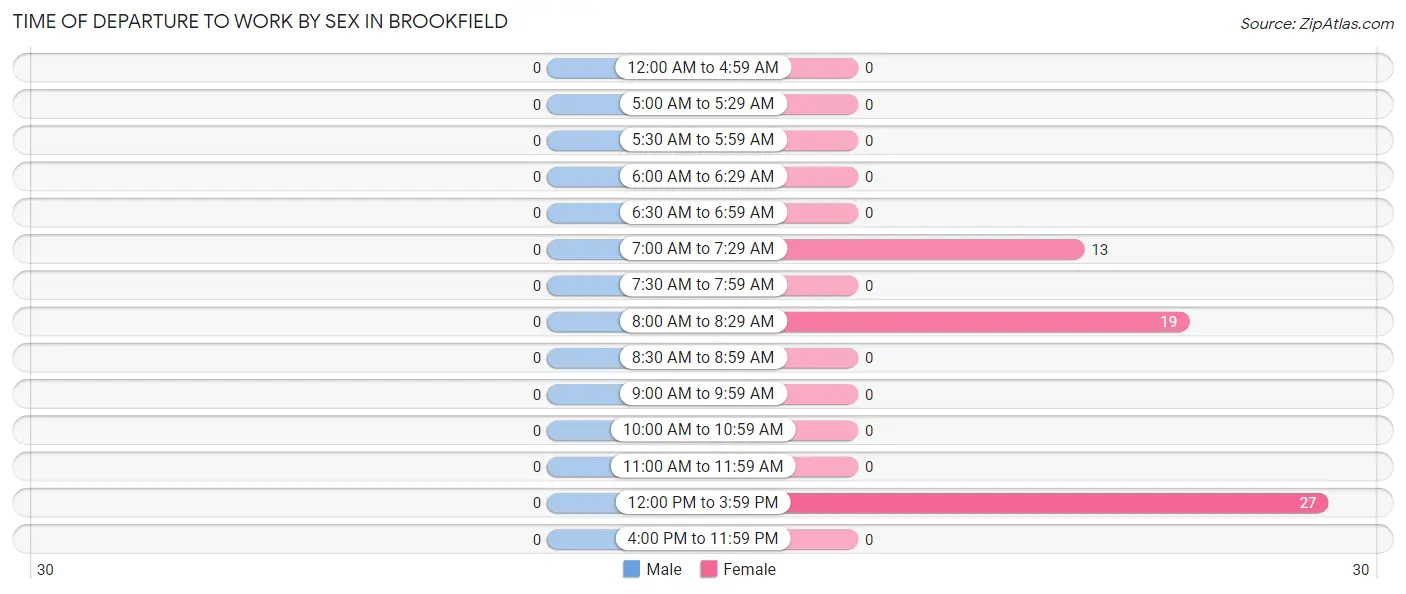
| Time of Departure | Male | Female |
| 12:00 AM to 4:59 AM | 0 (0.0%) | 0 (0.0%) |
| 5:00 AM to 5:29 AM | 0 (0.0%) | 0 (0.0%) |
| 5:30 AM to 5:59 AM | 0 (0.0%) | 0 (0.0%) |
| 6:00 AM to 6:29 AM | 0 (0.0%) | 0 (0.0%) |
| 6:30 AM to 6:59 AM | 0 (0.0%) | 0 (0.0%) |
| 7:00 AM to 7:29 AM | 0 (0.0%) | 13 (22.0%) |
| 7:30 AM to 7:59 AM | 0 (0.0%) | 0 (0.0%) |
| 8:00 AM to 8:29 AM | 0 (0.0%) | 19 (32.2%) |
| 8:30 AM to 8:59 AM | 0 (0.0%) | 0 (0.0%) |
| 9:00 AM to 9:59 AM | 0 (0.0%) | 0 (0.0%) |
| 10:00 AM to 10:59 AM | 0 (0.0%) | 0 (0.0%) |
| 11:00 AM to 11:59 AM | 0 (0.0%) | 0 (0.0%) |
| 12:00 PM to 3:59 PM | 0 (0.0%) | 27 (45.8%) |
| 4:00 PM to 11:59 PM | 0 (0.0%) | 0 (0.0%) |
| Total | 0 (0.0%) | 59 (100.0%) |
Housing Occupancy in Brookfield
Occupancy by Ownership in Brookfield
Of the total 562 dwellings in Brookfield, owner-occupied units account for 400 (71.2%), while renter-occupied units make up 162 (28.8%).
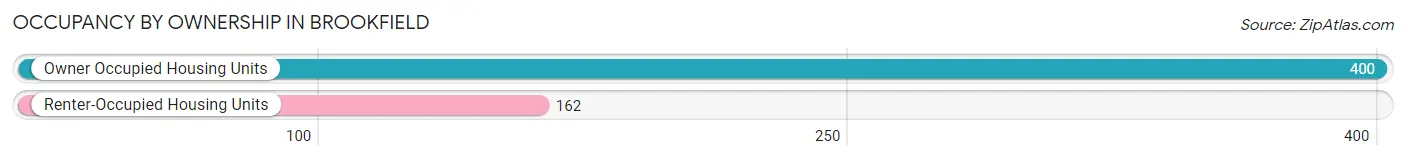
| Occupancy | # Housing Units | % Housing Units |
| Owner Occupied Housing Units | 400 | 71.2% |
| Renter-Occupied Housing Units | 162 | 28.8% |
| Total Occupied Housing Units | 562 | 100.0% |
Occupancy by Household Size in Brookfield
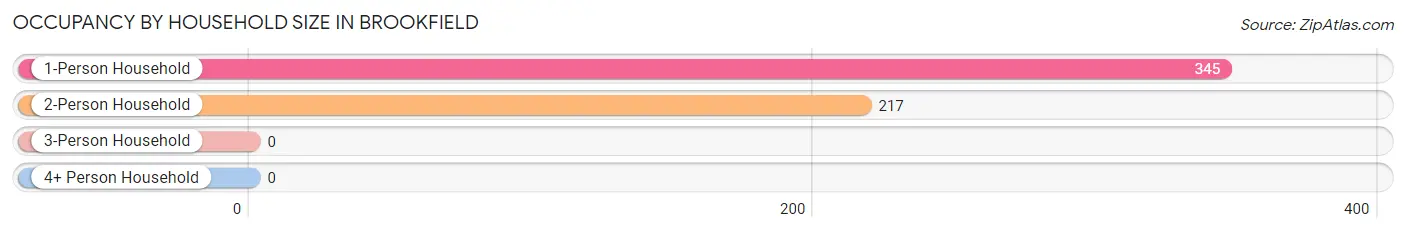
| Household Size | # Housing Units | % Housing Units |
| 1-Person Household | 345 | 61.4% |
| 2-Person Household | 217 | 38.6% |
| 3-Person Household | 0 | 0.0% |
| 4+ Person Household | 0 | 0.0% |
| Total Housing Units | 562 | 100.0% |
Occupancy by Ownership by Household Size in Brookfield
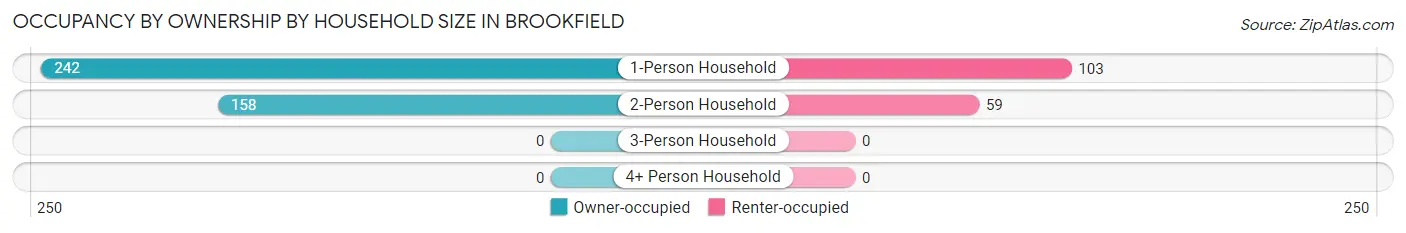
| Household Size | Owner-occupied | Renter-occupied |
| 1-Person Household | 242 (70.1%) | 103 (29.9%) |
| 2-Person Household | 158 (72.8%) | 59 (27.2%) |
| 3-Person Household | 0 (0.0%) | 0 (0.0%) |
| 4+ Person Household | 0 (0.0%) | 0 (0.0%) |
| Total Housing Units | 400 (71.2%) | 162 (28.8%) |
Occupancy by Educational Attainment in Brookfield
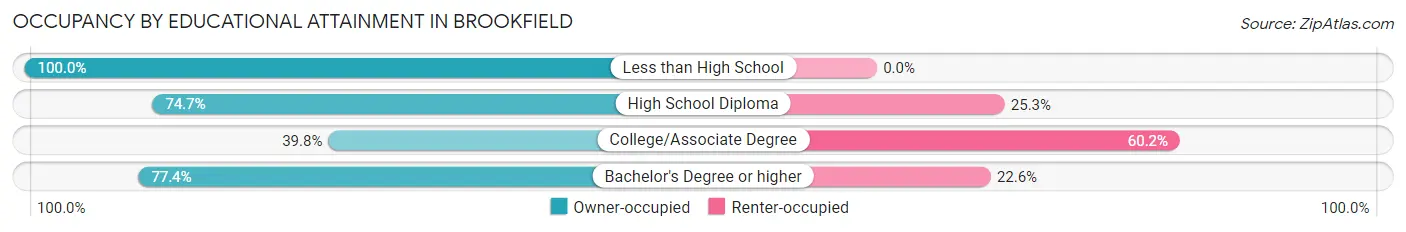
| Household Size | Owner-occupied | Renter-occupied |
| Less than High School | 36 (100.0%) | 0 (0.0%) |
| High School Diploma | 174 (74.7%) | 59 (25.3%) |
| College/Associate Degree | 39 (39.8%) | 59 (60.2%) |
| Bachelor's Degree or higher | 151 (77.4%) | 44 (22.6%) |
Occupancy by Age of Householder in Brookfield
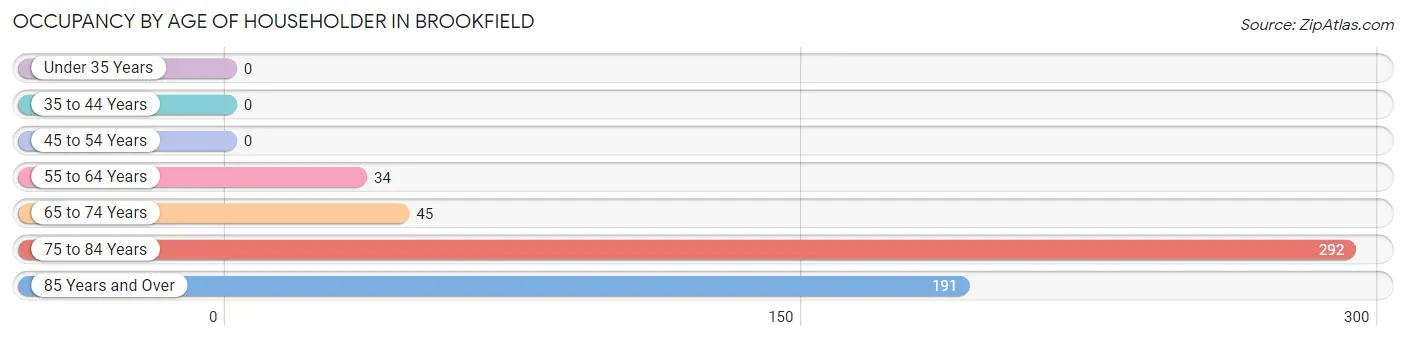
| Age Bracket | # Households | % Households |
| Under 35 Years | 0 | 0.0% |
| 35 to 44 Years | 0 | 0.0% |
| 45 to 54 Years | 0 | 0.0% |
| 55 to 64 Years | 34 | 6.0% |
| 65 to 74 Years | 45 | 8.0% |
| 75 to 84 Years | 292 | 52.0% |
| 85 Years and Over | 191 | 34.0% |
| Total | 562 | 100.0% |
Housing Finances in Brookfield
Median Income by Occupancy in Brookfield
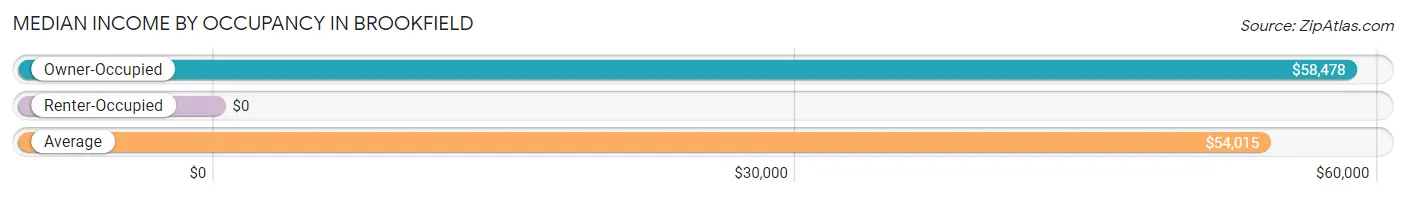
| Occupancy Type | # Households | Median Income |
| Owner-Occupied | 400 (71.2%) | $58,478 |
| Renter-Occupied | 162 (28.8%) | $0 |
| Average | 562 (100.0%) | $54,015 |
Occupancy by Householder Income Bracket in Brookfield
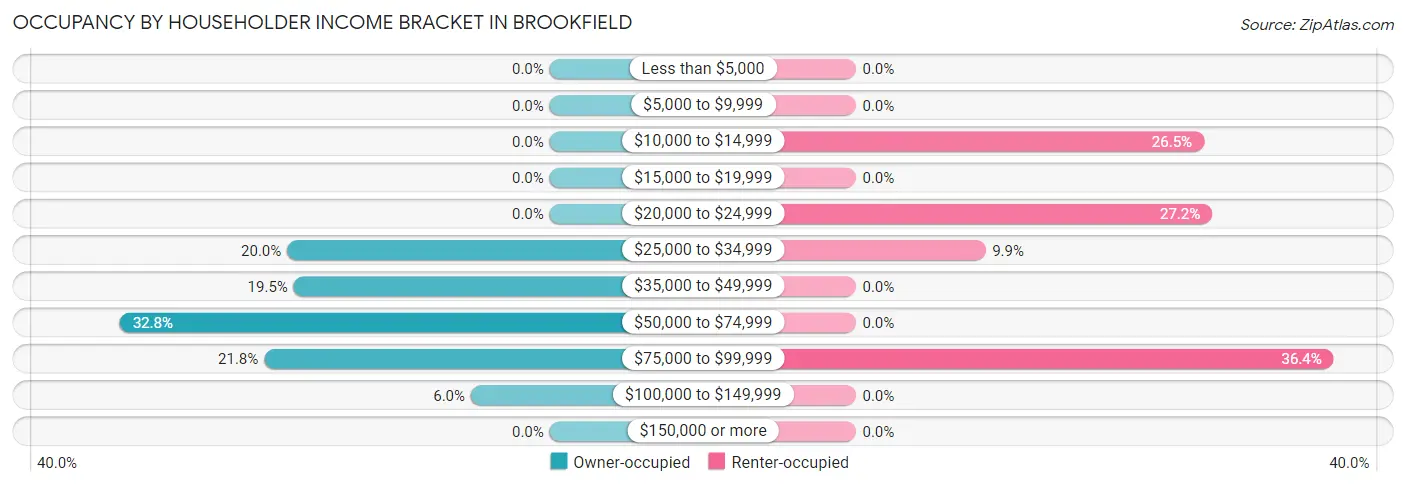
| Income Bracket | Owner-occupied | Renter-occupied |
| Less than $5,000 | 0 (0.0%) | 0 (0.0%) |
| $5,000 to $9,999 | 0 (0.0%) | 0 (0.0%) |
| $10,000 to $14,999 | 0 (0.0%) | 43 (26.5%) |
| $15,000 to $19,999 | 0 (0.0%) | 0 (0.0%) |
| $20,000 to $24,999 | 0 (0.0%) | 44 (27.2%) |
| $25,000 to $34,999 | 80 (20.0%) | 16 (9.9%) |
| $35,000 to $49,999 | 78 (19.5%) | 0 (0.0%) |
| $50,000 to $74,999 | 131 (32.8%) | 0 (0.0%) |
| $75,000 to $99,999 | 87 (21.7%) | 59 (36.4%) |
| $100,000 to $149,999 | 24 (6.0%) | 0 (0.0%) |
| $150,000 or more | 0 (0.0%) | 0 (0.0%) |
| Total | 400 (100.0%) | 162 (100.0%) |
Monthly Housing Cost Tiers in Brookfield
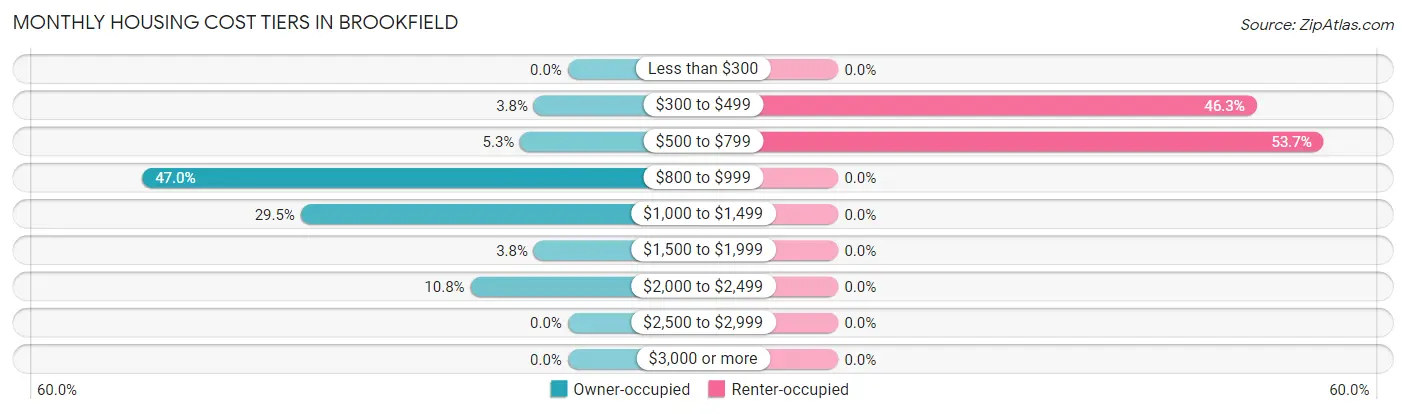
| Monthly Cost | Owner-occupied | Renter-occupied |
| Less than $300 | 0 (0.0%) | 0 (0.0%) |
| $300 to $499 | 15 (3.7%) | 75 (46.3%) |
| $500 to $799 | 21 (5.2%) | 87 (53.7%) |
| $800 to $999 | 188 (47.0%) | 0 (0.0%) |
| $1,000 to $1,499 | 118 (29.5%) | 0 (0.0%) |
| $1,500 to $1,999 | 15 (3.7%) | 0 (0.0%) |
| $2,000 to $2,499 | 43 (10.7%) | 0 (0.0%) |
| $2,500 to $2,999 | 0 (0.0%) | 0 (0.0%) |
| $3,000 or more | 0 (0.0%) | 0 (0.0%) |
| Total | 400 (100.0%) | 162 (100.0%) |
Physical Housing Characteristics in Brookfield
Housing Structures in Brookfield
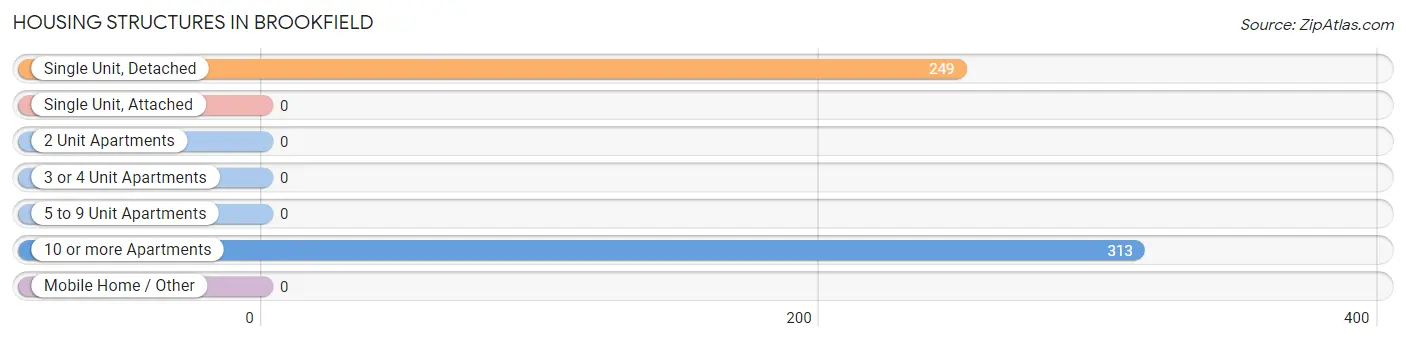
| Structure Type | # Housing Units | % Housing Units |
| Single Unit, Detached | 249 | 44.3% |
| Single Unit, Attached | 0 | 0.0% |
| 2 Unit Apartments | 0 | 0.0% |
| 3 or 4 Unit Apartments | 0 | 0.0% |
| 5 to 9 Unit Apartments | 0 | 0.0% |
| 10 or more Apartments | 313 | 55.7% |
| Mobile Home / Other | 0 | 0.0% |
| Total | 562 | 100.0% |
Housing Structures by Occupancy in Brookfield
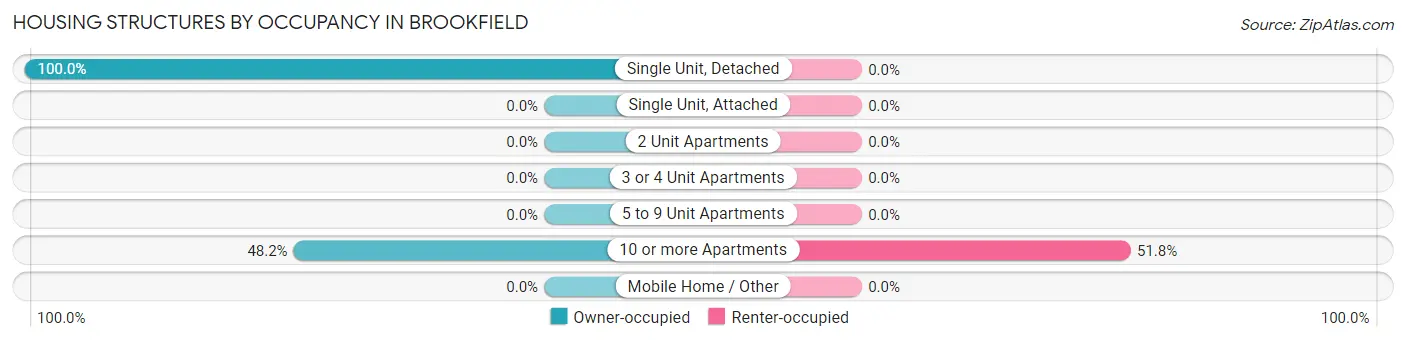
| Structure Type | Owner-occupied | Renter-occupied |
| Single Unit, Detached | 249 (100.0%) | 0 (0.0%) |
| Single Unit, Attached | 0 (0.0%) | 0 (0.0%) |
| 2 Unit Apartments | 0 (0.0%) | 0 (0.0%) |
| 3 or 4 Unit Apartments | 0 (0.0%) | 0 (0.0%) |
| 5 to 9 Unit Apartments | 0 (0.0%) | 0 (0.0%) |
| 10 or more Apartments | 151 (48.2%) | 162 (51.8%) |
| Mobile Home / Other | 0 (0.0%) | 0 (0.0%) |
| Total | 400 (71.2%) | 162 (28.8%) |
Housing Structures by Number of Rooms in Brookfield
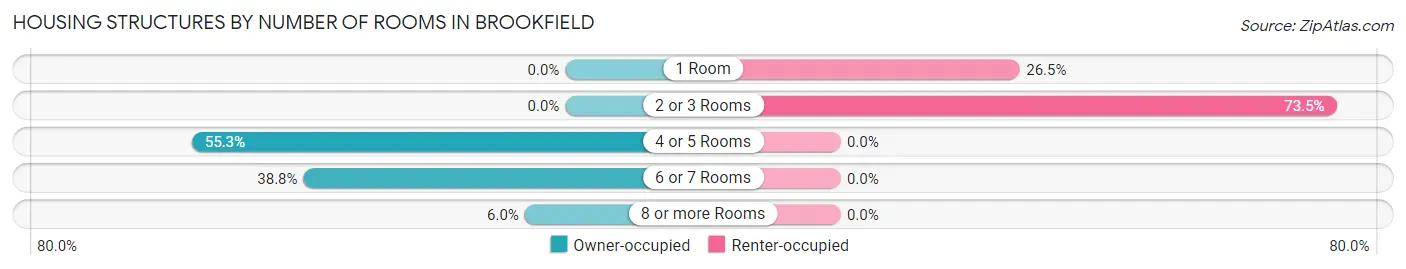
| Number of Rooms | Owner-occupied | Renter-occupied |
| 1 Room | 0 (0.0%) | 43 (26.5%) |
| 2 or 3 Rooms | 0 (0.0%) | 119 (73.5%) |
| 4 or 5 Rooms | 221 (55.2%) | 0 (0.0%) |
| 6 or 7 Rooms | 155 (38.8%) | 0 (0.0%) |
| 8 or more Rooms | 24 (6.0%) | 0 (0.0%) |
| Total | 400 (100.0%) | 162 (100.0%) |
Housing Structure by Heating Type in Brookfield
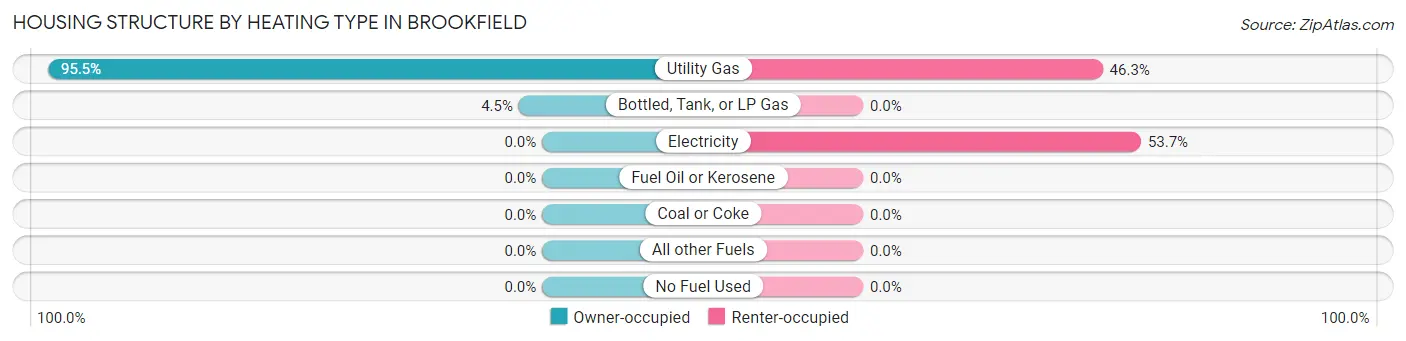
| Heating Type | Owner-occupied | Renter-occupied |
| Utility Gas | 382 (95.5%) | 75 (46.3%) |
| Bottled, Tank, or LP Gas | 18 (4.5%) | 0 (0.0%) |
| Electricity | 0 (0.0%) | 87 (53.7%) |
| Fuel Oil or Kerosene | 0 (0.0%) | 0 (0.0%) |
| Coal or Coke | 0 (0.0%) | 0 (0.0%) |
| All other Fuels | 0 (0.0%) | 0 (0.0%) |
| No Fuel Used | 0 (0.0%) | 0 (0.0%) |
| Total | 400 (100.0%) | 162 (100.0%) |
Household Vehicle Usage in Brookfield
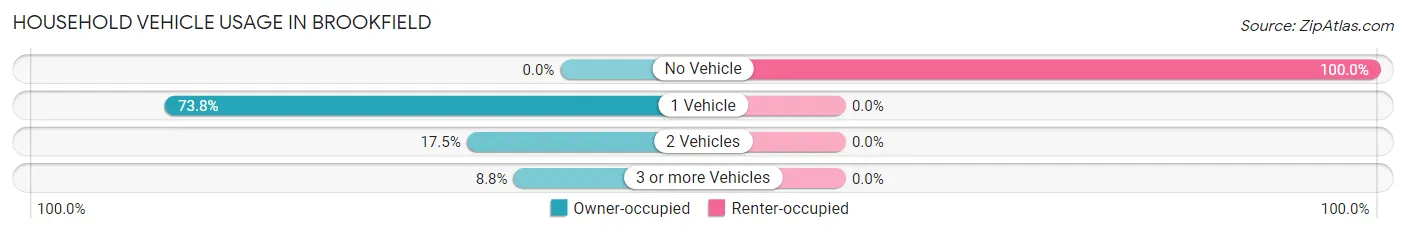
| Vehicles per Household | Owner-occupied | Renter-occupied |
| No Vehicle | 0 (0.0%) | 162 (100.0%) |
| 1 Vehicle | 295 (73.8%) | 0 (0.0%) |
| 2 Vehicles | 70 (17.5%) | 0 (0.0%) |
| 3 or more Vehicles | 35 (8.7%) | 0 (0.0%) |
| Total | 400 (100.0%) | 162 (100.0%) |
Real Estate & Mortgages in Brookfield
Real Estate and Mortgage Overview in Brookfield
| Characteristic | Without Mortgage | With Mortgage |
| Housing Units | 342 | 58 |
| Median Property Value | $287,500 | $191,900 |
| Median Household Income | $57,500 | $0 |
| Monthly Housing Costs | $946 | $0 |
| Real Estate Taxes | $5,341 | $0 |
Property Value by Mortgage Status in Brookfield
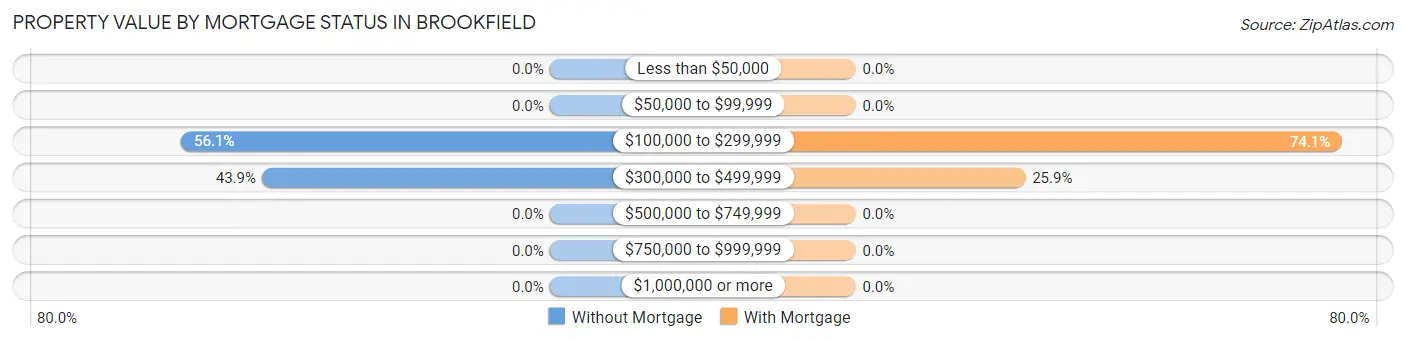
| Property Value | Without Mortgage | With Mortgage |
| Less than $50,000 | 0 (0.0%) | 0 (0.0%) |
| $50,000 to $99,999 | 0 (0.0%) | 0 (0.0%) |
| $100,000 to $299,999 | 192 (56.1%) | 43 (74.1%) |
| $300,000 to $499,999 | 150 (43.9%) | 15 (25.9%) |
| $500,000 to $749,999 | 0 (0.0%) | 0 (0.0%) |
| $750,000 to $999,999 | 0 (0.0%) | 0 (0.0%) |
| $1,000,000 or more | 0 (0.0%) | 0 (0.0%) |
| Total | 342 (100.0%) | 58 (100.0%) |
Household Income by Mortgage Status in Brookfield
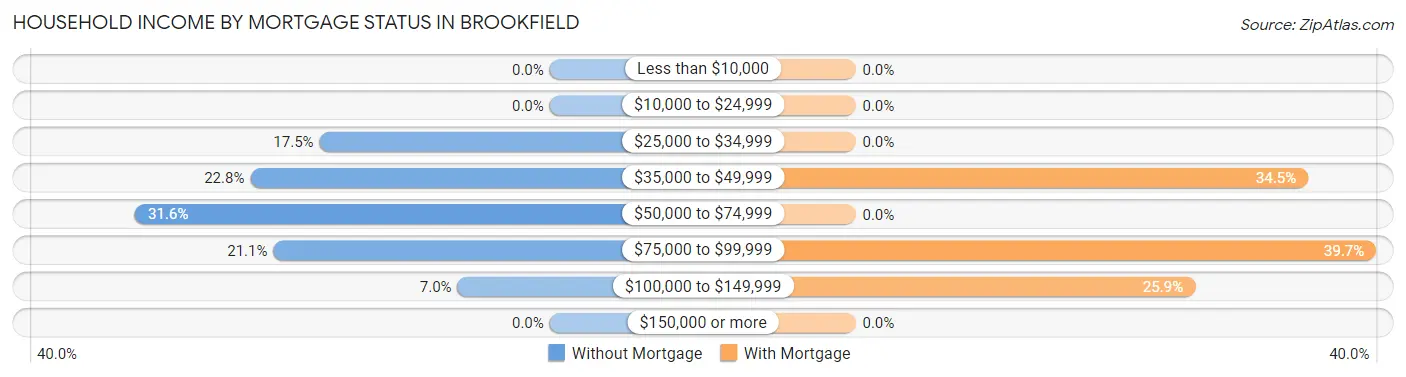
| Household Income | Without Mortgage | With Mortgage |
| Less than $10,000 | 0 (0.0%) | 0 (0.0%) |
| $10,000 to $24,999 | 0 (0.0%) | 0 (0.0%) |
| $25,000 to $34,999 | 60 (17.5%) | 0 (0.0%) |
| $35,000 to $49,999 | 78 (22.8%) | 20 (34.5%) |
| $50,000 to $74,999 | 108 (31.6%) | 0 (0.0%) |
| $75,000 to $99,999 | 72 (21.0%) | 23 (39.7%) |
| $100,000 to $149,999 | 24 (7.0%) | 15 (25.9%) |
| $150,000 or more | 0 (0.0%) | 0 (0.0%) |
| Total | 342 (100.0%) | 58 (100.0%) |
Property Value to Household Income Ratio in Brookfield
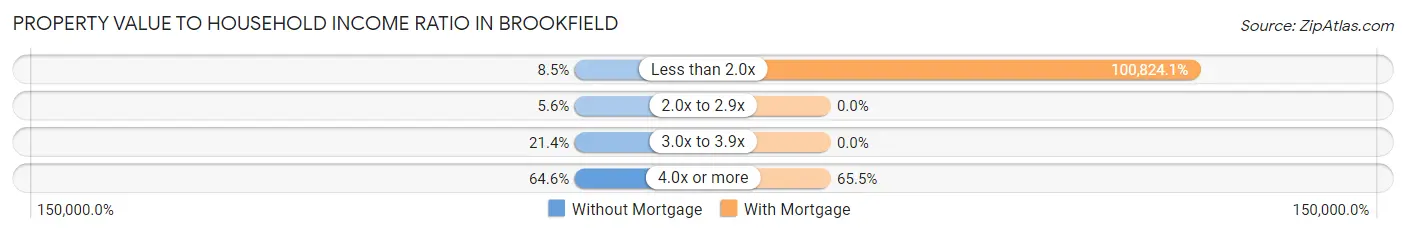
| Value-to-Income Ratio | Without Mortgage | With Mortgage |
| Less than 2.0x | 29 (8.5%) | 58,478 (100,824.1%) |
| 2.0x to 2.9x | 19 (5.6%) | 0 (0.0%) |
| 3.0x to 3.9x | 73 (21.3%) | 0 (0.0%) |
| 4.0x or more | 221 (64.6%) | 38 (65.5%) |
| Total | 342 (100.0%) | 58 (100.0%) |
Real Estate Taxes by Mortgage Status in Brookfield
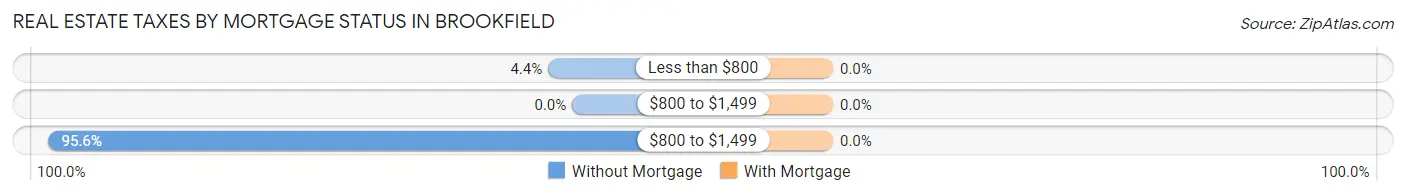
| Property Taxes | Without Mortgage | With Mortgage |
| Less than $800 | 15 (4.4%) | 0 (0.0%) |
| $800 to $1,499 | 0 (0.0%) | 0 (0.0%) |
| $800 to $1,499 | 327 (95.6%) | 0 (0.0%) |
| Total | 342 (100.0%) | 58 (100.0%) |
Health & Disability in Brookfield
Health Insurance Coverage by Age in Brookfield
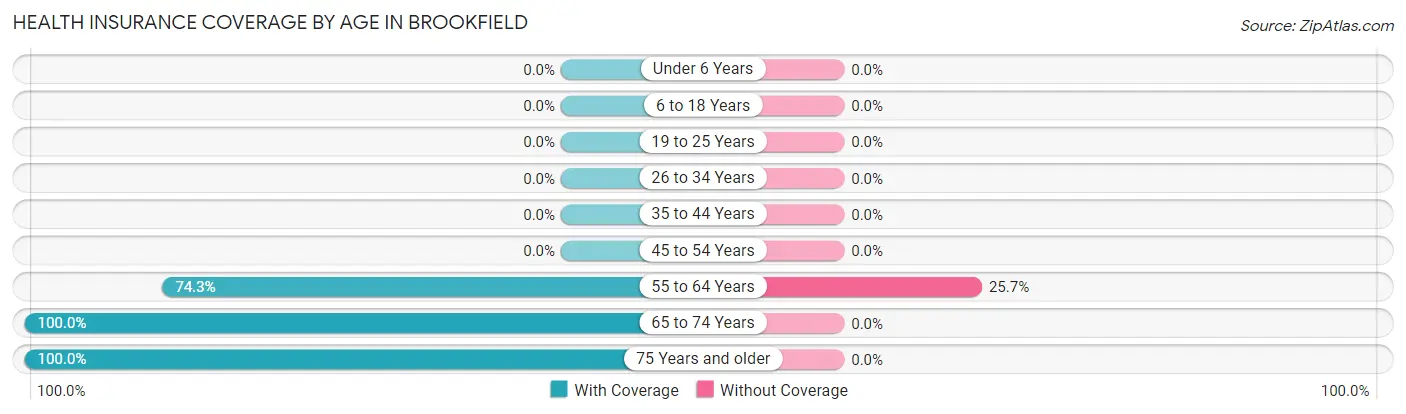
| Age Bracket | With Coverage | Without Coverage |
| Under 6 Years | 0 (0.0%) | 0 (0.0%) |
| 6 to 18 Years | 0 (0.0%) | 0 (0.0%) |
| 19 to 25 Years | 0 (0.0%) | 0 (0.0%) |
| 26 to 34 Years | 0 (0.0%) | 0 (0.0%) |
| 35 to 44 Years | 0 (0.0%) | 0 (0.0%) |
| 45 to 54 Years | 0 (0.0%) | 0 (0.0%) |
| 55 to 64 Years | 55 (74.3%) | 19 (25.7%) |
| 65 to 74 Years | 67 (100.0%) | 0 (0.0%) |
| 75 Years and older | 633 (100.0%) | 0 (0.0%) |
| Total | 755 (97.6%) | 19 (2.5%) |
Health Insurance Coverage by Citizenship Status in Brookfield
| Citizenship Status | With Coverage | Without Coverage |
| Native Born | 0 (0.0%) | 0 (0.0%) |
| Foreign Born, Citizen | 0 (0.0%) | 0 (0.0%) |
| Foreign Born, not a Citizen | 0 (0.0%) | 0 (0.0%) |
Health Insurance Coverage by Household Income in Brookfield
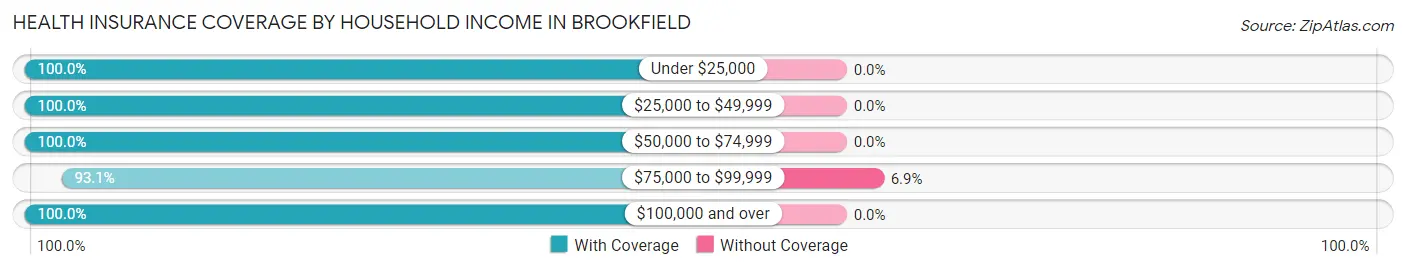
| Household Income | With Coverage | Without Coverage |
| Under $25,000 | 87 (100.0%) | 0 (0.0%) |
| $25,000 to $49,999 | 223 (100.0%) | 0 (0.0%) |
| $50,000 to $74,999 | 143 (100.0%) | 0 (0.0%) |
| $75,000 to $99,999 | 256 (93.1%) | 19 (6.9%) |
| $100,000 and over | 46 (100.0%) | 0 (0.0%) |
Public vs Private Health Insurance Coverage by Age in Brookfield
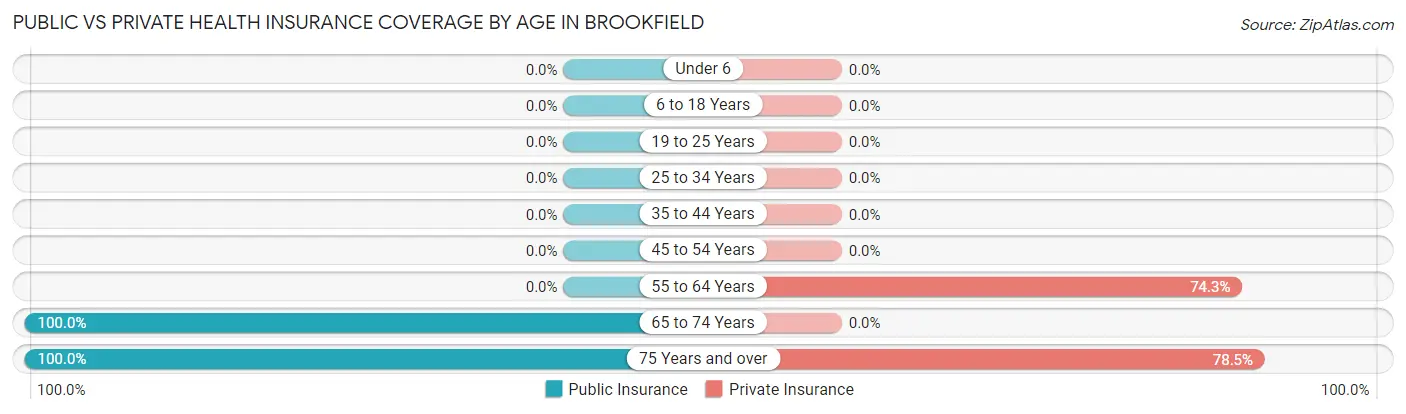
| Age Bracket | Public Insurance | Private Insurance |
| Under 6 | 0 (0.0%) | 0 (0.0%) |
| 6 to 18 Years | 0 (0.0%) | 0 (0.0%) |
| 19 to 25 Years | 0 (0.0%) | 0 (0.0%) |
| 25 to 34 Years | 0 (0.0%) | 0 (0.0%) |
| 35 to 44 Years | 0 (0.0%) | 0 (0.0%) |
| 45 to 54 Years | 0 (0.0%) | 0 (0.0%) |
| 55 to 64 Years | 0 (0.0%) | 55 (74.3%) |
| 65 to 74 Years | 67 (100.0%) | 0 (0.0%) |
| 75 Years and over | 633 (100.0%) | 497 (78.5%) |
| Total | 700 (90.4%) | 552 (71.3%) |
Disability Status by Sex by Age in Brookfield
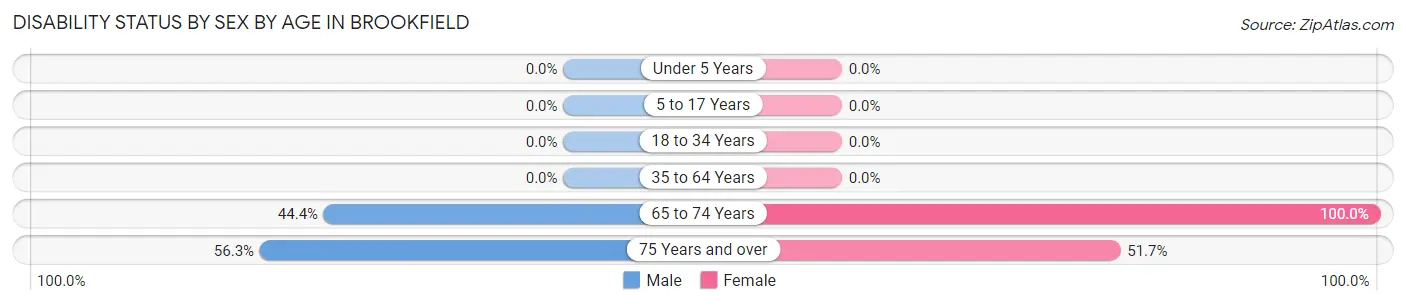
| Age Bracket | Male | Female |
| Under 5 Years | 0 (0.0%) | 0 (0.0%) |
| 5 to 17 Years | 0 (0.0%) | 0 (0.0%) |
| 18 to 34 Years | 0 (0.0%) | 0 (0.0%) |
| 35 to 64 Years | 0 (0.0%) | 0 (0.0%) |
| 65 to 74 Years | 20 (44.4%) | 22 (100.0%) |
| 75 Years and over | 107 (56.3%) | 229 (51.7%) |
Disability Class by Sex by Age in Brookfield
Disability Class: Hearing Difficulty
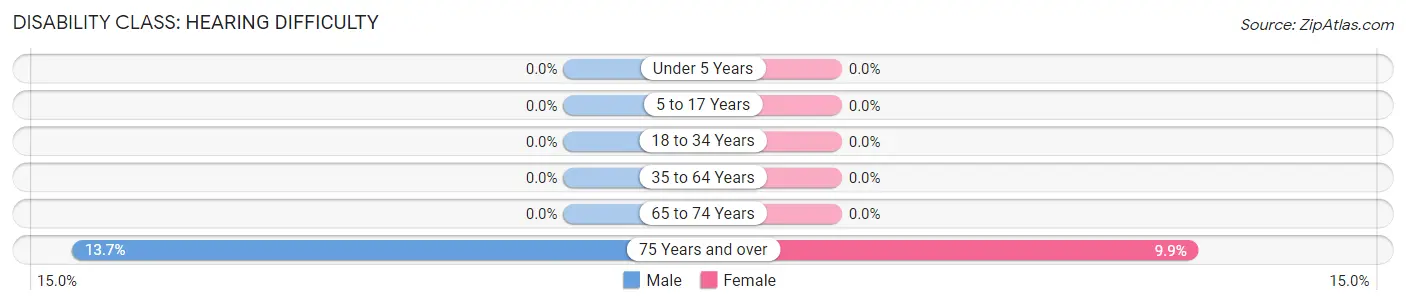
| Age Bracket | Male | Female |
| Under 5 Years | 0 (0.0%) | 0 (0.0%) |
| 5 to 17 Years | 0 (0.0%) | 0 (0.0%) |
| 18 to 34 Years | 0 (0.0%) | 0 (0.0%) |
| 35 to 64 Years | 0 (0.0%) | 0 (0.0%) |
| 65 to 74 Years | 0 (0.0%) | 0 (0.0%) |
| 75 Years and over | 26 (13.7%) | 44 (9.9%) |
Disability Class: Vision Difficulty
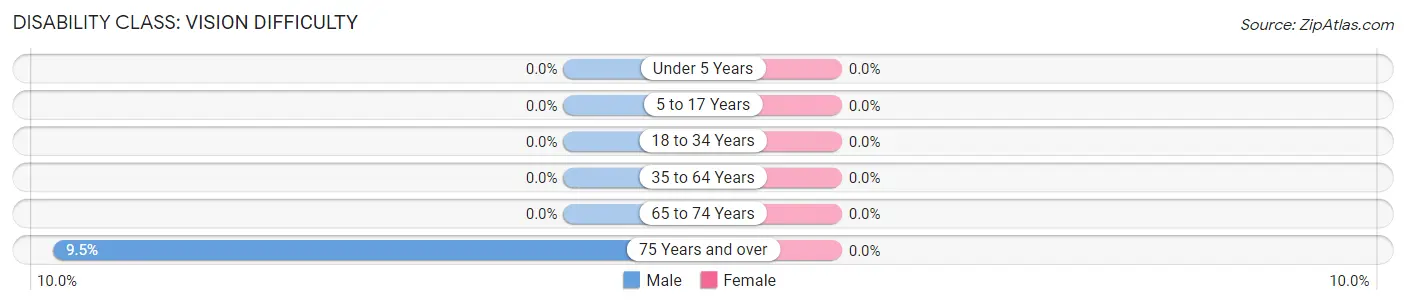
| Age Bracket | Male | Female |
| Under 5 Years | 0 (0.0%) | 0 (0.0%) |
| 5 to 17 Years | 0 (0.0%) | 0 (0.0%) |
| 18 to 34 Years | 0 (0.0%) | 0 (0.0%) |
| 35 to 64 Years | 0 (0.0%) | 0 (0.0%) |
| 65 to 74 Years | 0 (0.0%) | 0 (0.0%) |
| 75 Years and over | 18 (9.5%) | 0 (0.0%) |
Disability Class: Cognitive Difficulty
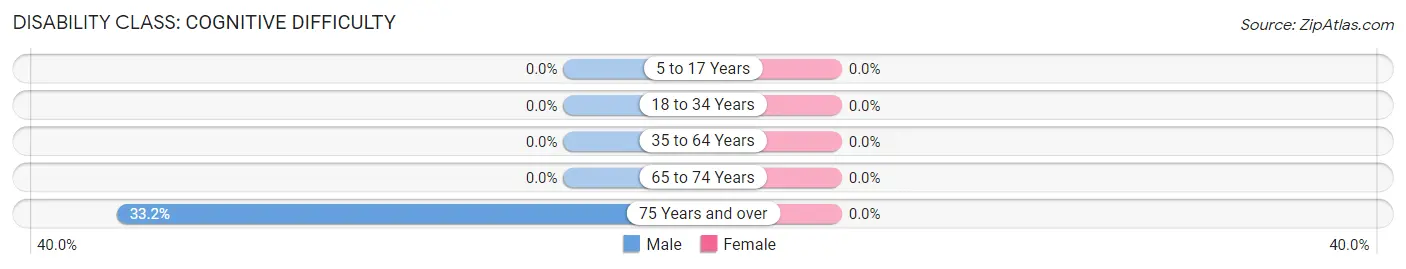
| Age Bracket | Male | Female |
| 5 to 17 Years | 0 (0.0%) | 0 (0.0%) |
| 18 to 34 Years | 0 (0.0%) | 0 (0.0%) |
| 35 to 64 Years | 0 (0.0%) | 0 (0.0%) |
| 65 to 74 Years | 0 (0.0%) | 0 (0.0%) |
| 75 Years and over | 63 (33.2%) | 0 (0.0%) |
Disability Class: Ambulatory Difficulty
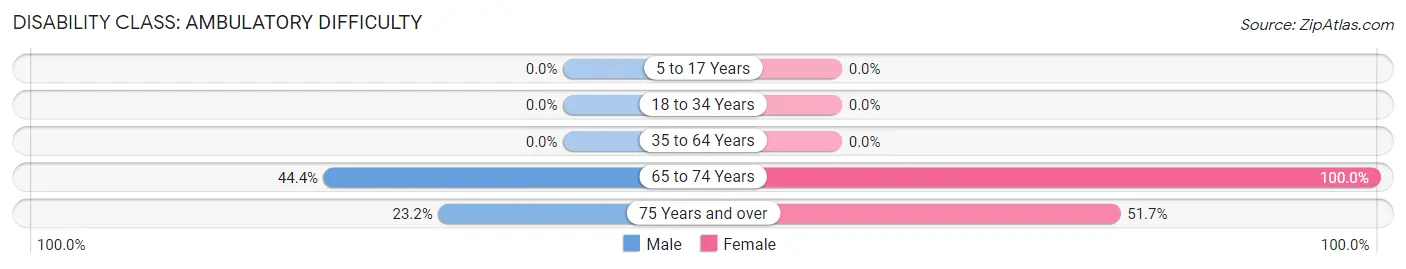
| Age Bracket | Male | Female |
| 5 to 17 Years | 0 (0.0%) | 0 (0.0%) |
| 18 to 34 Years | 0 (0.0%) | 0 (0.0%) |
| 35 to 64 Years | 0 (0.0%) | 0 (0.0%) |
| 65 to 74 Years | 20 (44.4%) | 22 (100.0%) |
| 75 Years and over | 44 (23.2%) | 229 (51.7%) |
Disability Class: Self-Care Difficulty
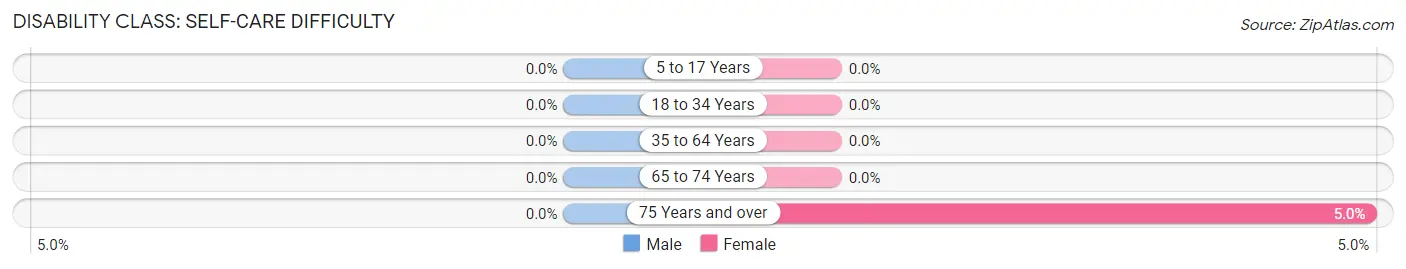
| Age Bracket | Male | Female |
| 5 to 17 Years | 0 (0.0%) | 0 (0.0%) |
| 18 to 34 Years | 0 (0.0%) | 0 (0.0%) |
| 35 to 64 Years | 0 (0.0%) | 0 (0.0%) |
| 65 to 74 Years | 0 (0.0%) | 0 (0.0%) |
| 75 Years and over | 0 (0.0%) | 22 (5.0%) |
Technology Access in Brookfield
Computing Device Access in Brookfield
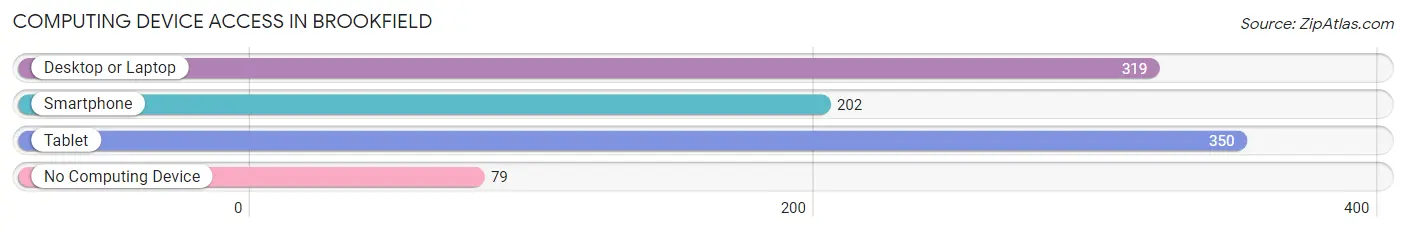
| Device Type | # Households | % Households |
| Desktop or Laptop | 319 | 56.8% |
| Smartphone | 202 | 35.9% |
| Tablet | 350 | 62.3% |
| No Computing Device | 79 | 14.1% |
| Total | 562 | 100.0% |
Internet Access in Brookfield
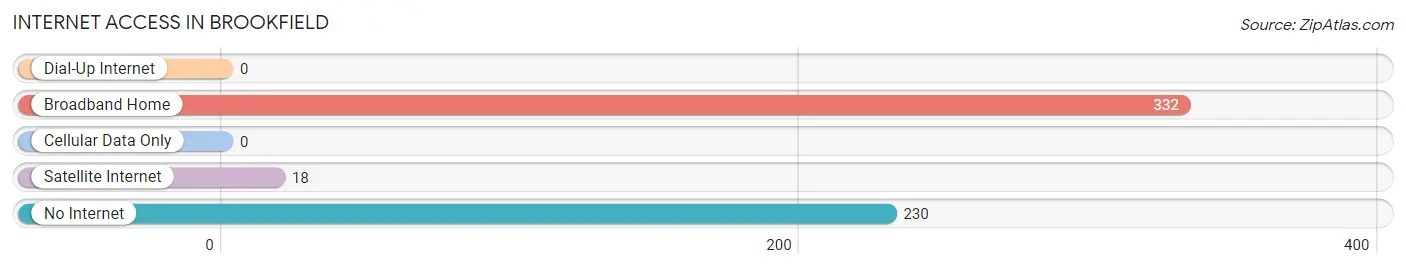
| Internet Type | # Households | % Households |
| Dial-Up Internet | 0 | 0.0% |
| Broadband Home | 332 | 59.1% |
| Cellular Data Only | 0 | 0.0% |
| Satellite Internet | 18 | 3.2% |
| No Internet | 230 | 40.9% |
| Total | 562 | 100.0% |
Brookfield Summary
Brookfield is a small town located in Morris County, New Jersey. It is situated in the northwest corner of the state, just south of the New York border. The town has a population of approximately 4,000 people and covers an area of 4.2 square miles.
History
The area that is now Brookfield was originally inhabited by the Lenape Native Americans. The first European settlers arrived in the area in the late 17th century. The town was officially established in 1760 and was named after the brook that ran through the area.
In the 19th century, Brookfield was a rural farming community. The town was home to several mills, including a grist mill, a saw mill, and a paper mill. The town also had a blacksmith shop, a general store, and a post office.
Geography
Brookfield is located in the northwest corner of Morris County, New Jersey. It is bordered by the towns of Montville, Kinnelon, and Butler. The town is situated on the banks of the Pequannock River. The terrain is mostly flat, with some rolling hills.
The climate in Brookfield is typical of the northeastern United States. Summers are warm and humid, while winters are cold and snowy. The average annual temperature is around 50 degrees Fahrenheit.
Economy
The economy of Brookfield is largely based on agriculture and tourism. The town is home to several farms, which produce a variety of crops, including corn, soybeans, and hay. The town also has several wineries and breweries, which attract tourists from all over the region.
In addition to agriculture and tourism, Brookfield is home to several small businesses. These include restaurants, retail stores, and professional services. The town also has a few light industrial businesses.
Demographics
As of the 2010 census, the population of Brookfield was 4,039. The racial makeup of the town was 94.3% White, 2.2% African American, 0.3% Native American, 1.2% Asian, and 1.9% from other races. Hispanic or Latino of any race were 4.3% of the population.
The median household income in Brookfield was $90,917, and the median family income was $103,917. The per capita income was $41,917. About 4.3% of families and 5.3% of the population were below the poverty line.
The town is served by the Brookfield School District, which consists of two elementary schools, one middle school, and one high school. The town also has several private schools, including a Catholic school and a Montessori school.
Common Questions
What is Per Capita Income in Brookfield?
Per Capita income in Brookfield is $41,338.
What is the Median Family Income in Brookfield?
Median Family Income in Brookfield is $91,229.
What is the Median Household income in Brookfield?
Median Household Income in Brookfield is $54,015.
What is Inequality or Gini Index in Brookfield?
Inequality or Gini Index in Brookfield is 0.28.
What is the Total Population of Brookfield?
Total Population of Brookfield is 774.
What is the Total Male Population of Brookfield?
Total Male Population of Brookfield is 250.
What is the Total Female Population of Brookfield?
Total Female Population of Brookfield is 524.
What is the Ratio of Males per 100 Females in Brookfield?
There are 47.71 Males per 100 Females in Brookfield.
What is the Ratio of Females per 100 Males in Brookfield?
There are 209.60 Females per 100 Males in Brookfield.
What is the Median Population Age in Brookfield?
Median Population Age in Brookfield is 82.5 Years.
What is the Average Family Size in Brookfield
Average Family Size in Brookfield is 2.0 People.
What is the Average Household Size in Brookfield
Average Household Size in Brookfield is 1.4 People.
How Large is the Labor Force in Brookfield?
There are 99 People in the Labor Forcein in Brookfield.
What is the Percentage of People in the Labor Force in Brookfield?
12.8% of People are in the Labor Force in Brookfield.