Zip Codes with the Highest Percentage of Households Without a Vehicle in Paterson, NJ
RELATED REPORTS & OPTIONS
Households without a Cars
Paterson
Compare Zip Codes
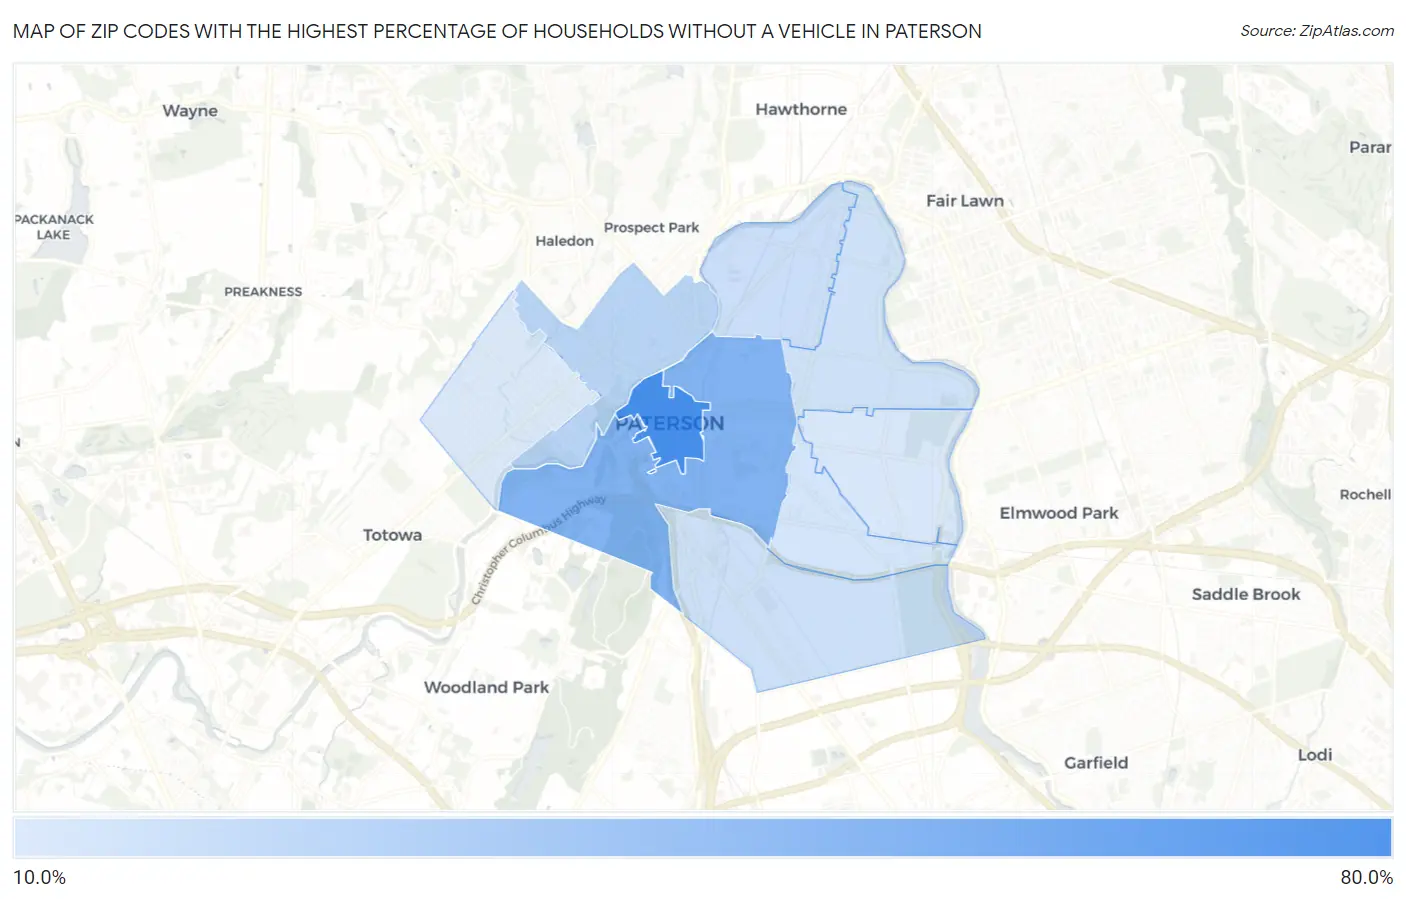
Map of Zip Codes with the Highest Percentage of Households Without a Vehicle in Paterson
17.8%
61.7%
Zip Codes with the Highest Percentage of Households Without a Vehicle in Paterson, NJ
| Zip Code | Housholds Without a Car | vs State | vs National | |
| 1. | 07505 | 61.7% | 11.3%(+50.4)#4 | 8.3%(+53.4)#261 |
| 2. | 07501 | 43.3% | 11.3%(+32.0)#11 | 8.3%(+35.0)#436 |
| 3. | 07522 | 26.9% | 11.3%(+15.6)#40 | 8.3%(+18.6)#944 |
| 4. | 07524 | 22.4% | 11.3%(+11.1)#50 | 8.3%(+14.1)#1,265 |
| 5. | 07503 | 21.8% | 11.3%(+10.5)#51 | 8.3%(+13.5)#1,315 |
| 6. | 07514 | 21.3% | 11.3%(+10.00)#53 | 8.3%(+13.0)#1,356 |
| 7. | 07513 | 20.1% | 11.3%(+8.80)#57 | 8.3%(+11.8)#1,489 |
| 8. | 07504 | 18.8% | 11.3%(+7.50)#59 | 8.3%(+10.5)#1,667 |
| 9. | 07502 | 17.8% | 11.3%(+6.50)#64 | 8.3%(+9.50)#1,817 |
1
Common Questions
What are the Top 5 Zip Codes with the Highest Percentage of Households Without a Vehicle in Paterson, NJ?
Top 5 Zip Codes with the Highest Percentage of Households Without a Vehicle in Paterson, NJ are:
What zip code has the Highest Percentage of Households Without a Vehicle in Paterson, NJ?
07505 has the Highest Percentage of Households Without a Vehicle in Paterson, NJ with 61.7%.
What is the Percentage of Households Without a Vehicle in Paterson, NJ?
Percentage of Households Without a Vehicle in Paterson is 28.3%.
What is the Percentage of Households Without a Vehicle in New Jersey?
Percentage of Households Without a Vehicle in New Jersey is 11.3%.
What is the Percentage of Households Without a Vehicle in the United States?
Percentage of Households Without a Vehicle in the United States is 8.3%.