Brainards, NJ Map & Demographics
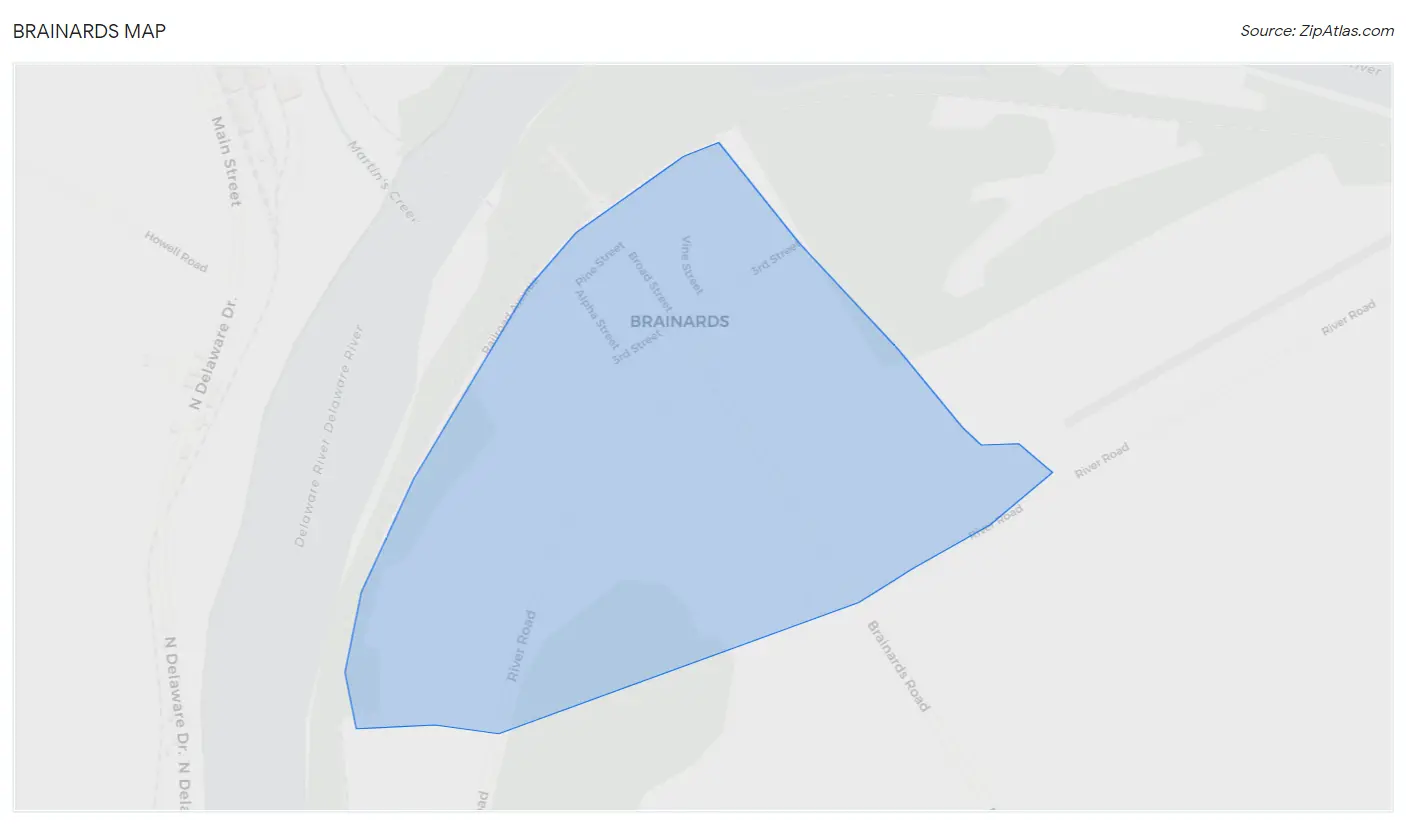
Brainards Map
Brainards Overview
$47,240
PER CAPITA INCOME
$118,125
AVG FAMILY INCOME
$165,278
AVG HOUSEHOLD INCOME
19.5%
WAGE / INCOME GAP [ % ]
80.5¢/ $1
WAGE / INCOME GAP [ $ ]
0.21
INEQUALITY / GINI INDEX
166
TOTAL POPULATION
85
MALE POPULATION
81
FEMALE POPULATION
104.94
MALES / 100 FEMALES
95.29
FEMALES / 100 MALES
50.5
MEDIAN AGE
2.5
AVG FAMILY SIZE
2.8
AVG HOUSEHOLD SIZE
128
LABOR FORCE [ PEOPLE ]
97.0%
PERCENT IN LABOR FORCE
7.8%
UNEMPLOYMENT RATE
Income in Brainards
Income Overview in Brainards
Per Capita Income in Brainards is $47,240, while median incomes of families and households are $118,125 and $165,278 respectively.
| Characteristic | Number | Measure |
| Per Capita Income | 166 | $47,240 |
| Median Family Income | 60 | $118,125 |
| Mean Family Income | 60 | $121,247 |
| Median Household Income | 60 | $165,278 |
| Mean Household Income | 60 | $128,977 |
| Income Deficit | 60 | $0 |
| Wage / Income Gap (%) | 166 | 19.54% |
| Wage / Income Gap ($) | 166 | 80.46¢ per $1 |
| Gini / Inequality Index | 166 | 0.21 |
Earnings by Sex in Brainards
Average Earnings in Brainards are $49,688, $59,875 for men and $48,177 for women, a difference of 19.5%.
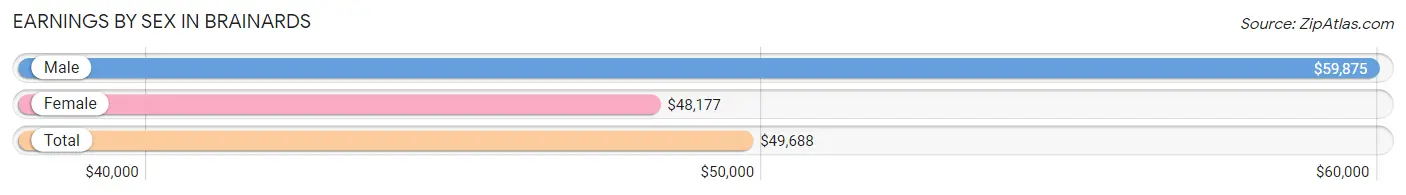
| Sex | Number | Average Earnings |
| Male | 69 (52.3%) | $59,875 |
| Female | 63 (47.7%) | $48,177 |
| Total | 132 (100.0%) | $49,688 |
Earnings by Sex by Income Bracket in Brainards
The most common earnings brackets in Brainards are $100,000+ for men (27 | 39.1%) and $45,000 to $49,999 for women (24 | 38.1%).
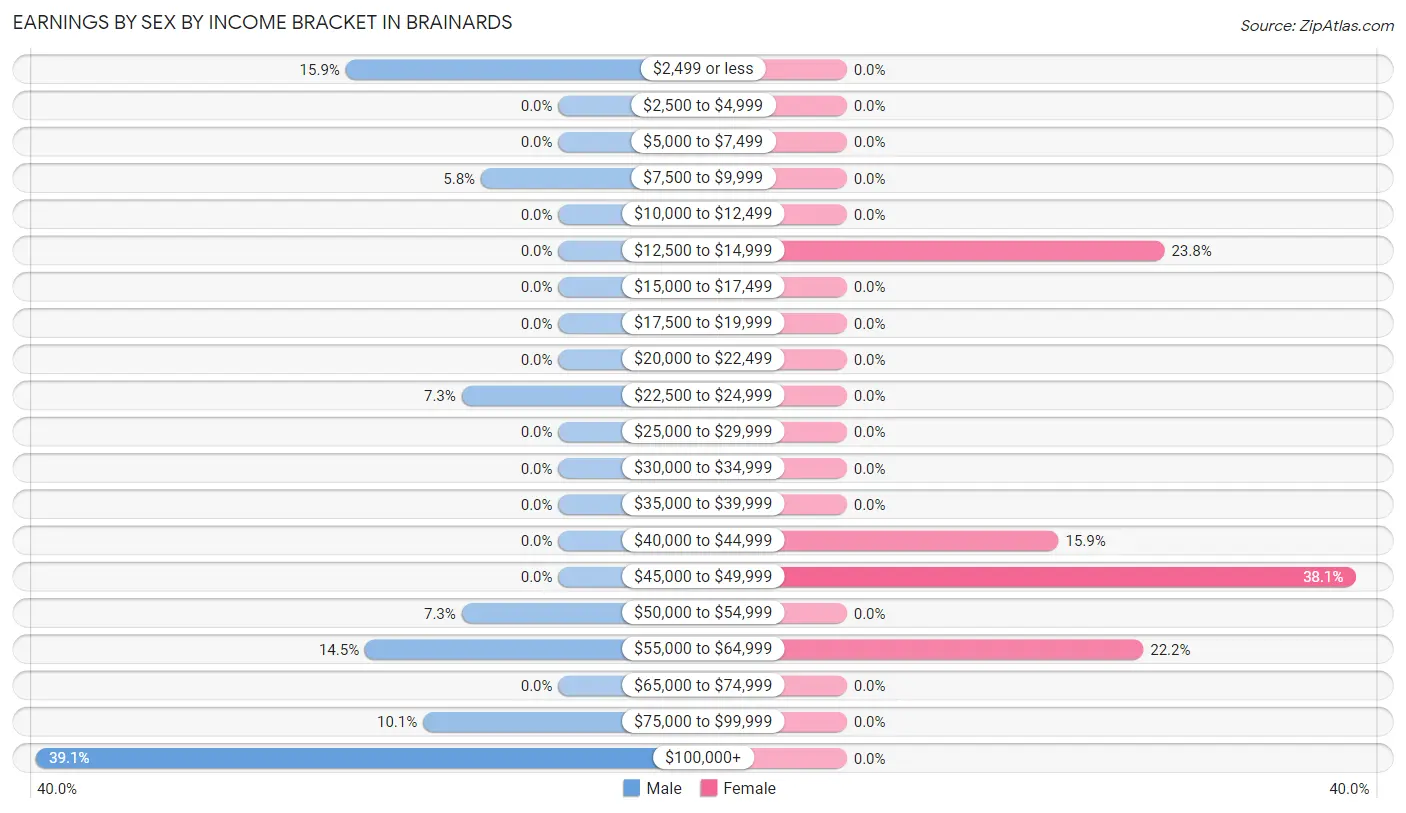
| Income | Male | Female |
| $2,499 or less | 11 (15.9%) | 0 (0.0%) |
| $2,500 to $4,999 | 0 (0.0%) | 0 (0.0%) |
| $5,000 to $7,499 | 0 (0.0%) | 0 (0.0%) |
| $7,500 to $9,999 | 4 (5.8%) | 0 (0.0%) |
| $10,000 to $12,499 | 0 (0.0%) | 0 (0.0%) |
| $12,500 to $14,999 | 0 (0.0%) | 15 (23.8%) |
| $15,000 to $17,499 | 0 (0.0%) | 0 (0.0%) |
| $17,500 to $19,999 | 0 (0.0%) | 0 (0.0%) |
| $20,000 to $22,499 | 0 (0.0%) | 0 (0.0%) |
| $22,500 to $24,999 | 5 (7.2%) | 0 (0.0%) |
| $25,000 to $29,999 | 0 (0.0%) | 0 (0.0%) |
| $30,000 to $34,999 | 0 (0.0%) | 0 (0.0%) |
| $35,000 to $39,999 | 0 (0.0%) | 0 (0.0%) |
| $40,000 to $44,999 | 0 (0.0%) | 10 (15.9%) |
| $45,000 to $49,999 | 0 (0.0%) | 24 (38.1%) |
| $50,000 to $54,999 | 5 (7.2%) | 0 (0.0%) |
| $55,000 to $64,999 | 10 (14.5%) | 14 (22.2%) |
| $65,000 to $74,999 | 0 (0.0%) | 0 (0.0%) |
| $75,000 to $99,999 | 7 (10.1%) | 0 (0.0%) |
| $100,000+ | 27 (39.1%) | 0 (0.0%) |
| Total | 69 (100.0%) | 63 (100.0%) |
Earnings by Sex by Educational Attainment in Brainards
Average earnings in Brainards are $59,875 for men and $48,177 for women, a difference of 19.5%. Men with an educational attainment of high school diploma enjoy the highest average annual earnings of $115,509, while those with high school diploma education earn the least with $115,509. Women with an educational attainment of high school diploma earn the most with the average annual earnings of $43,875, while those with high school diploma education have the smallest earnings of $43,875.
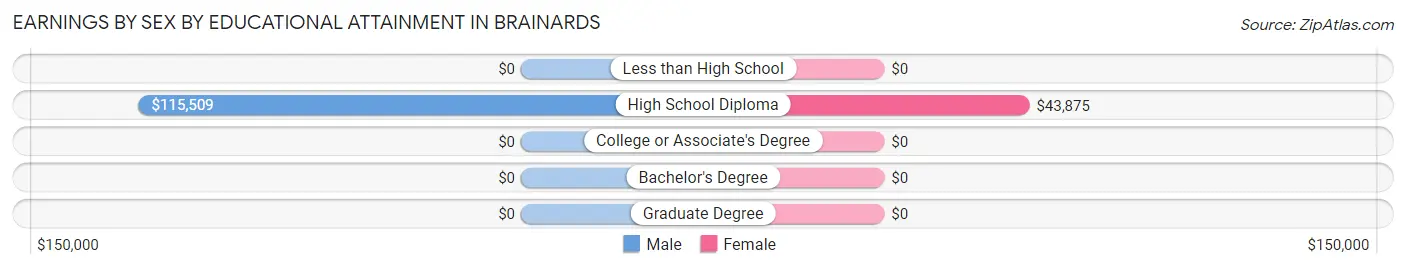
| Educational Attainment | Male Income | Female Income |
| Less than High School | - | - |
| High School Diploma | $115,509 | $43,875 |
| College or Associate's Degree | - | - |
| Bachelor's Degree | - | - |
| Graduate Degree | - | - |
| Total | $59,875 | $48,177 |
Family Income in Brainards
Family Income Brackets in Brainards
According to the Brainards family income data, there are 27 families falling into the $150,000 to $199,999 income range, which is the most common income bracket and makes up 45.0% of all families.
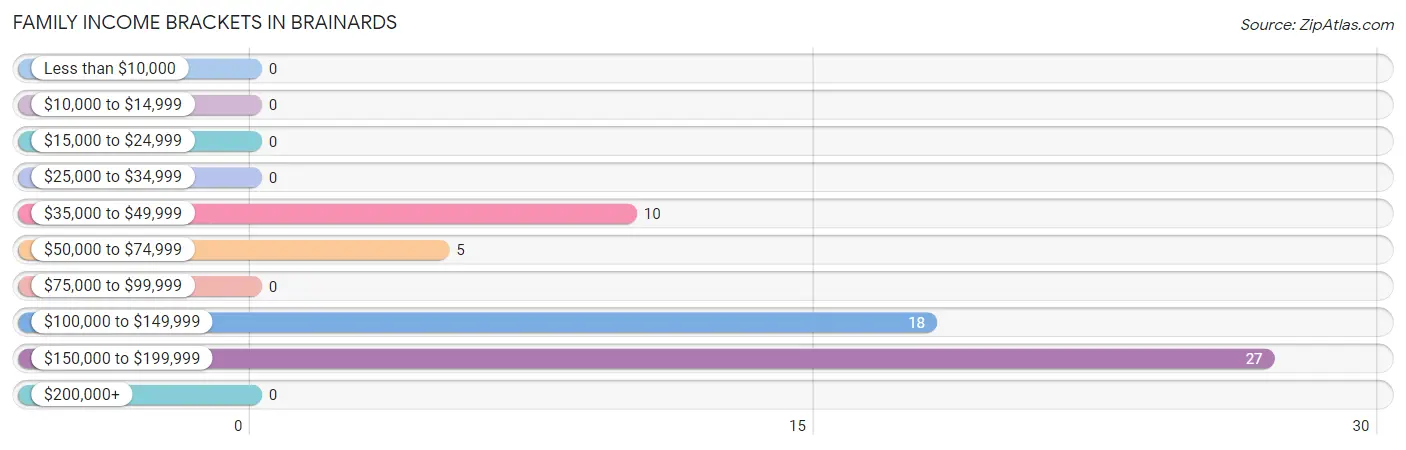
| Income Bracket | # Families | % Families |
| Less than $10,000 | 0 | 0.0% |
| $10,000 to $14,999 | 0 | 0.0% |
| $15,000 to $24,999 | 0 | 0.0% |
| $25,000 to $34,999 | 0 | 0.0% |
| $35,000 to $49,999 | 10 | 16.7% |
| $50,000 to $74,999 | 5 | 8.3% |
| $75,000 to $99,999 | 0 | 0.0% |
| $100,000 to $149,999 | 18 | 30.0% |
| $150,000 to $199,999 | 27 | 45.0% |
| $200,000+ | 0 | 0.0% |
Family Income by Famaliy Size in Brainards
2-person families (52 | 86.7%) account for the highest median family income in Brainards with $165,093 per family, while 2-person families (52 | 86.7%) have the highest median income of $82,546 per family member.
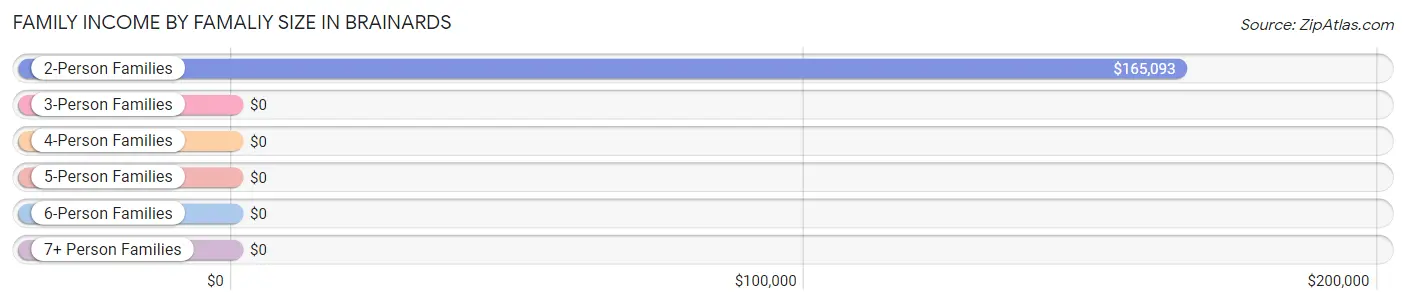
| Income Bracket | # Families | Median Income |
| 2-Person Families | 52 (86.7%) | $165,093 |
| 3-Person Families | 0 (0.0%) | $0 |
| 4-Person Families | 0 (0.0%) | $0 |
| 5-Person Families | 8 (13.3%) | $0 |
| 6-Person Families | 0 (0.0%) | $0 |
| 7+ Person Families | 0 (0.0%) | $0 |
| Total | 60 (100.0%) | $118,125 |
Family Income by Number of Earners in Brainards
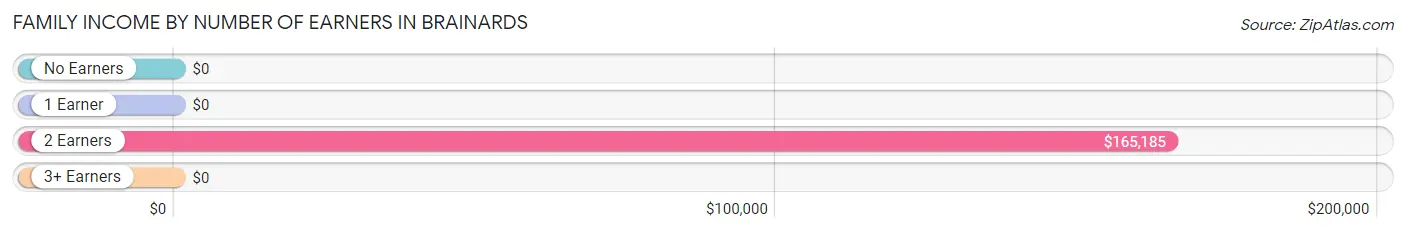
| Number of Earners | # Families | Median Income |
| No Earners | 0 (0.0%) | $0 |
| 1 Earner | 10 (16.7%) | $0 |
| 2 Earners | 50 (83.3%) | $165,185 |
| 3+ Earners | 0 (0.0%) | $0 |
| Total | 60 (100.0%) | $118,125 |
Household Income in Brainards
Household Income Brackets in Brainards
With 33 households falling in the category, the $150,000 to $199,999 income range is the most frequent in Brainards, accounting for 55.0% of all households.
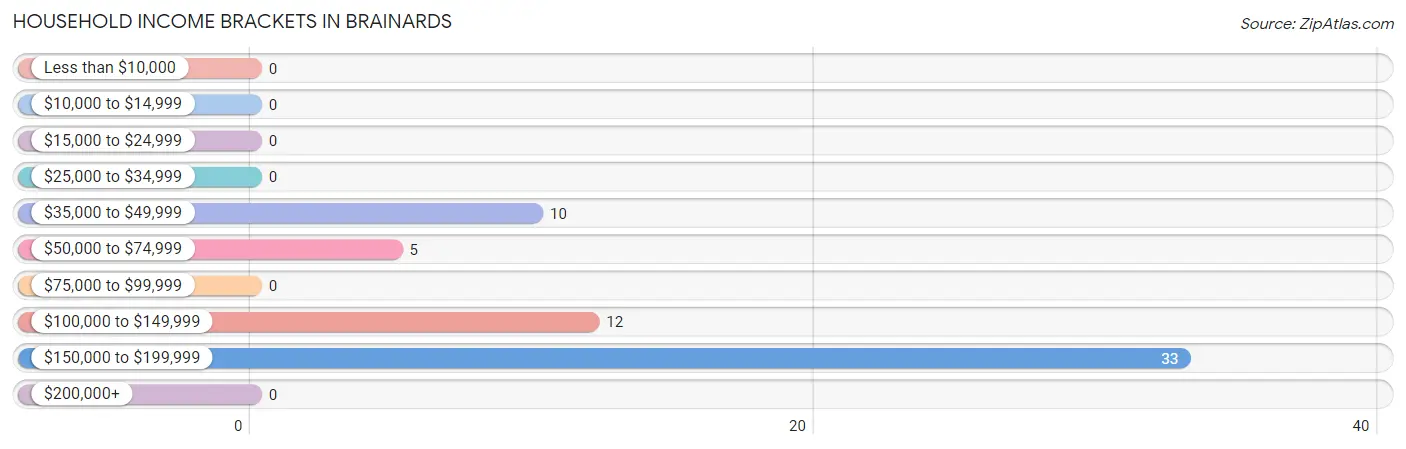
| Income Bracket | # Households | % Households |
| Less than $10,000 | 0 | 0.0% |
| $10,000 to $14,999 | 0 | 0.0% |
| $15,000 to $24,999 | 0 | 0.0% |
| $25,000 to $34,999 | 0 | 0.0% |
| $35,000 to $49,999 | 10 | 16.7% |
| $50,000 to $74,999 | 5 | 8.3% |
| $75,000 to $99,999 | 0 | 0.0% |
| $100,000 to $149,999 | 12 | 20.0% |
| $150,000 to $199,999 | 33 | 55.0% |
| $200,000+ | 0 | 0.0% |
Household Income by Householder Age in Brainards
The median household income in Brainards is $165,278, with the highest median household income of $166,065 found in the 45 to 64 years age bracket for the primary householder. A total of 43 households (71.7%) fall into this category.
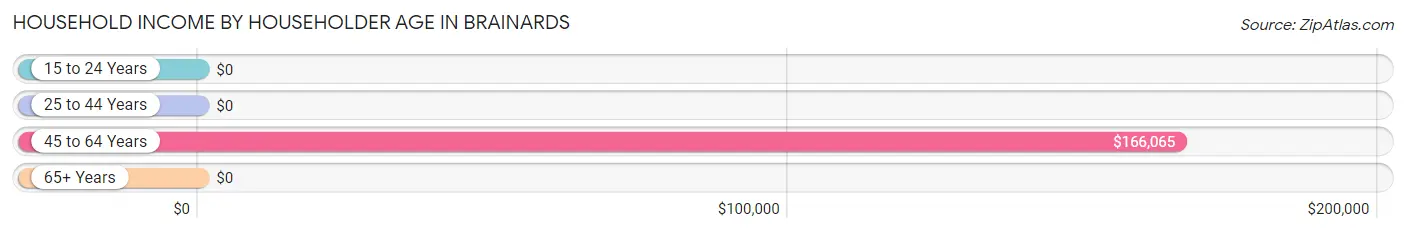
| Income Bracket | # Households | Median Income |
| 15 to 24 Years | 0 (0.0%) | $0 |
| 25 to 44 Years | 8 (13.3%) | $0 |
| 45 to 64 Years | 43 (71.7%) | $166,065 |
| 65+ Years | 9 (15.0%) | $0 |
| Total | 60 (100.0%) | $165,278 |
Poverty in Brainards
Income Below Poverty by Sex and Age in Brainards
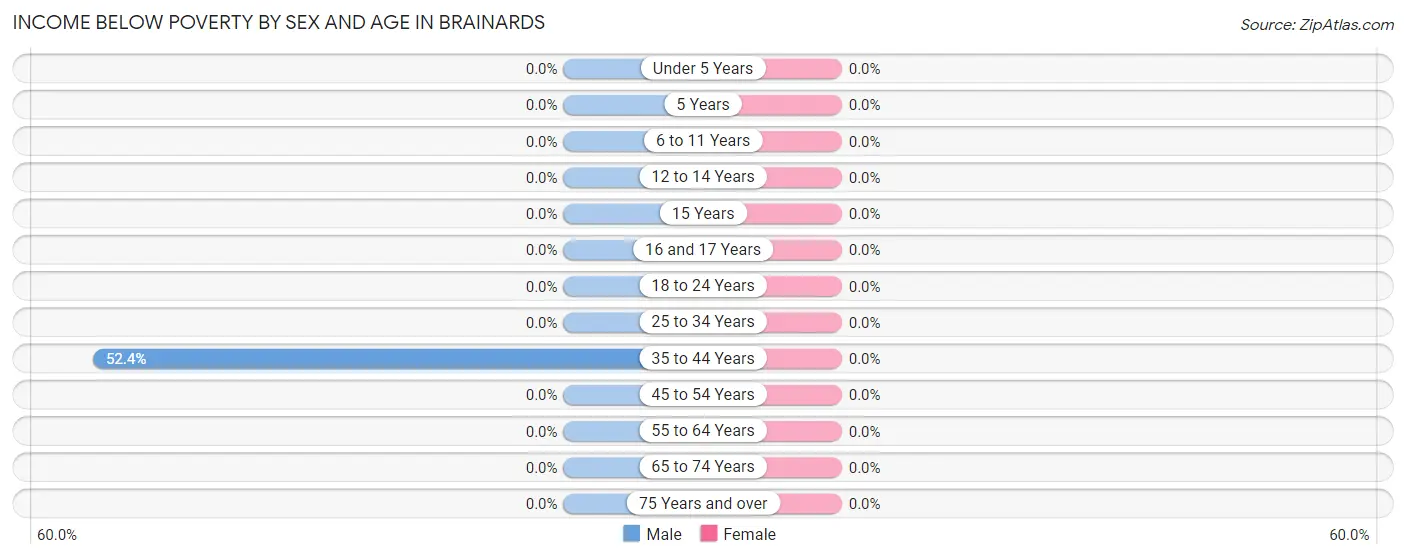
| Age Bracket | Male | Female |
| Under 5 Years | 0 (0.0%) | 0 (0.0%) |
| 5 Years | 0 (0.0%) | 0 (0.0%) |
| 6 to 11 Years | 0 (0.0%) | 0 (0.0%) |
| 12 to 14 Years | 0 (0.0%) | 0 (0.0%) |
| 15 Years | 0 (0.0%) | 0 (0.0%) |
| 16 and 17 Years | 0 (0.0%) | 0 (0.0%) |
| 18 to 24 Years | 0 (0.0%) | 0 (0.0%) |
| 25 to 34 Years | 0 (0.0%) | 0 (0.0%) |
| 35 to 44 Years | 11 (52.4%) | 0 (0.0%) |
| 45 to 54 Years | 0 (0.0%) | 0 (0.0%) |
| 55 to 64 Years | 0 (0.0%) | 0 (0.0%) |
| 65 to 74 Years | 0 (0.0%) | 0 (0.0%) |
| 75 Years and over | 0 (0.0%) | 0 (0.0%) |
| Total | 11 (12.9%) | 0 (0.0%) |
Income Above Poverty by Sex and Age in Brainards
According to the poverty statistics in Brainards, males aged 5 years and females aged 6 to 11 years are the age groups that are most secure financially, with 100.0% of males and 100.0% of females in these age groups living above the poverty line.
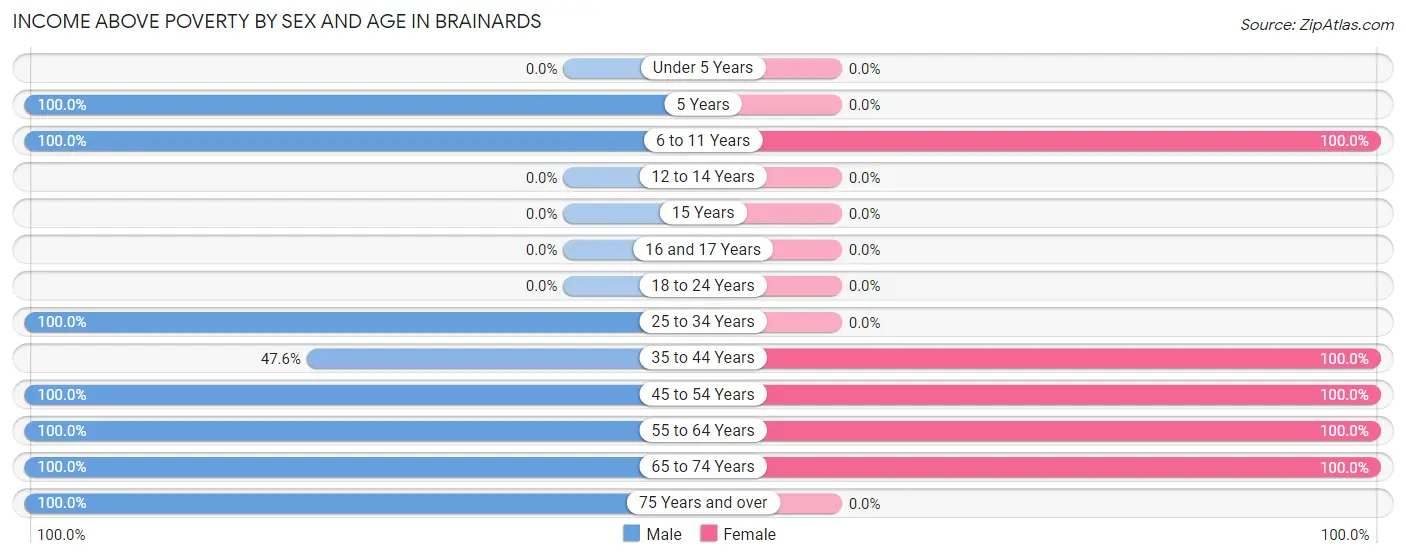
| Age Bracket | Male | Female |
| Under 5 Years | 0 (0.0%) | 0 (0.0%) |
| 5 Years | 8 (100.0%) | 0 (0.0%) |
| 6 to 11 Years | 8 (100.0%) | 18 (100.0%) |
| 12 to 14 Years | 0 (0.0%) | 0 (0.0%) |
| 15 Years | 0 (0.0%) | 0 (0.0%) |
| 16 and 17 Years | 0 (0.0%) | 0 (0.0%) |
| 18 to 24 Years | 0 (0.0%) | 0 (0.0%) |
| 25 to 34 Years | 5 (100.0%) | 0 (0.0%) |
| 35 to 44 Years | 10 (47.6%) | 8 (100.0%) |
| 45 to 54 Years | 7 (100.0%) | 26 (100.0%) |
| 55 to 64 Years | 27 (100.0%) | 24 (100.0%) |
| 65 to 74 Years | 4 (100.0%) | 5 (100.0%) |
| 75 Years and over | 5 (100.0%) | 0 (0.0%) |
| Total | 74 (87.1%) | 81 (100.0%) |
Income Below Poverty Among Married-Couple Families in Brainards
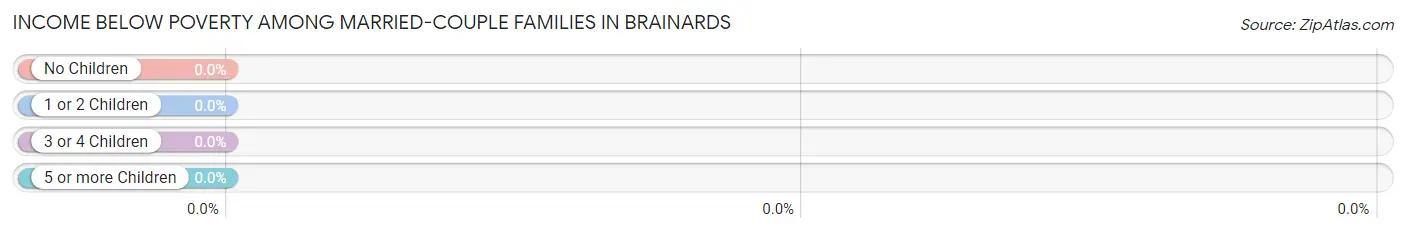
| Children | Above Poverty | Below Poverty |
| No Children | 31 (100.0%) | 0 (0.0%) |
| 1 or 2 Children | 0 (0.0%) | 0 (0.0%) |
| 3 or 4 Children | 8 (100.0%) | 0 (0.0%) |
| 5 or more Children | 0 (0.0%) | 0 (0.0%) |
| Total | 39 (100.0%) | 0 (0.0%) |
Income Below Poverty Among Single-Parent Households in Brainards
| Children | Single Father | Single Mother |
| No Children | 0 (0.0%) | 0 (0.0%) |
| 1 or 2 Children | 0 (0.0%) | 0 (0.0%) |
| 3 or 4 Children | 0 (0.0%) | 0 (0.0%) |
| 5 or more Children | 0 (0.0%) | 0 (0.0%) |
| Total | 0 (0.0%) | 0 (0.0%) |
Income Below Poverty Among Married-Couple vs Single-Parent Households in Brainards
| Children | Married-Couple Families | Single-Parent Households |
| No Children | 0 (0.0%) | 0 (0.0%) |
| 1 or 2 Children | 0 (0.0%) | 0 (0.0%) |
| 3 or 4 Children | 0 (0.0%) | 0 (0.0%) |
| 5 or more Children | 0 (0.0%) | 0 (0.0%) |
| Total | 0 (0.0%) | 0 (0.0%) |
Race in Brainards
The most populous races in Brainards are , and White / Caucasian (166 | 100.0%).
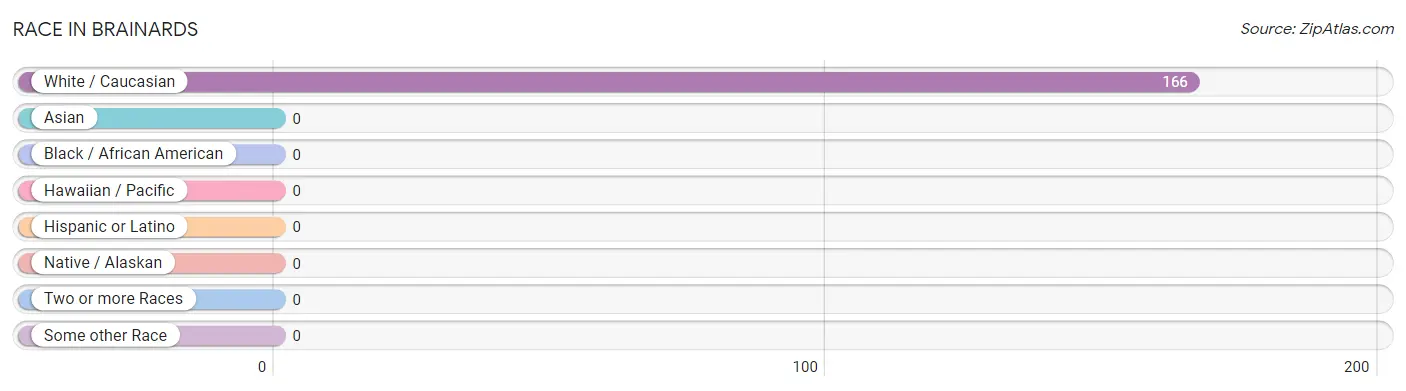
| Race | # Population | % Population |
| Asian | 0 | 0.0% |
| Black / African American | 0 | 0.0% |
| Hawaiian / Pacific | 0 | 0.0% |
| Hispanic or Latino | 0 | 0.0% |
| Native / Alaskan | 0 | 0.0% |
| White / Caucasian | 166 | 100.0% |
| Two or more Races | 0 | 0.0% |
| Some other Race | 0 | 0.0% |
| Total | 166 | 100.0% |
Ancestry in Brainards
The most populous ancestries reported in Brainards are German (33 | 19.9%), English (32 | 19.3%), Irish (29 | 17.5%), Polish (21 | 12.7%), and Italian (10 | 6.0%), together accounting for 75.3% of all Brainards residents.
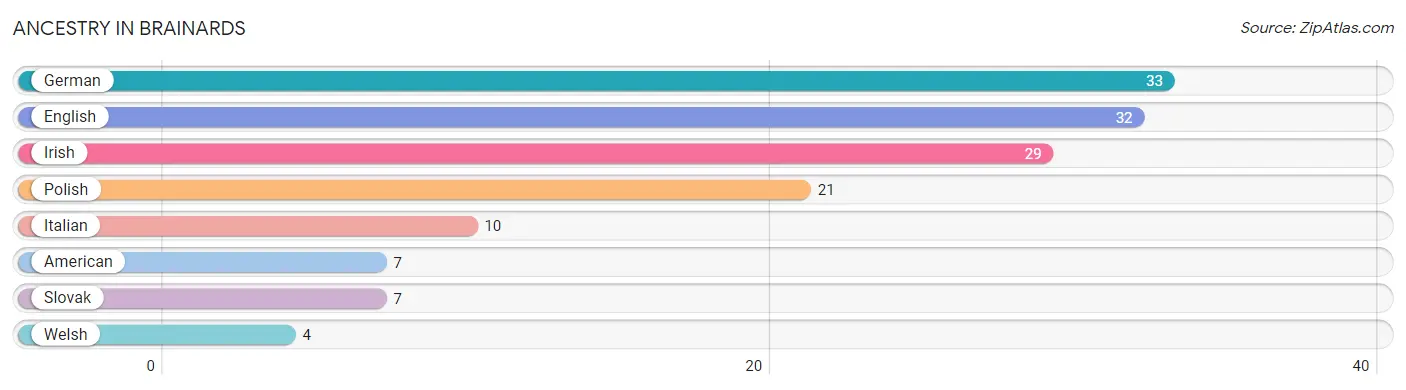
| Ancestry | # Population | % Population |
| American | 7 | 4.2% |
| English | 32 | 19.3% |
| German | 33 | 19.9% |
| Irish | 29 | 17.5% |
| Italian | 10 | 6.0% |
| Polish | 21 | 12.7% |
| Slovak | 7 | 4.2% |
| Welsh | 4 | 2.4% | View All 8 Rows |
Immigrants in Brainards

| Immigration Origin | # Population | % Population | View All 0 Rows |
Sex and Age in Brainards
Sex and Age in Brainards
The most populous age groups in Brainards are 55 to 59 Years (27 | 31.8%) for men and 60 to 64 Years (24 | 29.6%) for women.
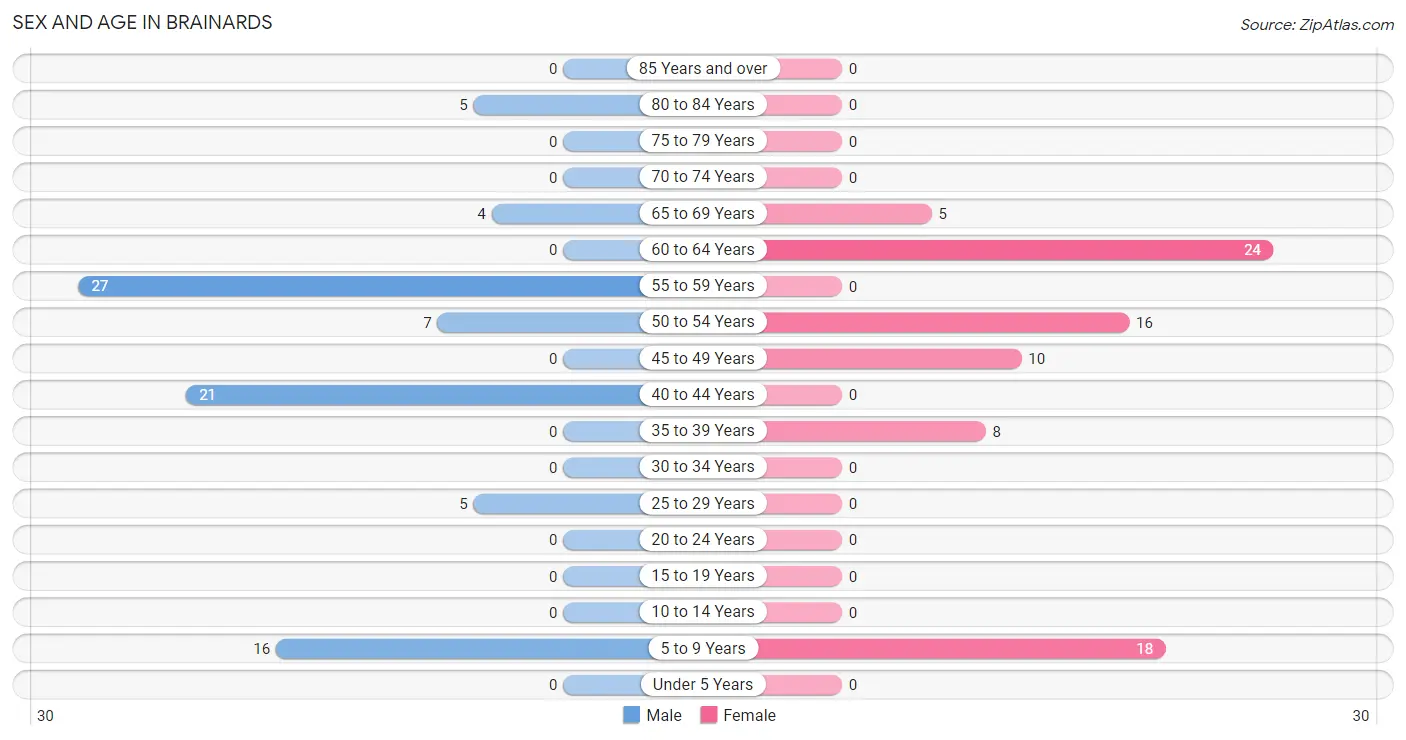
| Age Bracket | Male | Female |
| Under 5 Years | 0 (0.0%) | 0 (0.0%) |
| 5 to 9 Years | 16 (18.8%) | 18 (22.2%) |
| 10 to 14 Years | 0 (0.0%) | 0 (0.0%) |
| 15 to 19 Years | 0 (0.0%) | 0 (0.0%) |
| 20 to 24 Years | 0 (0.0%) | 0 (0.0%) |
| 25 to 29 Years | 5 (5.9%) | 0 (0.0%) |
| 30 to 34 Years | 0 (0.0%) | 0 (0.0%) |
| 35 to 39 Years | 0 (0.0%) | 8 (9.9%) |
| 40 to 44 Years | 21 (24.7%) | 0 (0.0%) |
| 45 to 49 Years | 0 (0.0%) | 10 (12.3%) |
| 50 to 54 Years | 7 (8.2%) | 16 (19.8%) |
| 55 to 59 Years | 27 (31.8%) | 0 (0.0%) |
| 60 to 64 Years | 0 (0.0%) | 24 (29.6%) |
| 65 to 69 Years | 4 (4.7%) | 5 (6.2%) |
| 70 to 74 Years | 0 (0.0%) | 0 (0.0%) |
| 75 to 79 Years | 0 (0.0%) | 0 (0.0%) |
| 80 to 84 Years | 5 (5.9%) | 0 (0.0%) |
| 85 Years and over | 0 (0.0%) | 0 (0.0%) |
| Total | 85 (100.0%) | 81 (100.0%) |
Families and Households in Brainards
Median Family Size in Brainards
The median family size in Brainards is 2.47 persons per family, with single male/father families (5 | 8.3%) accounting for the largest median family size of 3 persons per family. On the other hand, single female/mother families (16 | 26.7%) represent the smallest median family size with 1.94 persons per family.
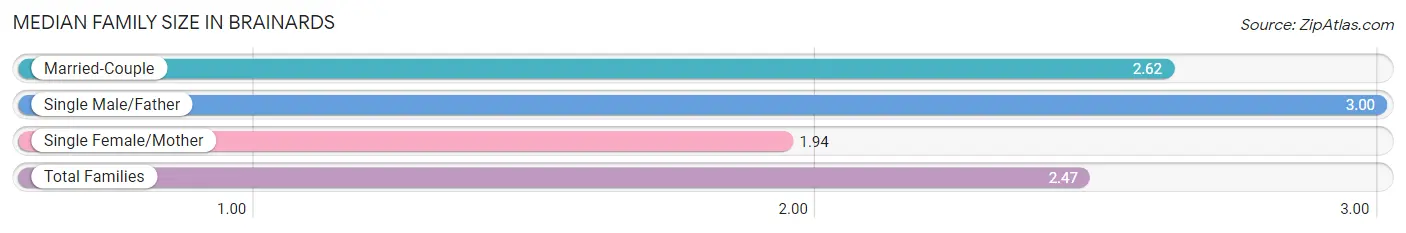
| Family Type | # Families | Family Size |
| Married-Couple | 39 (65.0%) | 2.62 |
| Single Male/Father | 5 (8.3%) | 3.00 |
| Single Female/Mother | 16 (26.7%) | 1.94 |
| Total Families | 60 (100.0%) | 2.47 |
Median Household Size in Brainards
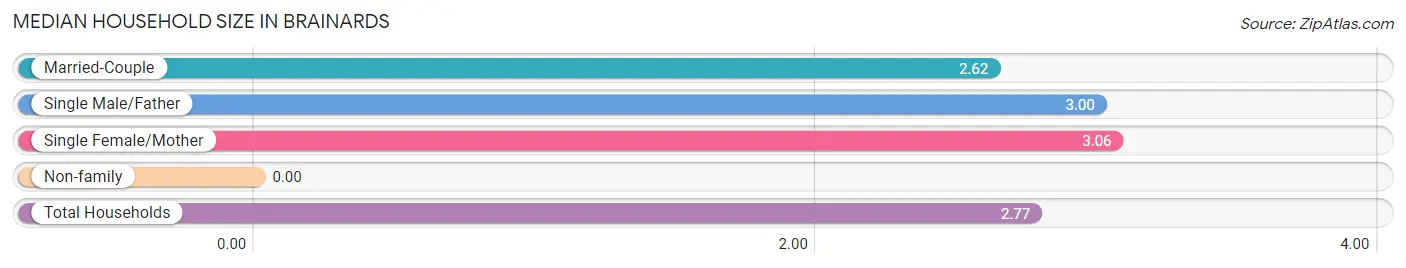
| Household Type | # Households | Household Size |
| Married-Couple | 39 (65.0%) | 2.62 |
| Single Male/Father | 5 (8.3%) | 3.00 |
| Single Female/Mother | 16 (26.7%) | 3.06 |
| Non-family | 0 (0.0%) | - |
| Total Households | 60 (100.0%) | 2.77 |
Household Size by Marriage Status in Brainards
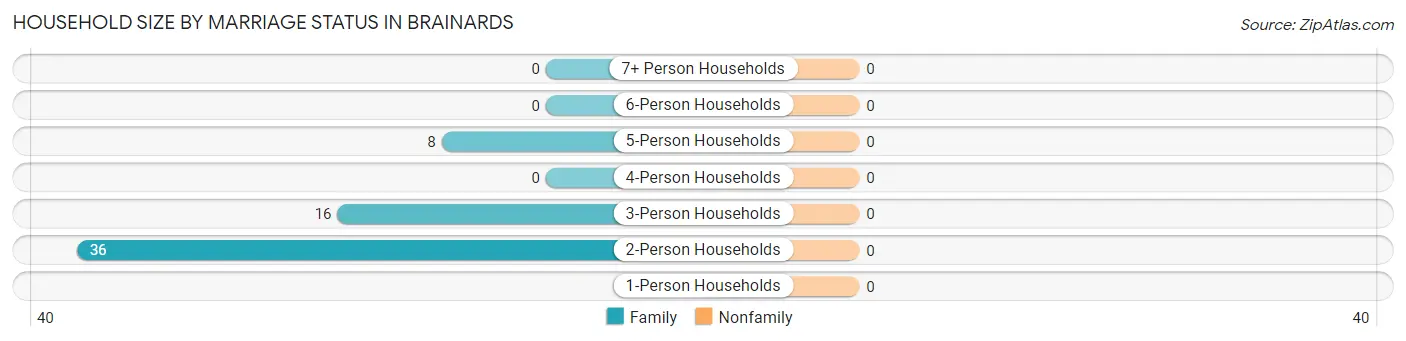
| Household Size | Family Households | Nonfamily Households |
| 1-Person Households | - | 0 (0.0%) |
| 2-Person Households | 36 (60.0%) | 0 (0.0%) |
| 3-Person Households | 16 (26.7%) | 0 (0.0%) |
| 4-Person Households | 0 (0.0%) | 0 (0.0%) |
| 5-Person Households | 8 (13.3%) | 0 (0.0%) |
| 6-Person Households | 0 (0.0%) | 0 (0.0%) |
| 7+ Person Households | 0 (0.0%) | 0 (0.0%) |
| Total | 60 (100.0%) | 0 (0.0%) |
Female Fertility in Brainards
Fertility by Age in Brainards
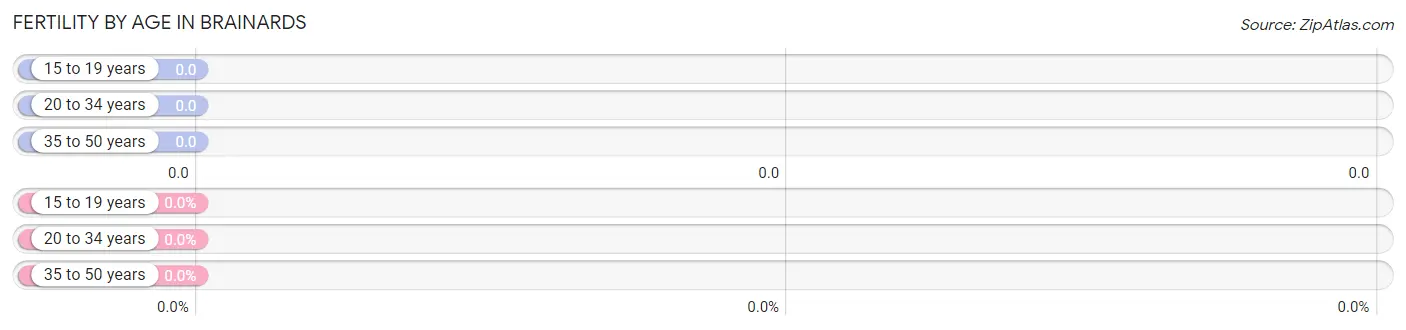
| Age Bracket | Women with Births | Births / 1,000 Women |
| 15 to 19 years | 0 (0.0%) | 0.0 |
| 20 to 34 years | 0 (0.0%) | 0.0 |
| 35 to 50 years | 0 (0.0%) | 0.0 |
| Total | 0 (0.0%) | 0.0 |
Fertility by Age by Marriage Status in Brainards
| Age Bracket | Married | Unmarried |
| 15 to 19 years | 0 (0.0%) | 0 (0.0%) |
| 20 to 34 years | 0 (0.0%) | 0 (0.0%) |
| 35 to 50 years | 0 (0.0%) | 0 (0.0%) |
| Total | 0 (0.0%) | 0 (0.0%) |
Fertility by Education in Brainards
| Educational Attainment | Women with Births | Births / 1,000 Women |
| Less than High School | 0 (0.0%) | 0.0 |
| High School Diploma | 0 (0.0%) | 0.0 |
| College or Associate's Degree | 0 (0.0%) | 0.0 |
| Bachelor's Degree | 0 (0.0%) | 0.0 |
| Graduate Degree | 0 (0.0%) | 0.0 |
| Total | 0 (0.0%) | 0.0 |
Fertility by Education by Marriage Status in Brainards
| Educational Attainment | Married | Unmarried |
| Less than High School | 0 (0.0%) | 0 (0.0%) |
| High School Diploma | 0 (0.0%) | 0 (0.0%) |
| College or Associate's Degree | 0 (0.0%) | 0 (0.0%) |
| Bachelor's Degree | 0 (0.0%) | 0 (0.0%) |
| Graduate Degree | 0 (0.0%) | 0 (0.0%) |
| Total | 0 (0.0%) | 0 (0.0%) |
Employment Characteristics in Brainards
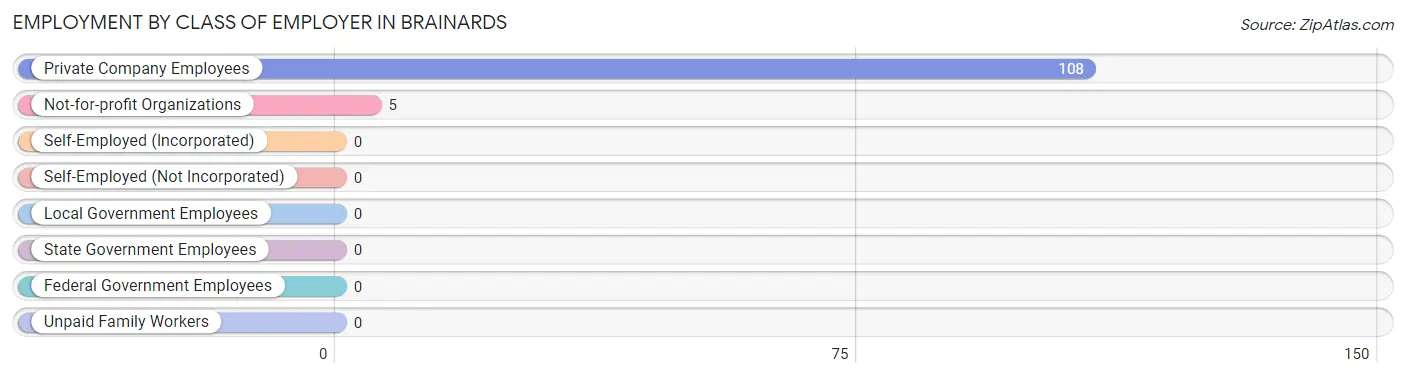
Employment by Class of Employer in Brainards
Among the 113 employed individuals in Brainards, private company employees (108 | 95.6%), and not-for-profit organizations (5 | 4.4%) make up the most common classes of employment.
| Employer Class | # Employees | % Employees |
| Private Company Employees | 108 | 95.6% |
| Self-Employed (Incorporated) | 0 | 0.0% |
| Self-Employed (Not Incorporated) | 0 | 0.0% |
| Not-for-profit Organizations | 5 | 4.4% |
| Local Government Employees | 0 | 0.0% |
| State Government Employees | 0 | 0.0% |
| Federal Government Employees | 0 | 0.0% |
| Unpaid Family Workers | 0 | 0.0% |
| Total | 113 | 100.0% |
Employment Status by Age in Brainards
According to the labor force statistics for Brainards, out of the total population over 16 years of age (132), 97.0% or 128 individuals are in the labor force, with 7.8% or 10 of them unemployed. The age group with the highest labor force participation rate is 25 to 29 years, with 100.0% or 5 individuals in the labor force. Within the labor force, the 45 to 54 years age range has the highest percentage of unemployed individuals, with 30.3% or 10 of them being unemployed.
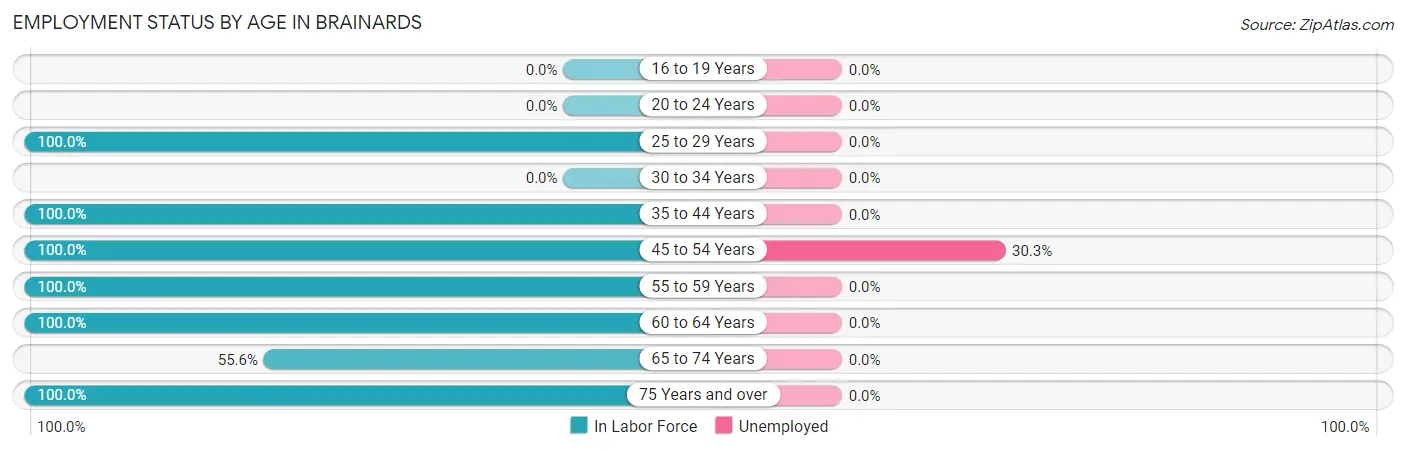
| Age Bracket | In Labor Force | Unemployed |
| 16 to 19 Years | 0 (0.0%) | 0 (0.0%) |
| 20 to 24 Years | 0 (0.0%) | 0 (0.0%) |
| 25 to 29 Years | 5 (100.0%) | 0 (0.0%) |
| 30 to 34 Years | 0 (0.0%) | 0 (0.0%) |
| 35 to 44 Years | 29 (100.0%) | 0 (0.0%) |
| 45 to 54 Years | 33 (100.0%) | 10 (30.3%) |
| 55 to 59 Years | 27 (100.0%) | 0 (0.0%) |
| 60 to 64 Years | 24 (100.0%) | 0 (0.0%) |
| 65 to 74 Years | 5 (55.6%) | 0 (0.0%) |
| 75 Years and over | 5 (100.0%) | 0 (0.0%) |
| Total | 128 (97.0%) | 10 (7.8%) |
Employment Status by Educational Attainment in Brainards
According to labor force statistics for Brainards, 100.0% of individuals (118) out of the total population between 25 and 64 years of age (118) are in the labor force, with 8.5% or 10 of them being unemployed. The group with the highest labor force participation rate are those with the educational attainment of less than high school, with 100.0% or 11 individuals in the labor force. Within the labor force, individuals with college / associate degree education have the highest percentage of unemployment, with 100.0% or 10 of them being unemployed.
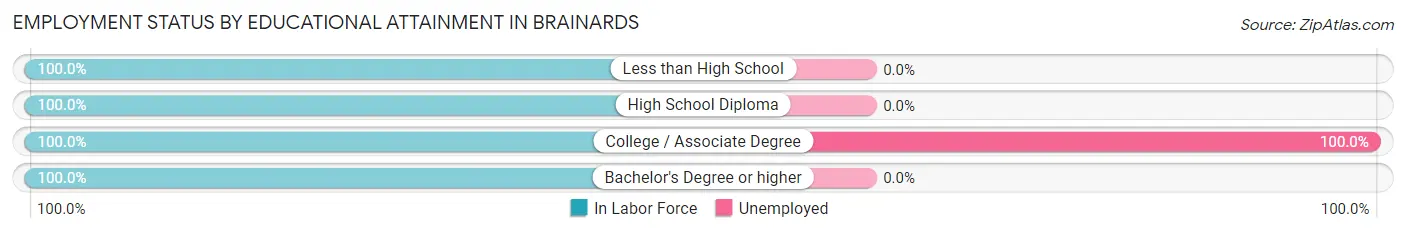
| Educational Attainment | In Labor Force | Unemployed |
| Less than High School | 11 (100.0%) | 0 (0.0%) |
| High School Diploma | 55 (100.0%) | 0 (0.0%) |
| College / Associate Degree | 10 (100.0%) | 10 (100.0%) |
| Bachelor's Degree or higher | 42 (100.0%) | 0 (0.0%) |
| Total | 118 (100.0%) | 10 (8.5%) |
Employment Occupations by Sex in Brainards
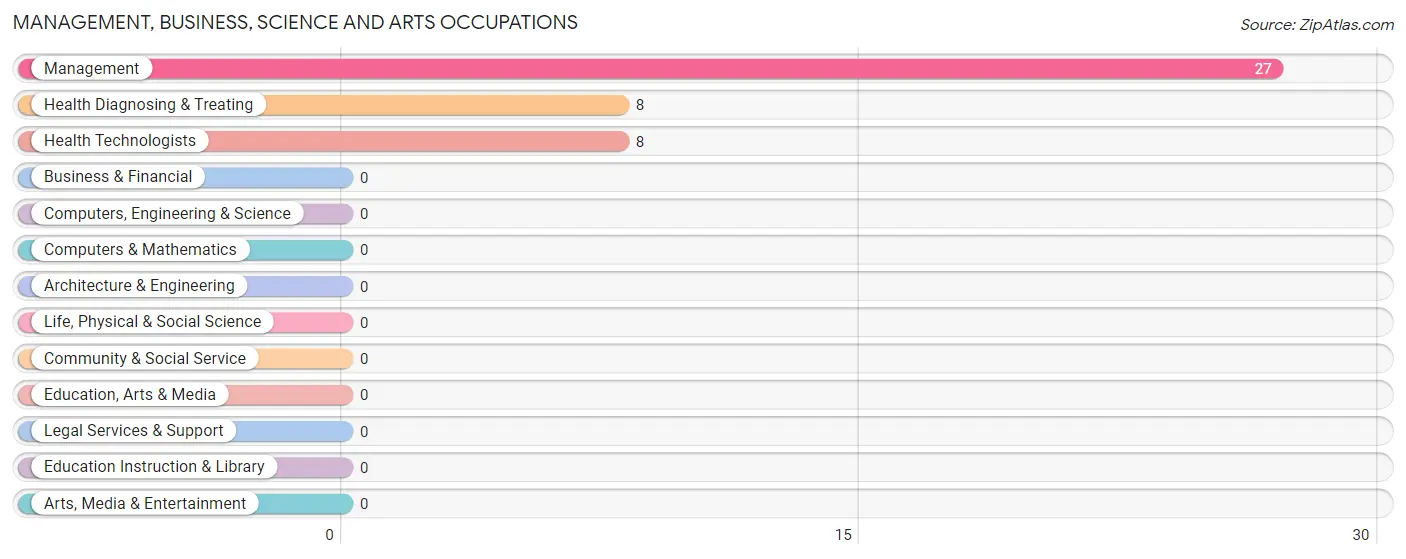
Management, Business, Science and Arts Occupations
The most common Management, Business, Science and Arts occupations in Brainards are Management (27 | 22.9%), Health Diagnosing & Treating (8 | 6.8%), and Health Technologists (8 | 6.8%).
Management, Business, Science and Arts Occupations by Sex
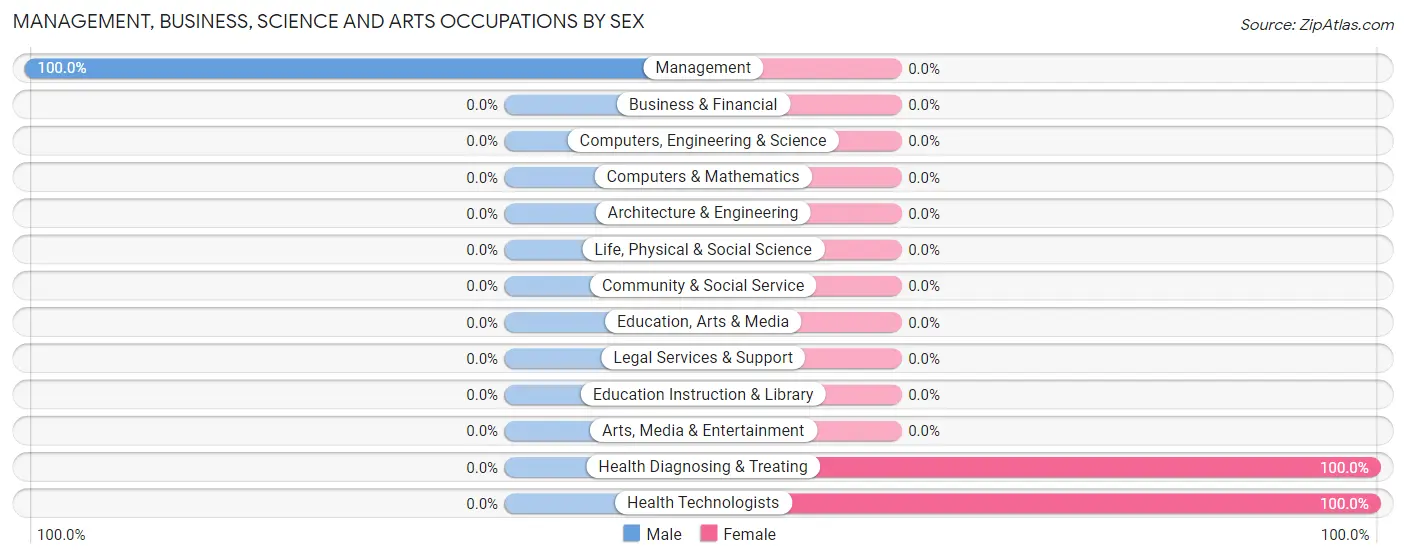
| Occupation | Male | Female |
| Management | 27 (100.0%) | 0 (0.0%) |
| Business & Financial | 0 (0.0%) | 0 (0.0%) |
| Computers, Engineering & Science | 0 (0.0%) | 0 (0.0%) |
| Computers & Mathematics | 0 (0.0%) | 0 (0.0%) |
| Architecture & Engineering | 0 (0.0%) | 0 (0.0%) |
| Life, Physical & Social Science | 0 (0.0%) | 0 (0.0%) |
| Community & Social Service | 0 (0.0%) | 0 (0.0%) |
| Education, Arts & Media | 0 (0.0%) | 0 (0.0%) |
| Legal Services & Support | 0 (0.0%) | 0 (0.0%) |
| Education Instruction & Library | 0 (0.0%) | 0 (0.0%) |
| Arts, Media & Entertainment | 0 (0.0%) | 0 (0.0%) |
| Health Diagnosing & Treating | 0 (0.0%) | 8 (100.0%) |
| Health Technologists | 0 (0.0%) | 8 (100.0%) |
| Total (Category) | 27 (77.1%) | 8 (22.9%) |
| Total (Overall) | 65 (55.1%) | 53 (44.9%) |
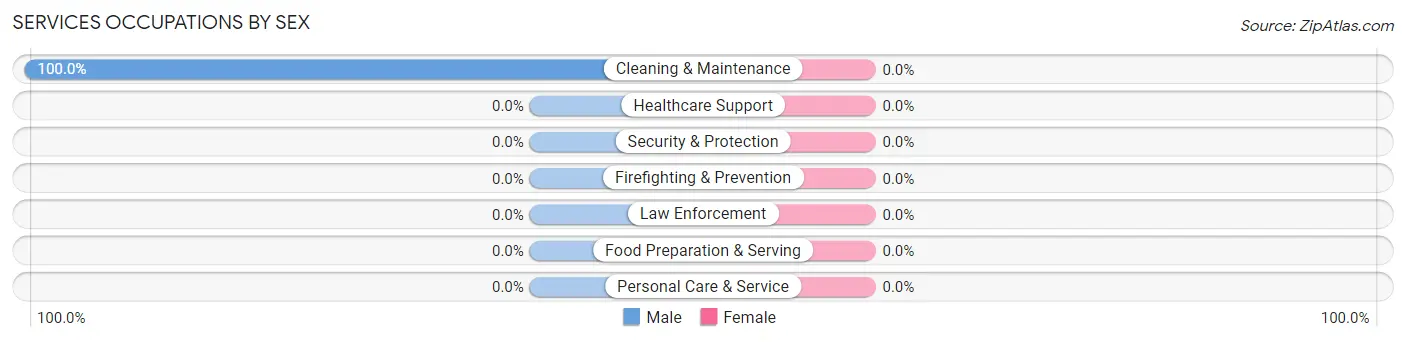
Services Occupations
The most common Services occupations in Brainards are , and Cleaning & Maintenance (5 | 4.2%).
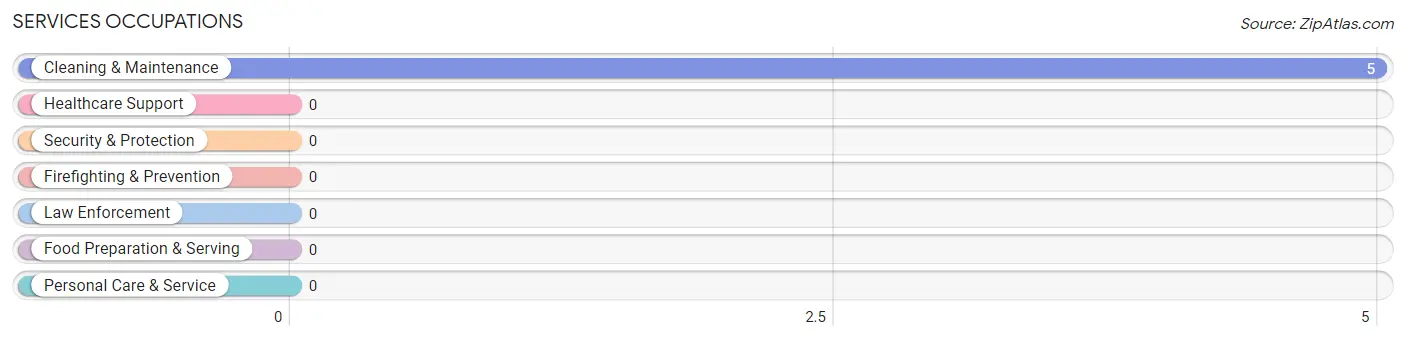
Services Occupations by Sex
| Occupation | Male | Female |
| Healthcare Support | 0 (0.0%) | 0 (0.0%) |
| Security & Protection | 0 (0.0%) | 0 (0.0%) |
| Firefighting & Prevention | 0 (0.0%) | 0 (0.0%) |
| Law Enforcement | 0 (0.0%) | 0 (0.0%) |
| Food Preparation & Serving | 0 (0.0%) | 0 (0.0%) |
| Cleaning & Maintenance | 5 (100.0%) | 0 (0.0%) |
| Personal Care & Service | 0 (0.0%) | 0 (0.0%) |
| Total (Category) | 5 (100.0%) | 0 (0.0%) |
| Total (Overall) | 65 (55.1%) | 53 (44.9%) |
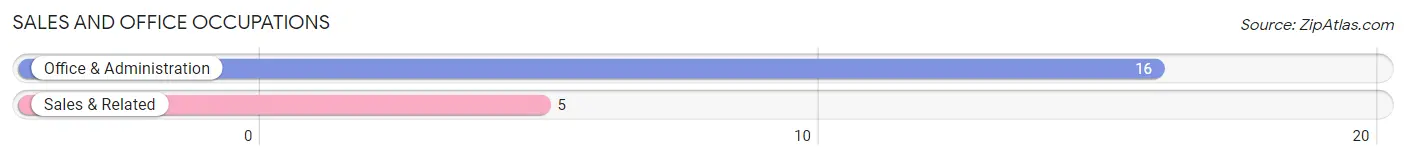
Sales and Office Occupations
The most common Sales and Office occupations in Brainards are Office & Administration (16 | 13.6%), and Sales & Related (5 | 4.2%).
Sales and Office Occupations by Sex
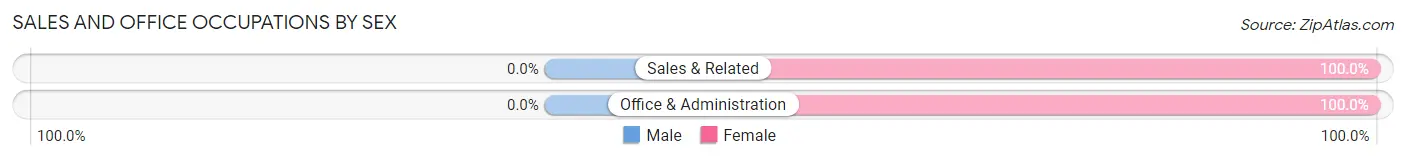
| Occupation | Male | Female |
| Sales & Related | 0 (0.0%) | 5 (100.0%) |
| Office & Administration | 0 (0.0%) | 16 (100.0%) |
| Total (Category) | 0 (0.0%) | 21 (100.0%) |
| Total (Overall) | 65 (55.1%) | 53 (44.9%) |
Natural Resources, Construction and Maintenance Occupations
The most common Natural Resources, Construction and Maintenance occupations in Brainards are , and Installation, Maintenance & Repair (26 | 22.0%).
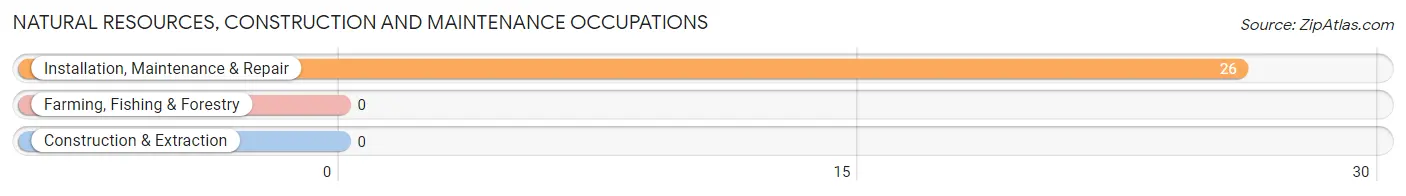
Natural Resources, Construction and Maintenance Occupations by Sex
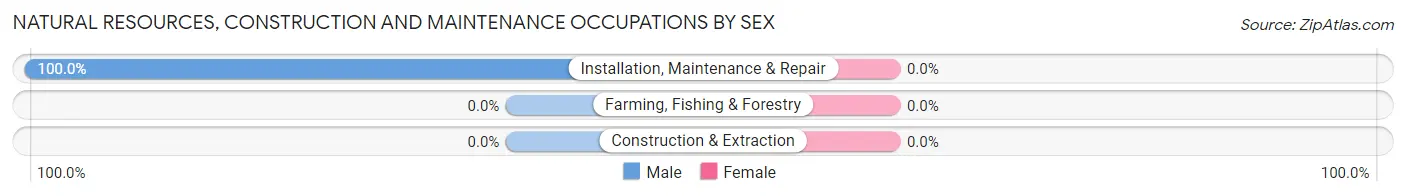
| Occupation | Male | Female |
| Farming, Fishing & Forestry | 0 (0.0%) | 0 (0.0%) |
| Construction & Extraction | 0 (0.0%) | 0 (0.0%) |
| Installation, Maintenance & Repair | 26 (100.0%) | 0 (0.0%) |
| Total (Category) | 26 (100.0%) | 0 (0.0%) |
| Total (Overall) | 65 (55.1%) | 53 (44.9%) |
Production, Transportation and Moving Occupations
The most common Production, Transportation and Moving occupations in Brainards are Transportation (24 | 20.3%), and Production (7 | 5.9%).
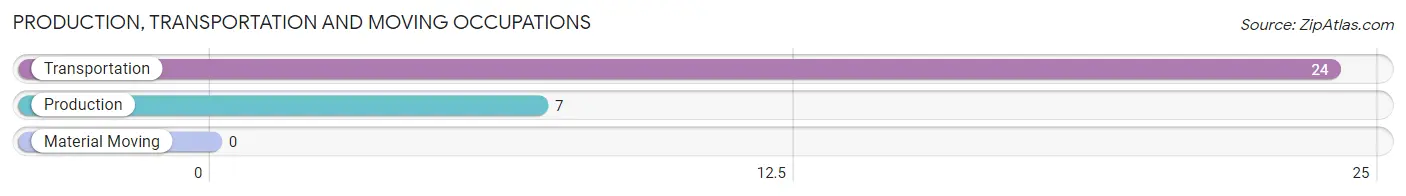
Production, Transportation and Moving Occupations by Sex
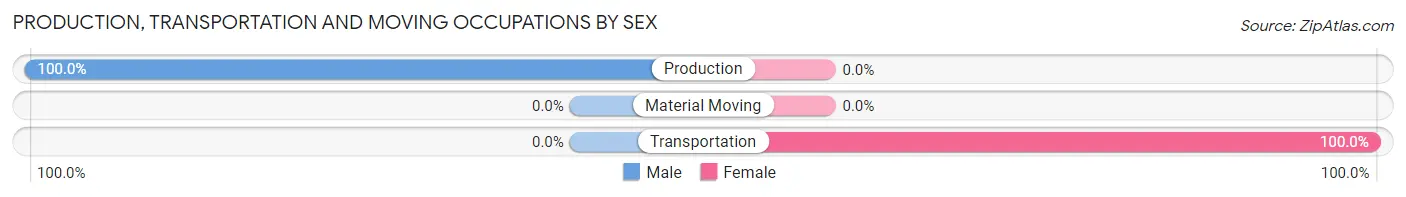
| Occupation | Male | Female |
| Production | 7 (100.0%) | 0 (0.0%) |
| Transportation | 0 (0.0%) | 24 (100.0%) |
| Material Moving | 0 (0.0%) | 0 (0.0%) |
| Total (Category) | 7 (22.6%) | 24 (77.4%) |
| Total (Overall) | 65 (55.1%) | 53 (44.9%) |
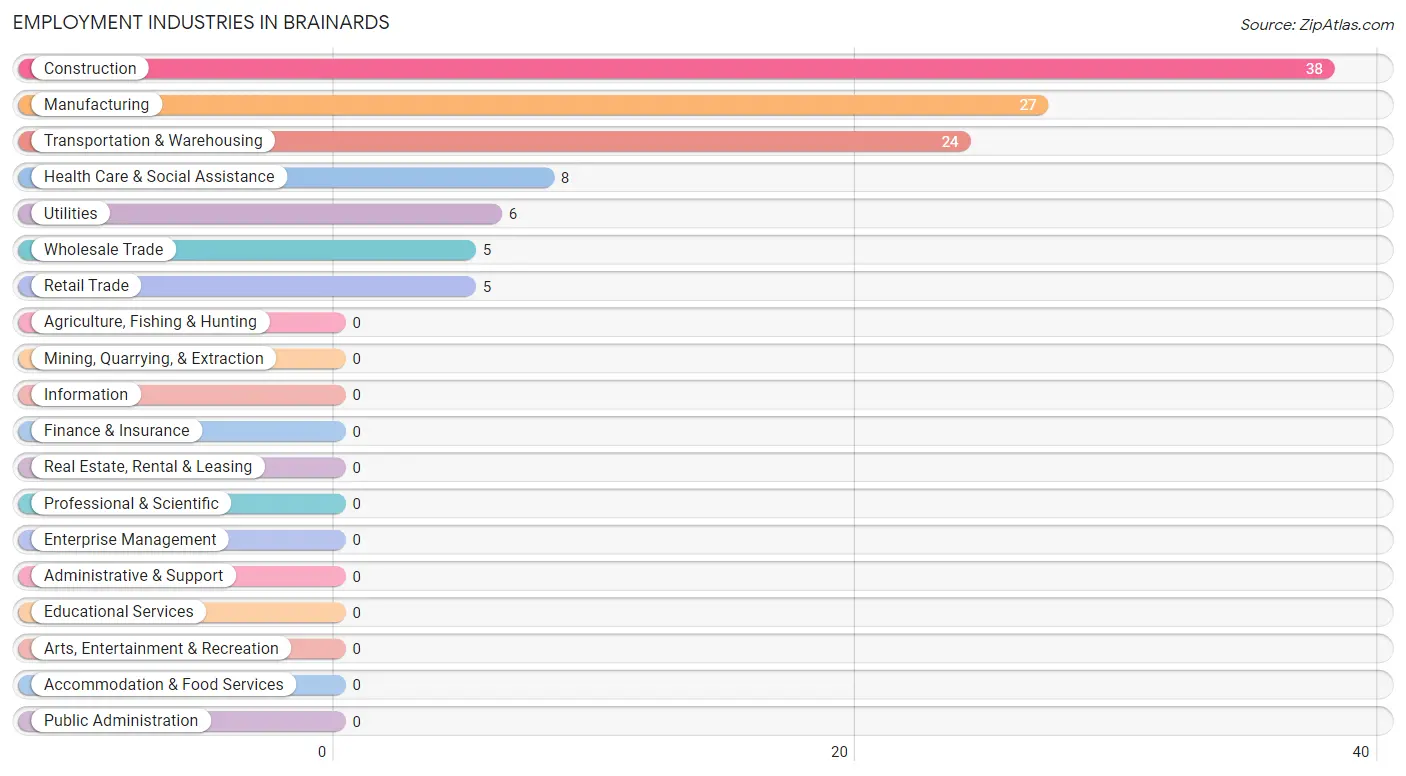
Employment Industries by Sex in Brainards
Employment Industries in Brainards
The major employment industries in Brainards include Construction (38 | 32.2%), Manufacturing (27 | 22.9%), Transportation & Warehousing (24 | 20.3%), Health Care & Social Assistance (8 | 6.8%), and Utilities (6 | 5.1%).
Employment Industries by Sex in Brainards
The Brainards industries that see more men than women are Construction (100.0%), Wholesale Trade (100.0%), and Manufacturing (63.0%), whereas the industries that tend to have a higher number of women are Retail Trade (100.0%), Transportation & Warehousing (100.0%), and Utilities (100.0%).
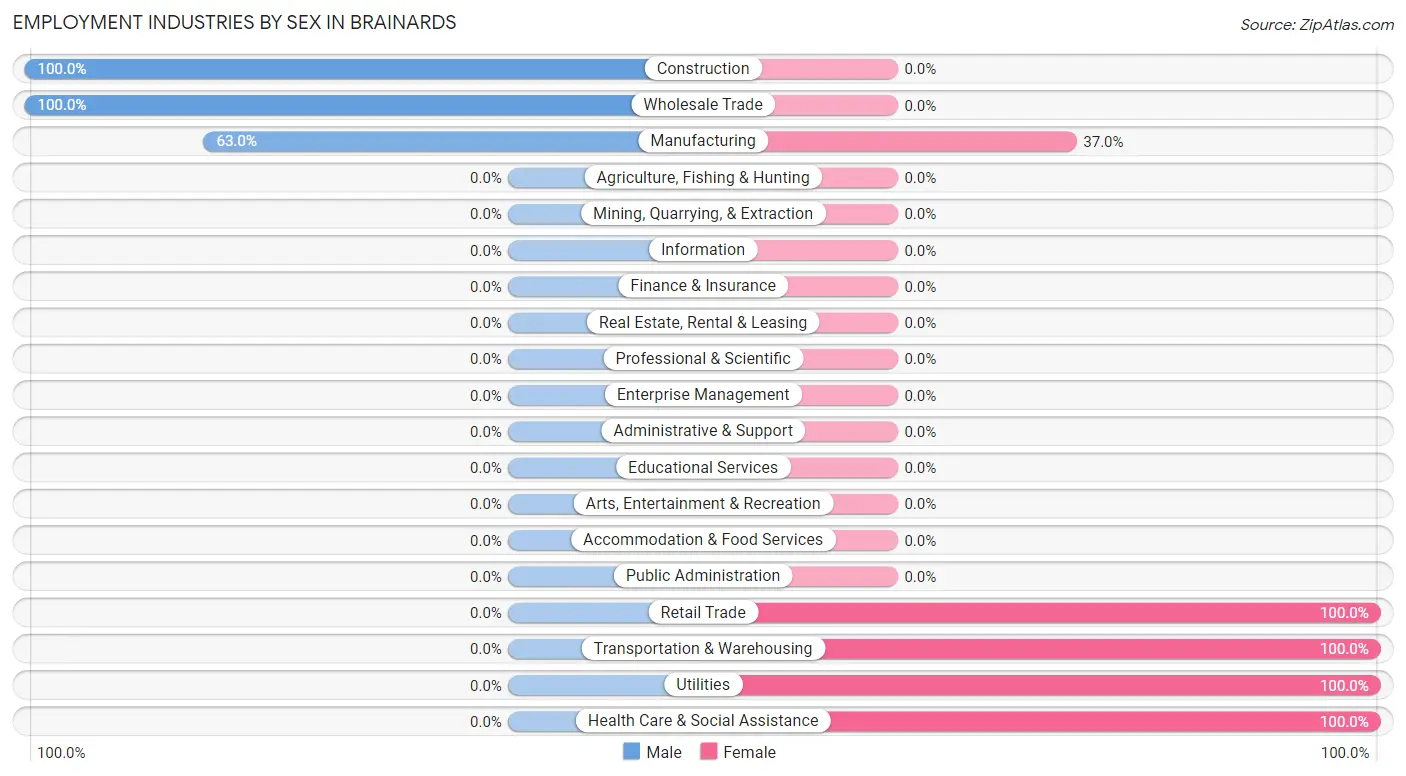
| Industry | Male | Female |
| Agriculture, Fishing & Hunting | 0 (0.0%) | 0 (0.0%) |
| Mining, Quarrying, & Extraction | 0 (0.0%) | 0 (0.0%) |
| Construction | 38 (100.0%) | 0 (0.0%) |
| Manufacturing | 17 (63.0%) | 10 (37.0%) |
| Wholesale Trade | 5 (100.0%) | 0 (0.0%) |
| Retail Trade | 0 (0.0%) | 5 (100.0%) |
| Transportation & Warehousing | 0 (0.0%) | 24 (100.0%) |
| Utilities | 0 (0.0%) | 6 (100.0%) |
| Information | 0 (0.0%) | 0 (0.0%) |
| Finance & Insurance | 0 (0.0%) | 0 (0.0%) |
| Real Estate, Rental & Leasing | 0 (0.0%) | 0 (0.0%) |
| Professional & Scientific | 0 (0.0%) | 0 (0.0%) |
| Enterprise Management | 0 (0.0%) | 0 (0.0%) |
| Administrative & Support | 0 (0.0%) | 0 (0.0%) |
| Educational Services | 0 (0.0%) | 0 (0.0%) |
| Health Care & Social Assistance | 0 (0.0%) | 8 (100.0%) |
| Arts, Entertainment & Recreation | 0 (0.0%) | 0 (0.0%) |
| Accommodation & Food Services | 0 (0.0%) | 0 (0.0%) |
| Public Administration | 0 (0.0%) | 0 (0.0%) |
| Total | 65 (55.1%) | 53 (44.9%) |
Education in Brainards
School Enrollment in Brainards
The most common levels of schooling among the 34 students in Brainards are elementary school (26 | 76.5%), and nursery / preschool (8 | 23.5%).
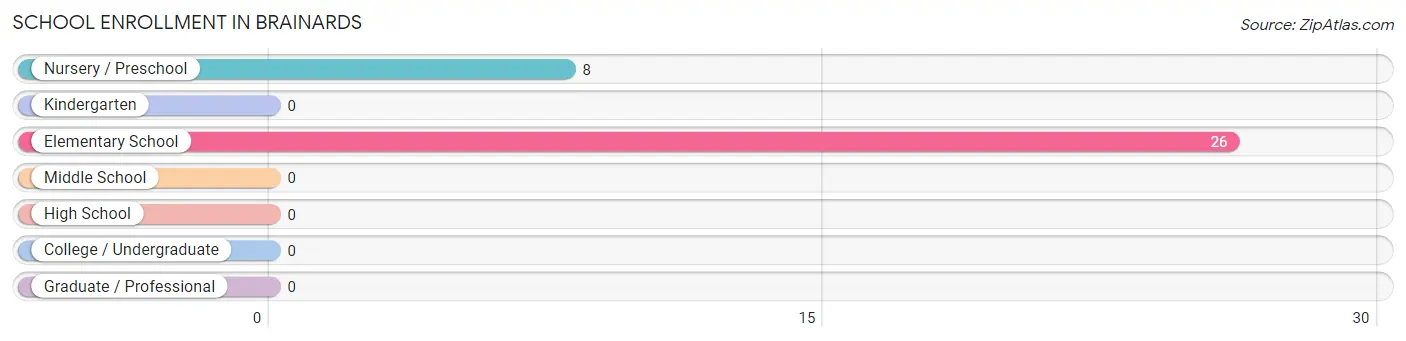
| School Level | # Students | % Students |
| Nursery / Preschool | 8 | 23.5% |
| Kindergarten | 0 | 0.0% |
| Elementary School | 26 | 76.5% |
| Middle School | 0 | 0.0% |
| High School | 0 | 0.0% |
| College / Undergraduate | 0 | 0.0% |
| Graduate / Professional | 0 | 0.0% |
| Total | 34 | 100.0% |
School Enrollment by Age by Funding Source in Brainards
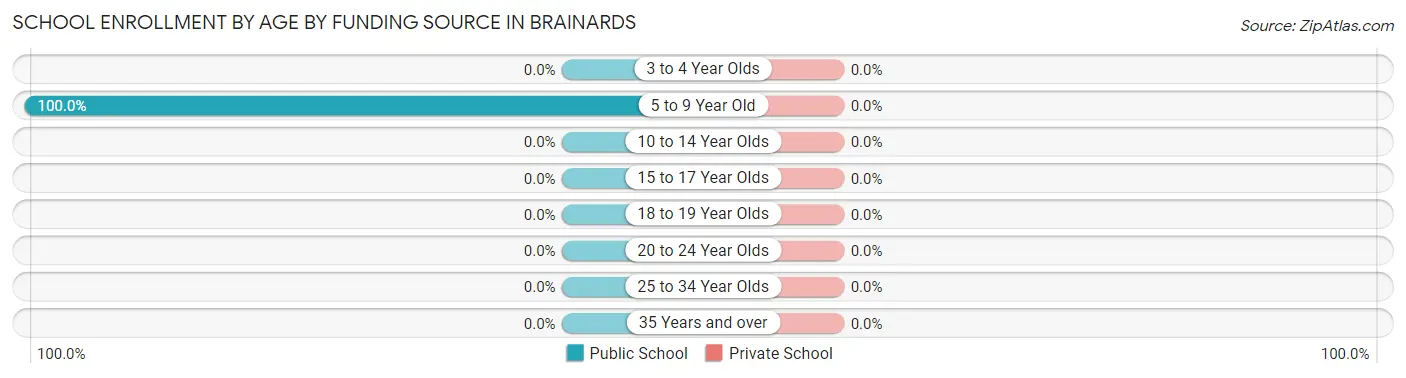
| Age Bracket | Public School | Private School |
| 3 to 4 Year Olds | 0 (0.0%) | 0 (0.0%) |
| 5 to 9 Year Old | 34 (100.0%) | 0 (0.0%) |
| 10 to 14 Year Olds | 0 (0.0%) | 0 (0.0%) |
| 15 to 17 Year Olds | 0 (0.0%) | 0 (0.0%) |
| 18 to 19 Year Olds | 0 (0.0%) | 0 (0.0%) |
| 20 to 24 Year Olds | 0 (0.0%) | 0 (0.0%) |
| 25 to 34 Year Olds | 0 (0.0%) | 0 (0.0%) |
| 35 Years and over | 0 (0.0%) | 0 (0.0%) |
| Total | 34 (100.0%) | 0 (0.0%) |
Educational Attainment by Field of Study in Brainards
Education (24 | 48.0%), engineering (10 | 20.0%), multidisciplinary studies (8 | 16.0%), and science & technology (8 | 16.0%) are the most common fields of study among 50 individuals in Brainards who have obtained a bachelor's degree or higher.
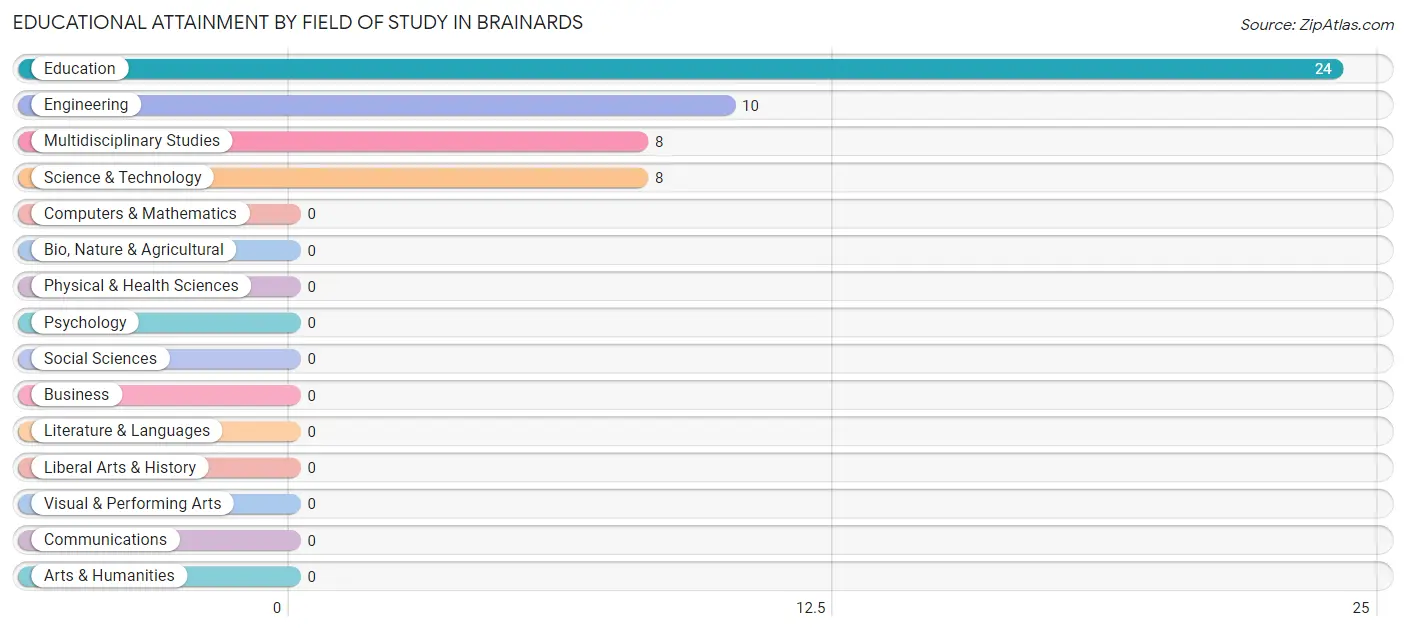
| Field of Study | # Graduates | % Graduates |
| Computers & Mathematics | 0 | 0.0% |
| Bio, Nature & Agricultural | 0 | 0.0% |
| Physical & Health Sciences | 0 | 0.0% |
| Psychology | 0 | 0.0% |
| Social Sciences | 0 | 0.0% |
| Engineering | 10 | 20.0% |
| Multidisciplinary Studies | 8 | 16.0% |
| Science & Technology | 8 | 16.0% |
| Business | 0 | 0.0% |
| Education | 24 | 48.0% |
| Literature & Languages | 0 | 0.0% |
| Liberal Arts & History | 0 | 0.0% |
| Visual & Performing Arts | 0 | 0.0% |
| Communications | 0 | 0.0% |
| Arts & Humanities | 0 | 0.0% |
| Total | 50 | 100.0% |
Transportation & Commute in Brainards
Vehicle Availability by Sex in Brainards
The most prevalent vehicle ownership categories in Brainards are males with 1 vehicle (27, accounting for 41.5%) and females with 1 vehicle (24, making up 56.2%).
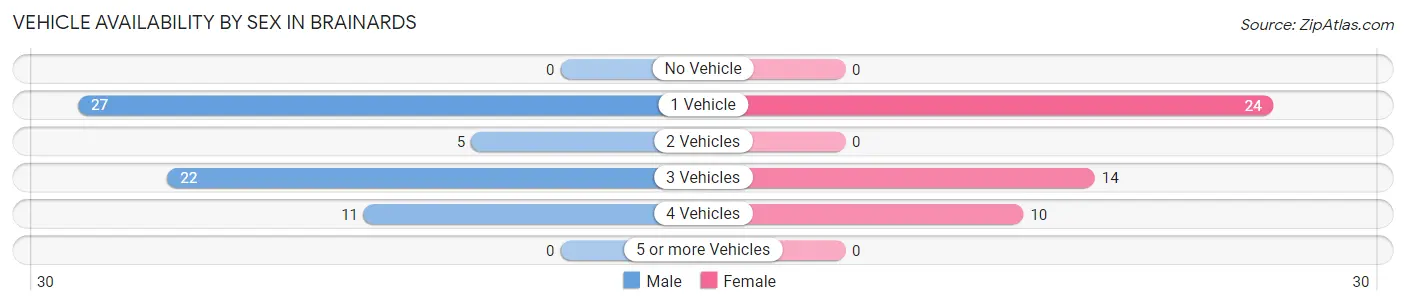
| Vehicles Available | Male | Female |
| No Vehicle | 0 (0.0%) | 0 (0.0%) |
| 1 Vehicle | 27 (41.5%) | 24 (50.0%) |
| 2 Vehicles | 5 (7.7%) | 0 (0.0%) |
| 3 Vehicles | 22 (33.9%) | 14 (29.2%) |
| 4 Vehicles | 11 (16.9%) | 10 (20.8%) |
| 5 or more Vehicles | 0 (0.0%) | 0 (0.0%) |
| Total | 65 (100.0%) | 48 (100.0%) |
Commute Time in Brainards
The most frequently occuring commute durations in Brainards are 45 to 59 minutes (37 commuters, 32.7%), 15 to 19 minutes (29 commuters, 25.7%), and 60 to 89 minutes (13 commuters, 11.5%).
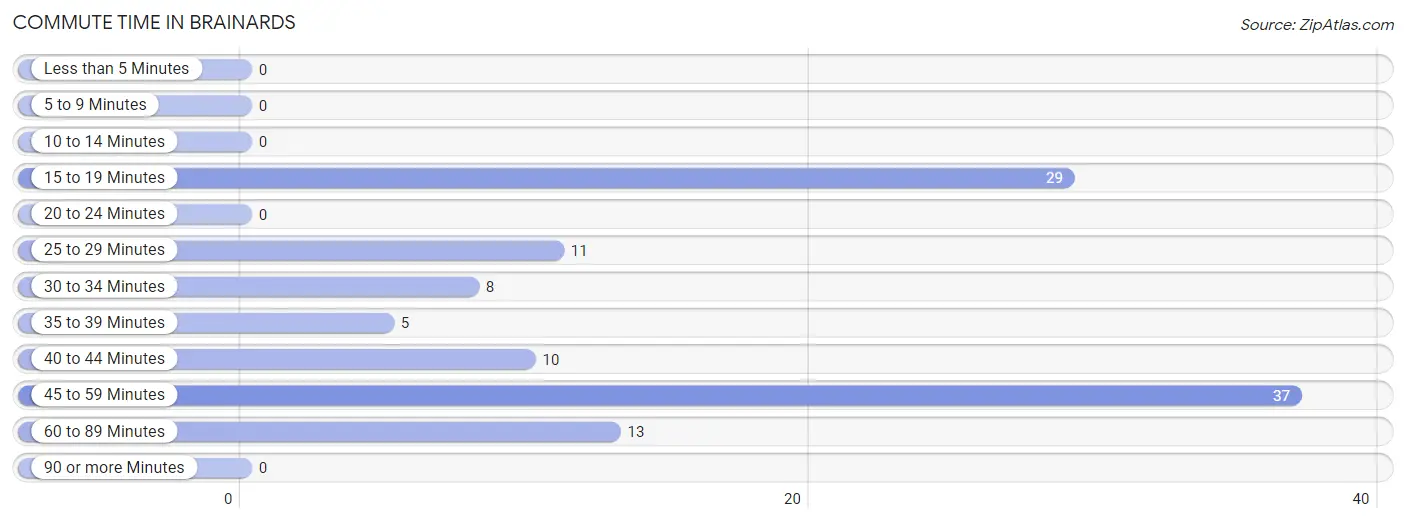
| Commute Time | # Commuters | % Commuters |
| Less than 5 Minutes | 0 | 0.0% |
| 5 to 9 Minutes | 0 | 0.0% |
| 10 to 14 Minutes | 0 | 0.0% |
| 15 to 19 Minutes | 29 | 25.7% |
| 20 to 24 Minutes | 0 | 0.0% |
| 25 to 29 Minutes | 11 | 9.7% |
| 30 to 34 Minutes | 8 | 7.1% |
| 35 to 39 Minutes | 5 | 4.4% |
| 40 to 44 Minutes | 10 | 8.8% |
| 45 to 59 Minutes | 37 | 32.7% |
| 60 to 89 Minutes | 13 | 11.5% |
| 90 or more Minutes | 0 | 0.0% |
Commute Time by Sex in Brainards
The most common commute times in Brainards are 45 to 59 minutes (37 commuters, 56.9%) for males and 15 to 19 minutes (24 commuters, 50.0%) for females.
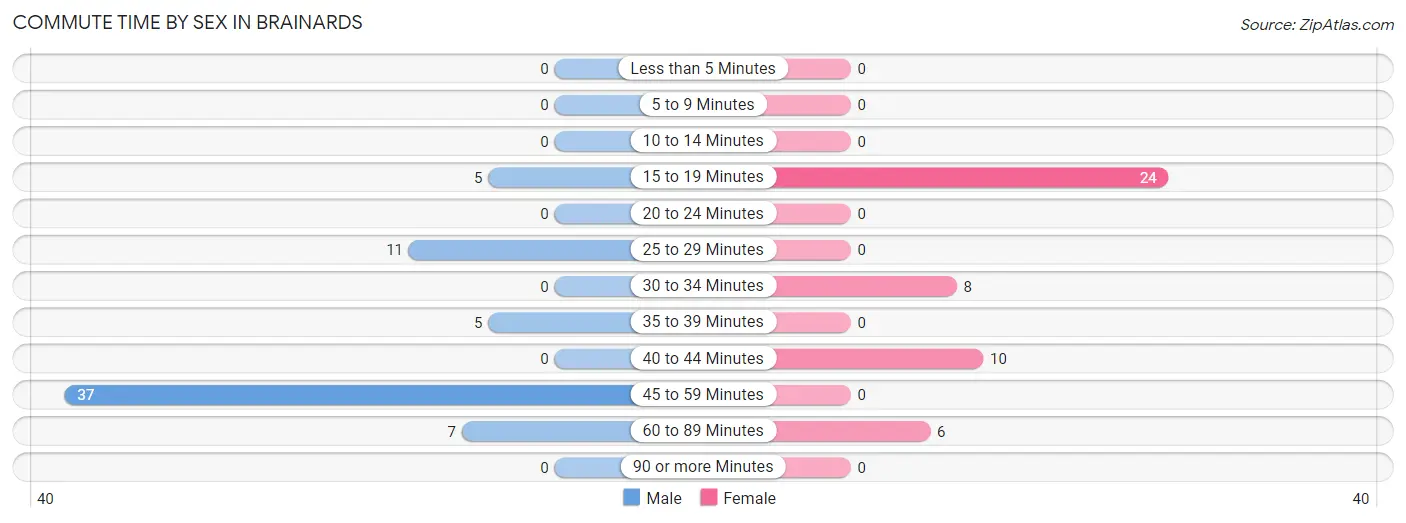
| Commute Time | Male | Female |
| Less than 5 Minutes | 0 (0.0%) | 0 (0.0%) |
| 5 to 9 Minutes | 0 (0.0%) | 0 (0.0%) |
| 10 to 14 Minutes | 0 (0.0%) | 0 (0.0%) |
| 15 to 19 Minutes | 5 (7.7%) | 24 (50.0%) |
| 20 to 24 Minutes | 0 (0.0%) | 0 (0.0%) |
| 25 to 29 Minutes | 11 (16.9%) | 0 (0.0%) |
| 30 to 34 Minutes | 0 (0.0%) | 8 (16.7%) |
| 35 to 39 Minutes | 5 (7.7%) | 0 (0.0%) |
| 40 to 44 Minutes | 0 (0.0%) | 10 (20.8%) |
| 45 to 59 Minutes | 37 (56.9%) | 0 (0.0%) |
| 60 to 89 Minutes | 7 (10.8%) | 6 (12.5%) |
| 90 or more Minutes | 0 (0.0%) | 0 (0.0%) |
Time of Departure to Work by Sex in Brainards
The most frequent times of departure to work in Brainards are 12:00 AM to 4:59 AM (27, 41.5%) for males and 4:00 PM to 11:59 PM (24, 50.0%) for females.
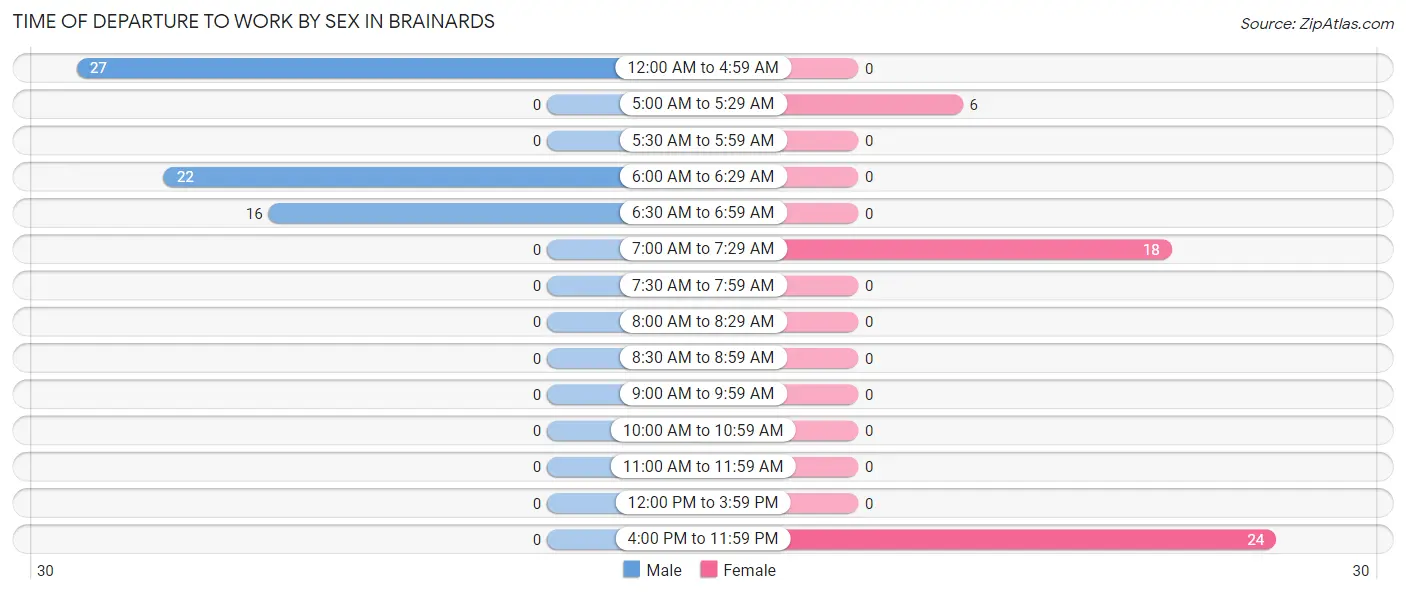
| Time of Departure | Male | Female |
| 12:00 AM to 4:59 AM | 27 (41.5%) | 0 (0.0%) |
| 5:00 AM to 5:29 AM | 0 (0.0%) | 6 (12.5%) |
| 5:30 AM to 5:59 AM | 0 (0.0%) | 0 (0.0%) |
| 6:00 AM to 6:29 AM | 22 (33.9%) | 0 (0.0%) |
| 6:30 AM to 6:59 AM | 16 (24.6%) | 0 (0.0%) |
| 7:00 AM to 7:29 AM | 0 (0.0%) | 18 (37.5%) |
| 7:30 AM to 7:59 AM | 0 (0.0%) | 0 (0.0%) |
| 8:00 AM to 8:29 AM | 0 (0.0%) | 0 (0.0%) |
| 8:30 AM to 8:59 AM | 0 (0.0%) | 0 (0.0%) |
| 9:00 AM to 9:59 AM | 0 (0.0%) | 0 (0.0%) |
| 10:00 AM to 10:59 AM | 0 (0.0%) | 0 (0.0%) |
| 11:00 AM to 11:59 AM | 0 (0.0%) | 0 (0.0%) |
| 12:00 PM to 3:59 PM | 0 (0.0%) | 0 (0.0%) |
| 4:00 PM to 11:59 PM | 0 (0.0%) | 24 (50.0%) |
| Total | 65 (100.0%) | 48 (100.0%) |
Housing Occupancy in Brainards
Occupancy by Ownership in Brainards
Of the total 60 dwellings in Brainards, owner-occupied units account for 47 (78.3%), while renter-occupied units make up 13 (21.7%).
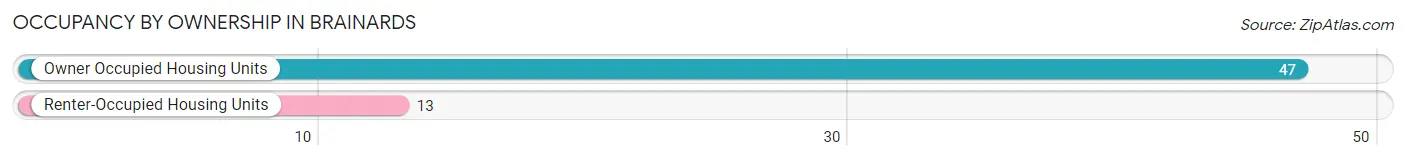
| Occupancy | # Housing Units | % Housing Units |
| Owner Occupied Housing Units | 47 | 78.3% |
| Renter-Occupied Housing Units | 13 | 21.7% |
| Total Occupied Housing Units | 60 | 100.0% |
Occupancy by Household Size in Brainards
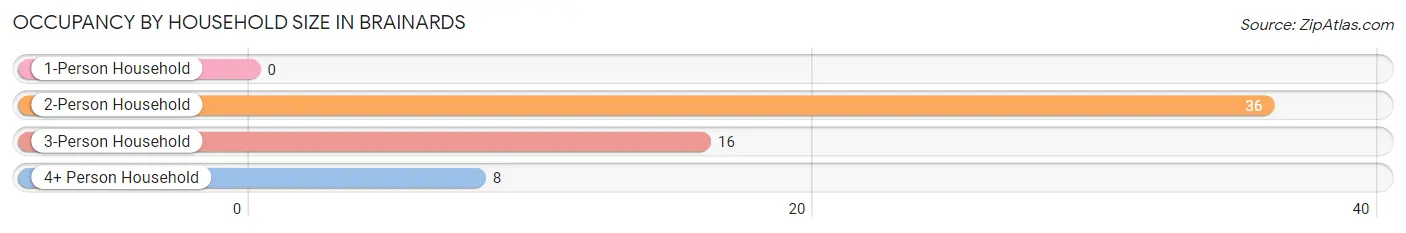
| Household Size | # Housing Units | % Housing Units |
| 1-Person Household | 0 | 0.0% |
| 2-Person Household | 36 | 60.0% |
| 3-Person Household | 16 | 26.7% |
| 4+ Person Household | 8 | 13.3% |
| Total Housing Units | 60 | 100.0% |
Occupancy by Ownership by Household Size in Brainards
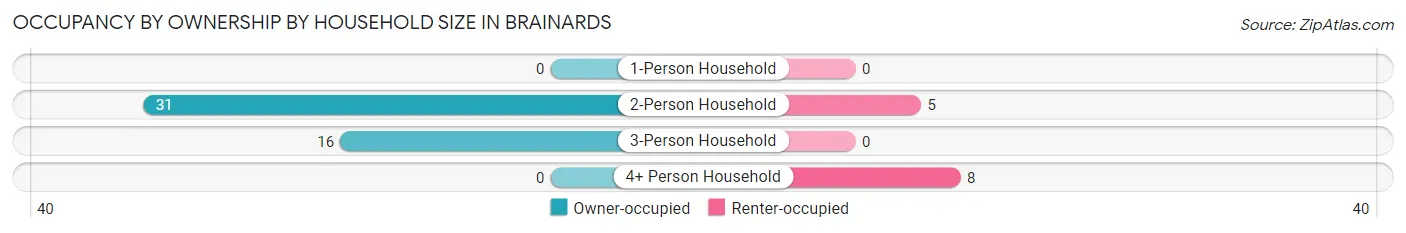
| Household Size | Owner-occupied | Renter-occupied |
| 1-Person Household | 0 (0.0%) | 0 (0.0%) |
| 2-Person Household | 31 (86.1%) | 5 (13.9%) |
| 3-Person Household | 16 (100.0%) | 0 (0.0%) |
| 4+ Person Household | 0 (0.0%) | 8 (100.0%) |
| Total Housing Units | 47 (78.3%) | 13 (21.7%) |
Occupancy by Educational Attainment in Brainards
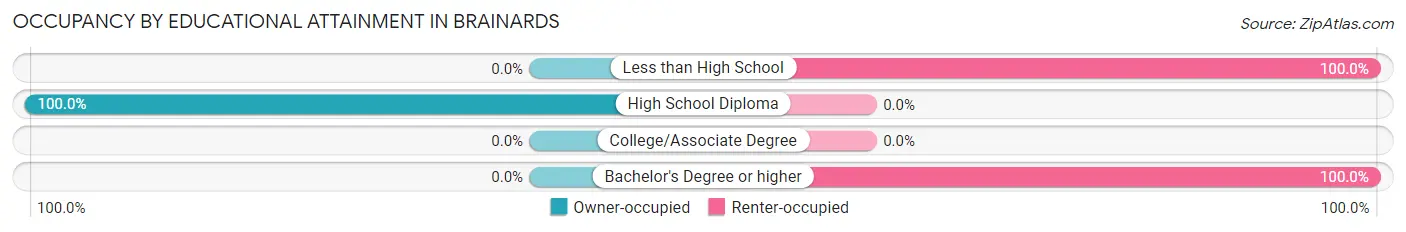
| Household Size | Owner-occupied | Renter-occupied |
| Less than High School | 0 (0.0%) | 5 (100.0%) |
| High School Diploma | 47 (100.0%) | 0 (0.0%) |
| College/Associate Degree | 0 (0.0%) | 0 (0.0%) |
| Bachelor's Degree or higher | 0 (0.0%) | 8 (100.0%) |
Occupancy by Age of Householder in Brainards
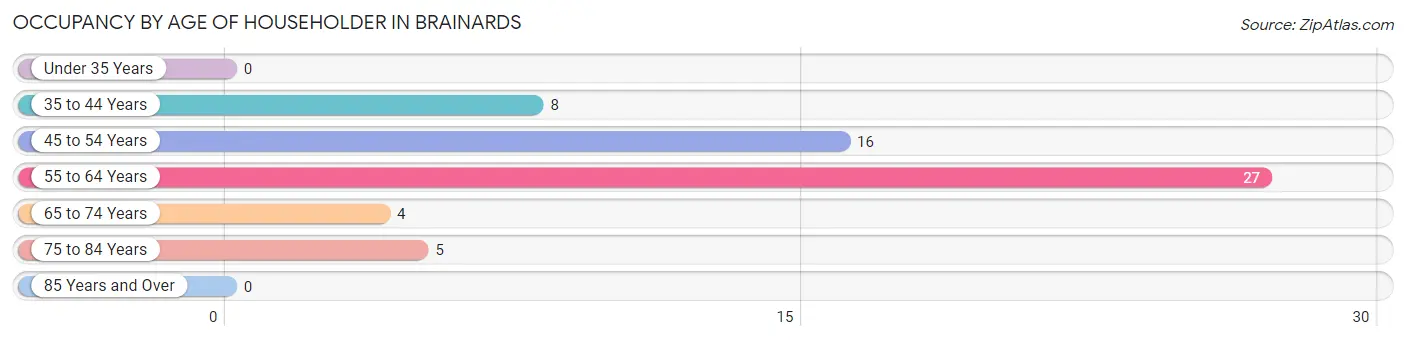
| Age Bracket | # Households | % Households |
| Under 35 Years | 0 | 0.0% |
| 35 to 44 Years | 8 | 13.3% |
| 45 to 54 Years | 16 | 26.7% |
| 55 to 64 Years | 27 | 45.0% |
| 65 to 74 Years | 4 | 6.7% |
| 75 to 84 Years | 5 | 8.3% |
| 85 Years and Over | 0 | 0.0% |
| Total | 60 | 100.0% |
Housing Finances in Brainards
Median Income by Occupancy in Brainards
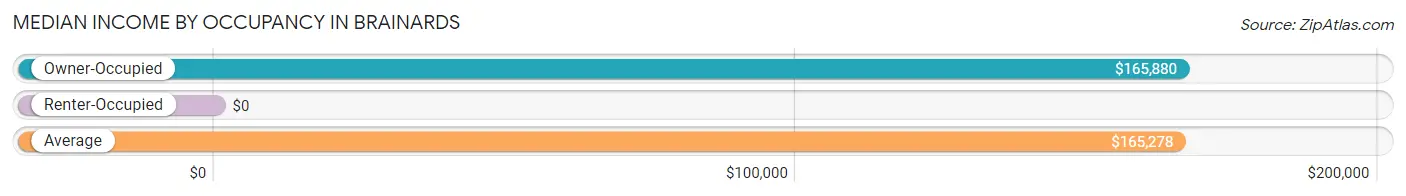
| Occupancy Type | # Households | Median Income |
| Owner-Occupied | 47 (78.3%) | $165,880 |
| Renter-Occupied | 13 (21.7%) | $0 |
| Average | 60 (100.0%) | $165,278 |
Occupancy by Householder Income Bracket in Brainards
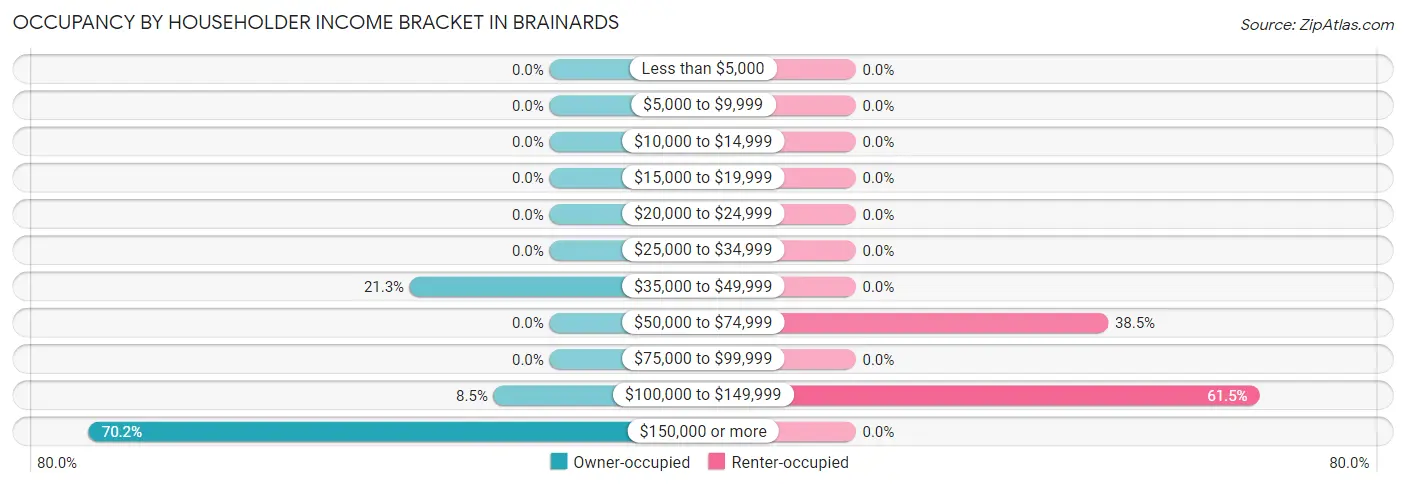
| Income Bracket | Owner-occupied | Renter-occupied |
| Less than $5,000 | 0 (0.0%) | 0 (0.0%) |
| $5,000 to $9,999 | 0 (0.0%) | 0 (0.0%) |
| $10,000 to $14,999 | 0 (0.0%) | 0 (0.0%) |
| $15,000 to $19,999 | 0 (0.0%) | 0 (0.0%) |
| $20,000 to $24,999 | 0 (0.0%) | 0 (0.0%) |
| $25,000 to $34,999 | 0 (0.0%) | 0 (0.0%) |
| $35,000 to $49,999 | 10 (21.3%) | 0 (0.0%) |
| $50,000 to $74,999 | 0 (0.0%) | 5 (38.5%) |
| $75,000 to $99,999 | 0 (0.0%) | 0 (0.0%) |
| $100,000 to $149,999 | 4 (8.5%) | 8 (61.5%) |
| $150,000 or more | 33 (70.2%) | 0 (0.0%) |
| Total | 47 (100.0%) | 13 (100.0%) |
Monthly Housing Cost Tiers in Brainards
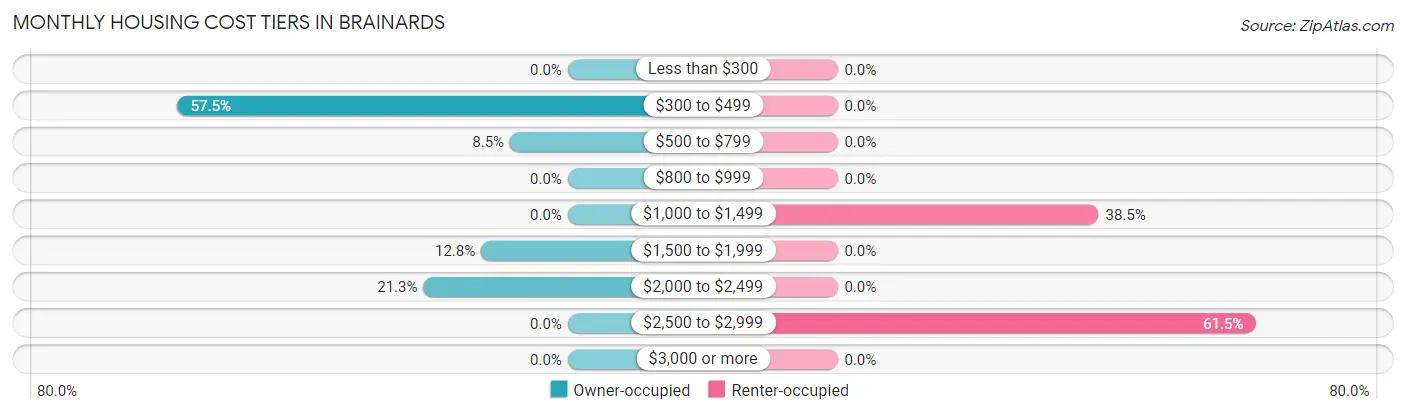
| Monthly Cost | Owner-occupied | Renter-occupied |
| Less than $300 | 0 (0.0%) | 0 (0.0%) |
| $300 to $499 | 27 (57.5%) | 0 (0.0%) |
| $500 to $799 | 4 (8.5%) | 0 (0.0%) |
| $800 to $999 | 0 (0.0%) | 0 (0.0%) |
| $1,000 to $1,499 | 0 (0.0%) | 5 (38.5%) |
| $1,500 to $1,999 | 6 (12.8%) | 0 (0.0%) |
| $2,000 to $2,499 | 10 (21.3%) | 0 (0.0%) |
| $2,500 to $2,999 | 0 (0.0%) | 8 (61.5%) |
| $3,000 or more | 0 (0.0%) | 0 (0.0%) |
| Total | 47 (100.0%) | 13 (100.0%) |
Physical Housing Characteristics in Brainards
Housing Structures in Brainards
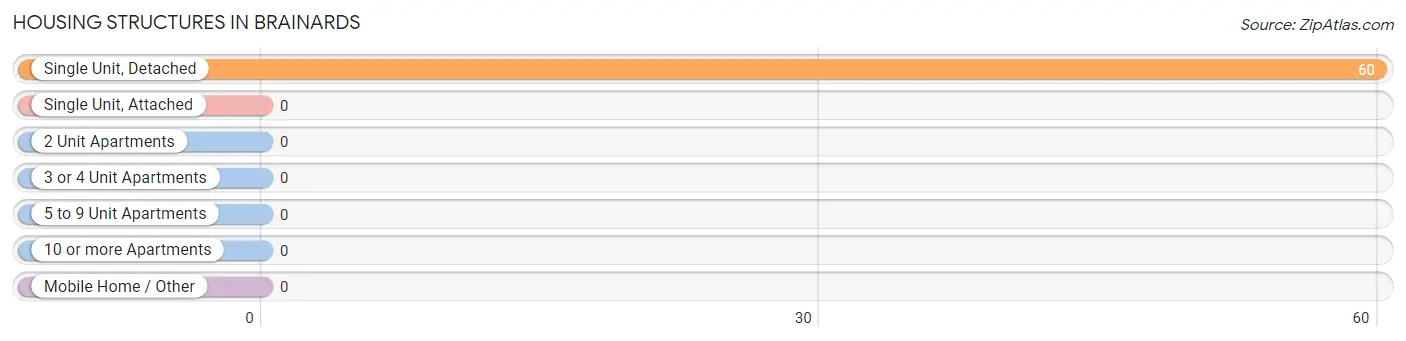
| Structure Type | # Housing Units | % Housing Units |
| Single Unit, Detached | 60 | 100.0% |
| Single Unit, Attached | 0 | 0.0% |
| 2 Unit Apartments | 0 | 0.0% |
| 3 or 4 Unit Apartments | 0 | 0.0% |
| 5 to 9 Unit Apartments | 0 | 0.0% |
| 10 or more Apartments | 0 | 0.0% |
| Mobile Home / Other | 0 | 0.0% |
| Total | 60 | 100.0% |
Housing Structures by Occupancy in Brainards
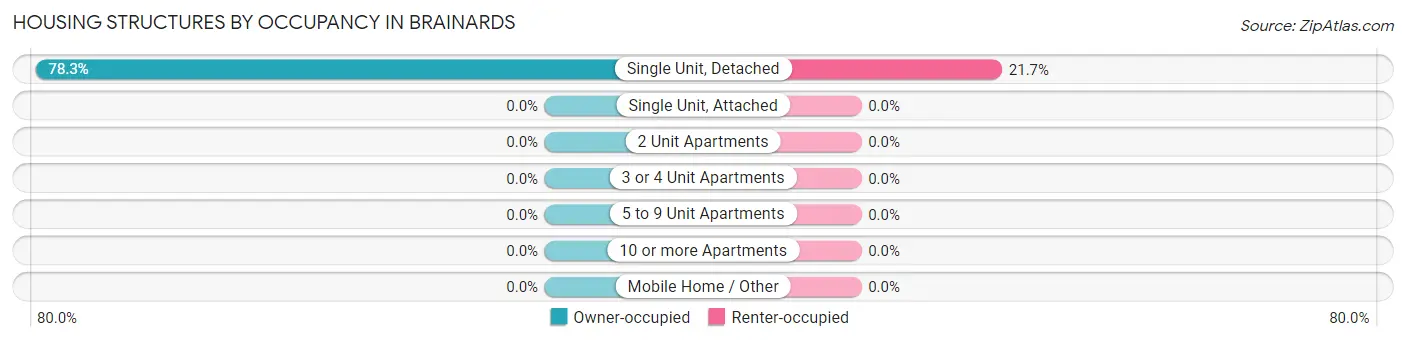
| Structure Type | Owner-occupied | Renter-occupied |
| Single Unit, Detached | 47 (78.3%) | 13 (21.7%) |
| Single Unit, Attached | 0 (0.0%) | 0 (0.0%) |
| 2 Unit Apartments | 0 (0.0%) | 0 (0.0%) |
| 3 or 4 Unit Apartments | 0 (0.0%) | 0 (0.0%) |
| 5 to 9 Unit Apartments | 0 (0.0%) | 0 (0.0%) |
| 10 or more Apartments | 0 (0.0%) | 0 (0.0%) |
| Mobile Home / Other | 0 (0.0%) | 0 (0.0%) |
| Total | 47 (78.3%) | 13 (21.7%) |
Housing Structures by Number of Rooms in Brainards
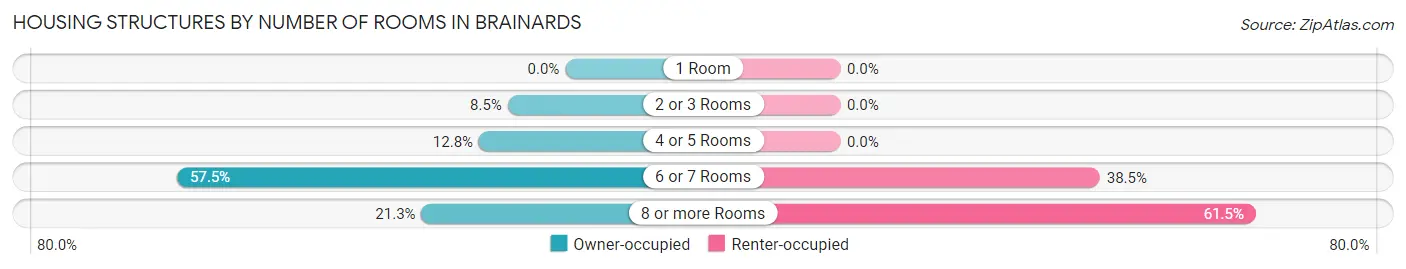
| Number of Rooms | Owner-occupied | Renter-occupied |
| 1 Room | 0 (0.0%) | 0 (0.0%) |
| 2 or 3 Rooms | 4 (8.5%) | 0 (0.0%) |
| 4 or 5 Rooms | 6 (12.8%) | 0 (0.0%) |
| 6 or 7 Rooms | 27 (57.5%) | 5 (38.5%) |
| 8 or more Rooms | 10 (21.3%) | 8 (61.5%) |
| Total | 47 (100.0%) | 13 (100.0%) |
Housing Structure by Heating Type in Brainards
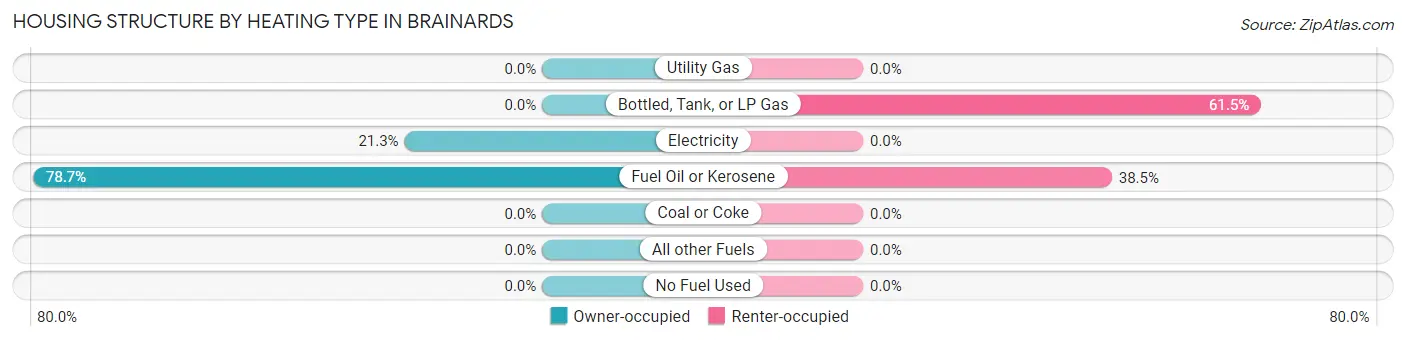
| Heating Type | Owner-occupied | Renter-occupied |
| Utility Gas | 0 (0.0%) | 0 (0.0%) |
| Bottled, Tank, or LP Gas | 0 (0.0%) | 8 (61.5%) |
| Electricity | 10 (21.3%) | 0 (0.0%) |
| Fuel Oil or Kerosene | 37 (78.7%) | 5 (38.5%) |
| Coal or Coke | 0 (0.0%) | 0 (0.0%) |
| All other Fuels | 0 (0.0%) | 0 (0.0%) |
| No Fuel Used | 0 (0.0%) | 0 (0.0%) |
| Total | 47 (100.0%) | 13 (100.0%) |
Household Vehicle Usage in Brainards
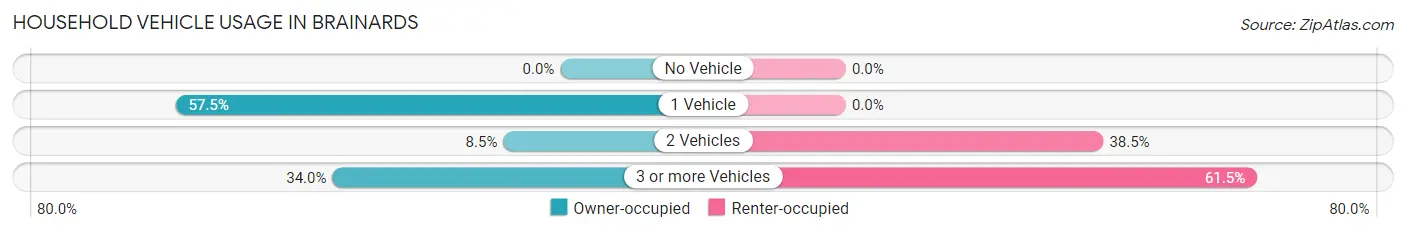
| Vehicles per Household | Owner-occupied | Renter-occupied |
| No Vehicle | 0 (0.0%) | 0 (0.0%) |
| 1 Vehicle | 27 (57.5%) | 0 (0.0%) |
| 2 Vehicles | 4 (8.5%) | 5 (38.5%) |
| 3 or more Vehicles | 16 (34.0%) | 8 (61.5%) |
| Total | 47 (100.0%) | 13 (100.0%) |
Real Estate & Mortgages in Brainards
Real Estate and Mortgage Overview in Brainards
| Characteristic | Without Mortgage | With Mortgage |
| Housing Units | 27 | 20 |
| Median Property Value | - | - |
| Median Household Income | - | - |
| Monthly Housing Costs | - | - |
| Real Estate Taxes | - | - |
Property Value by Mortgage Status in Brainards
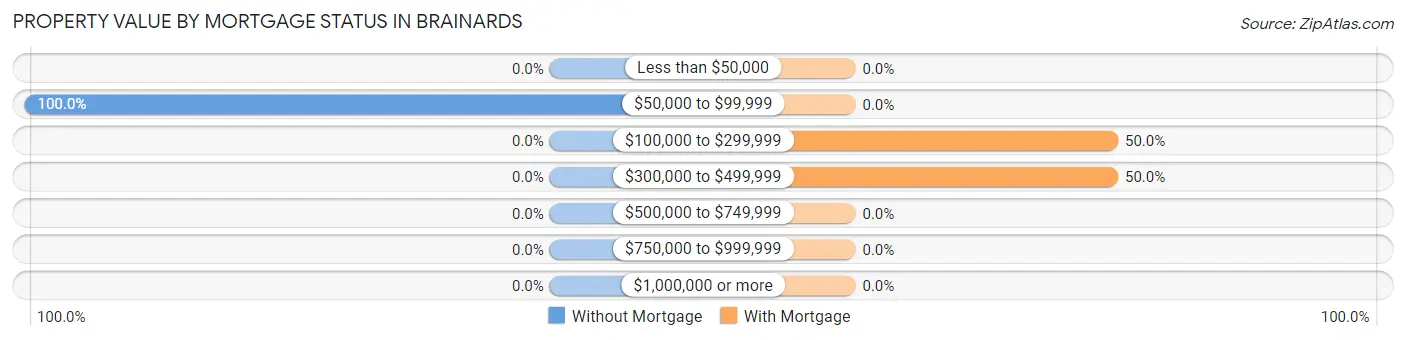
| Property Value | Without Mortgage | With Mortgage |
| Less than $50,000 | 0 (0.0%) | 0 (0.0%) |
| $50,000 to $99,999 | 27 (100.0%) | 0 (0.0%) |
| $100,000 to $299,999 | 0 (0.0%) | 10 (50.0%) |
| $300,000 to $499,999 | 0 (0.0%) | 10 (50.0%) |
| $500,000 to $749,999 | 0 (0.0%) | 0 (0.0%) |
| $750,000 to $999,999 | 0 (0.0%) | 0 (0.0%) |
| $1,000,000 or more | 0 (0.0%) | 0 (0.0%) |
| Total | 27 (100.0%) | 20 (100.0%) |
Household Income by Mortgage Status in Brainards
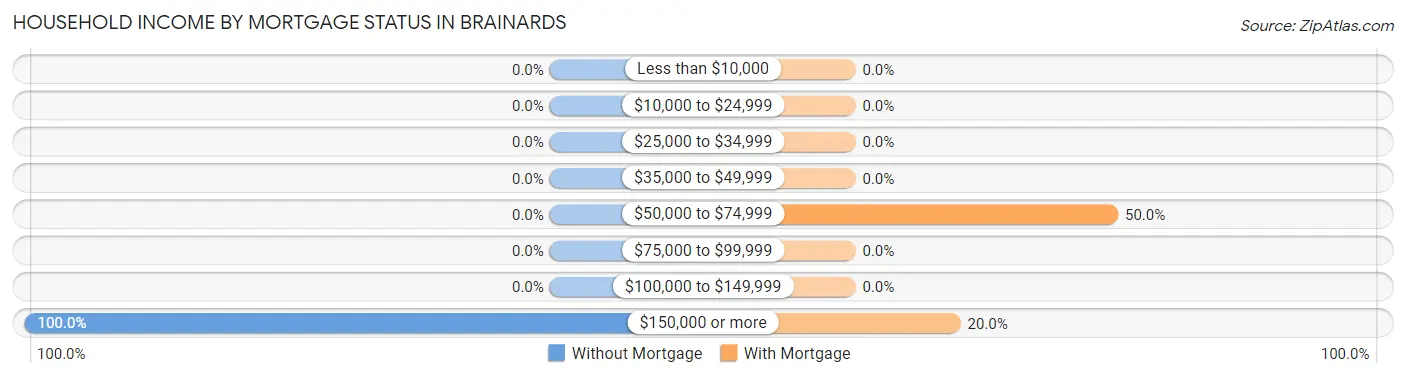
| Household Income | Without Mortgage | With Mortgage |
| Less than $10,000 | 0 (0.0%) | 0 (0.0%) |
| $10,000 to $24,999 | 0 (0.0%) | 0 (0.0%) |
| $25,000 to $34,999 | 0 (0.0%) | 0 (0.0%) |
| $35,000 to $49,999 | 0 (0.0%) | 0 (0.0%) |
| $50,000 to $74,999 | 0 (0.0%) | 10 (50.0%) |
| $75,000 to $99,999 | 0 (0.0%) | 0 (0.0%) |
| $100,000 to $149,999 | 0 (0.0%) | 0 (0.0%) |
| $150,000 or more | 27 (100.0%) | 4 (20.0%) |
| Total | 27 (100.0%) | 20 (100.0%) |
Property Value to Household Income Ratio in Brainards
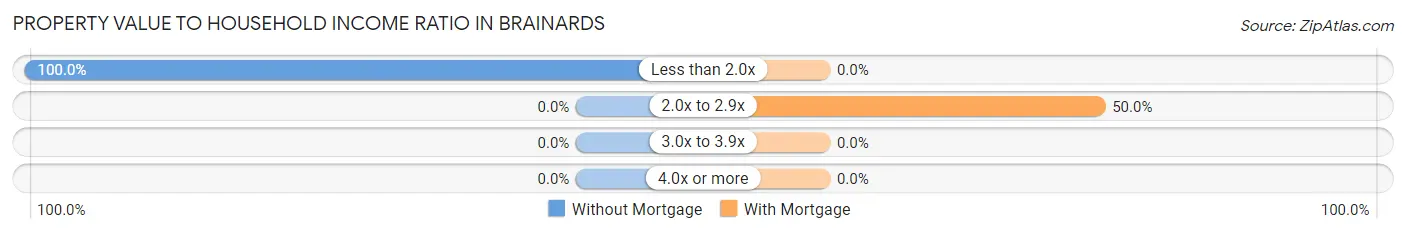
| Value-to-Income Ratio | Without Mortgage | With Mortgage |
| Less than 2.0x | 27 (100.0%) | 0 (0.0%) |
| 2.0x to 2.9x | 0 (0.0%) | 10 (50.0%) |
| 3.0x to 3.9x | 0 (0.0%) | 0 (0.0%) |
| 4.0x or more | 0 (0.0%) | 0 (0.0%) |
| Total | 27 (100.0%) | 20 (100.0%) |
Real Estate Taxes by Mortgage Status in Brainards
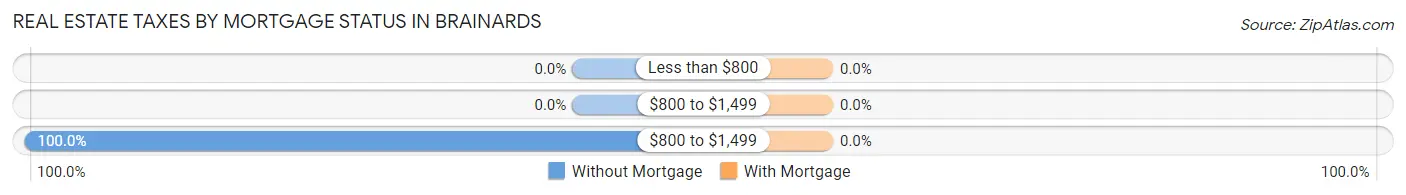
| Property Taxes | Without Mortgage | With Mortgage |
| Less than $800 | 0 (0.0%) | 0 (0.0%) |
| $800 to $1,499 | 0 (0.0%) | 0 (0.0%) |
| $800 to $1,499 | 27 (100.0%) | 0 (0.0%) |
| Total | 27 (100.0%) | 20 (100.0%) |
Health & Disability in Brainards
Health Insurance Coverage by Age in Brainards
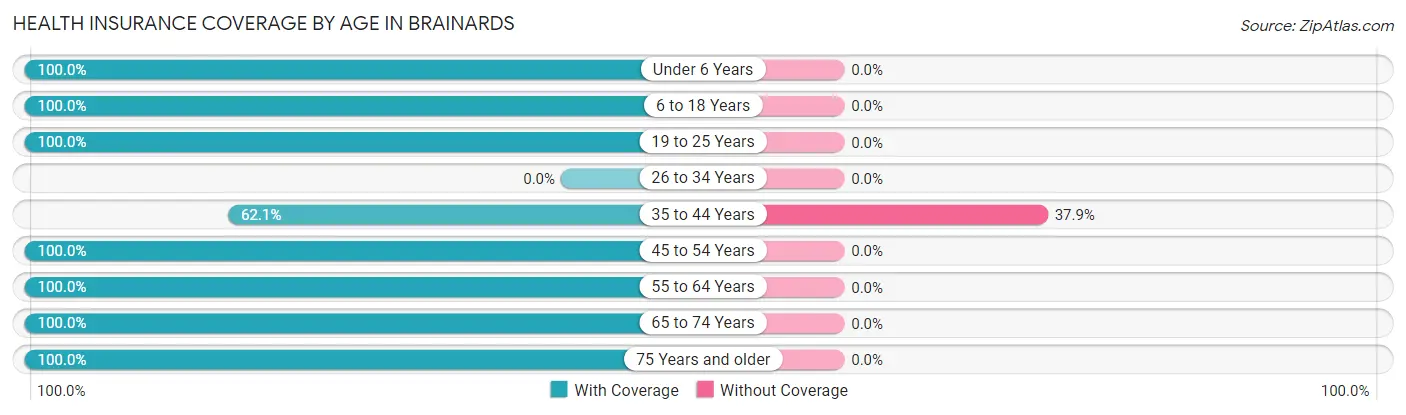
| Age Bracket | With Coverage | Without Coverage |
| Under 6 Years | 8 (100.0%) | 0 (0.0%) |
| 6 to 18 Years | 26 (100.0%) | 0 (0.0%) |
| 19 to 25 Years | 5 (100.0%) | 0 (0.0%) |
| 26 to 34 Years | 0 (0.0%) | 0 (0.0%) |
| 35 to 44 Years | 18 (62.1%) | 11 (37.9%) |
| 45 to 54 Years | 33 (100.0%) | 0 (0.0%) |
| 55 to 64 Years | 51 (100.0%) | 0 (0.0%) |
| 65 to 74 Years | 9 (100.0%) | 0 (0.0%) |
| 75 Years and older | 5 (100.0%) | 0 (0.0%) |
| Total | 155 (93.4%) | 11 (6.6%) |
Health Insurance Coverage by Citizenship Status in Brainards
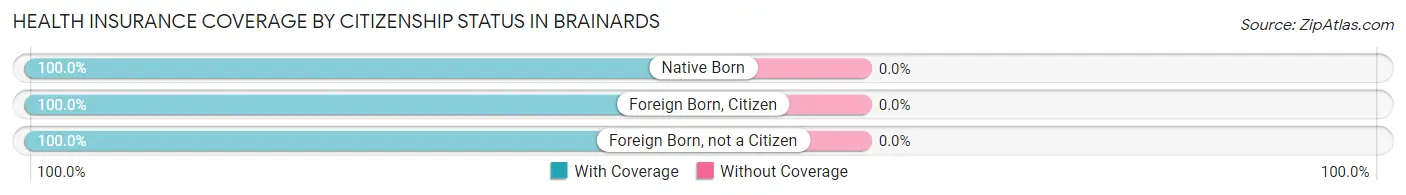
| Citizenship Status | With Coverage | Without Coverage |
| Native Born | 8 (100.0%) | 0 (0.0%) |
| Foreign Born, Citizen | 26 (100.0%) | 0 (0.0%) |
| Foreign Born, not a Citizen | 5 (100.0%) | 0 (0.0%) |
Health Insurance Coverage by Household Income in Brainards
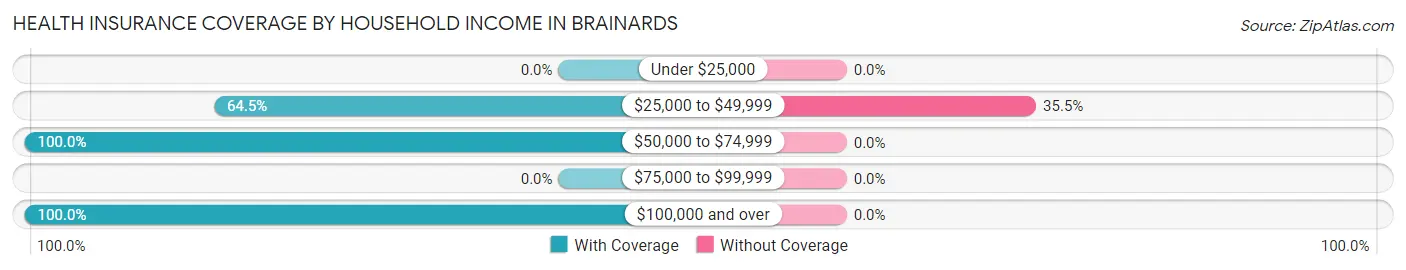
| Household Income | With Coverage | Without Coverage |
| Under $25,000 | 0 (0.0%) | 0 (0.0%) |
| $25,000 to $49,999 | 20 (64.5%) | 11 (35.5%) |
| $50,000 to $74,999 | 15 (100.0%) | 0 (0.0%) |
| $75,000 to $99,999 | 0 (0.0%) | 0 (0.0%) |
| $100,000 and over | 120 (100.0%) | 0 (0.0%) |
Public vs Private Health Insurance Coverage by Age in Brainards
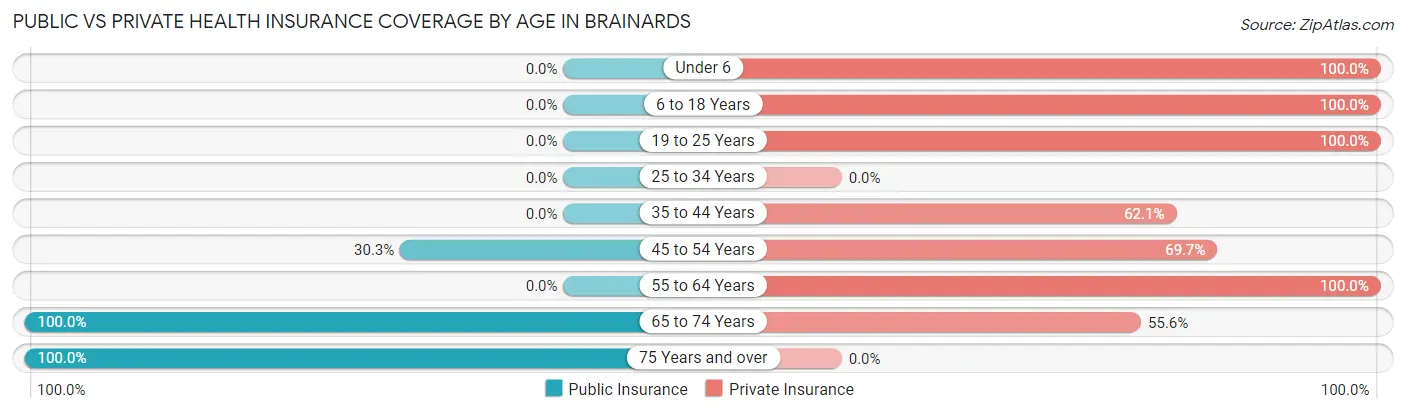
| Age Bracket | Public Insurance | Private Insurance |
| Under 6 | 0 (0.0%) | 8 (100.0%) |
| 6 to 18 Years | 0 (0.0%) | 26 (100.0%) |
| 19 to 25 Years | 0 (0.0%) | 5 (100.0%) |
| 25 to 34 Years | 0 (0.0%) | 0 (0.0%) |
| 35 to 44 Years | 0 (0.0%) | 18 (62.1%) |
| 45 to 54 Years | 10 (30.3%) | 23 (69.7%) |
| 55 to 64 Years | 0 (0.0%) | 51 (100.0%) |
| 65 to 74 Years | 9 (100.0%) | 5 (55.6%) |
| 75 Years and over | 5 (100.0%) | 0 (0.0%) |
| Total | 24 (14.5%) | 136 (81.9%) |
Disability Status by Sex by Age in Brainards
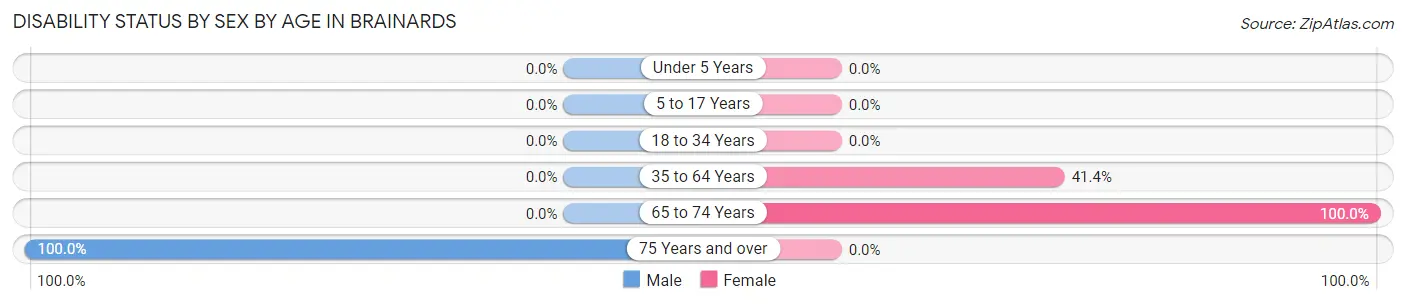
| Age Bracket | Male | Female |
| Under 5 Years | 0 (0.0%) | 0 (0.0%) |
| 5 to 17 Years | 0 (0.0%) | 0 (0.0%) |
| 18 to 34 Years | 0 (0.0%) | 0 (0.0%) |
| 35 to 64 Years | 0 (0.0%) | 24 (41.4%) |
| 65 to 74 Years | 0 (0.0%) | 5 (100.0%) |
| 75 Years and over | 5 (100.0%) | 0 (0.0%) |
Disability Class by Sex by Age in Brainards
Disability Class: Hearing Difficulty
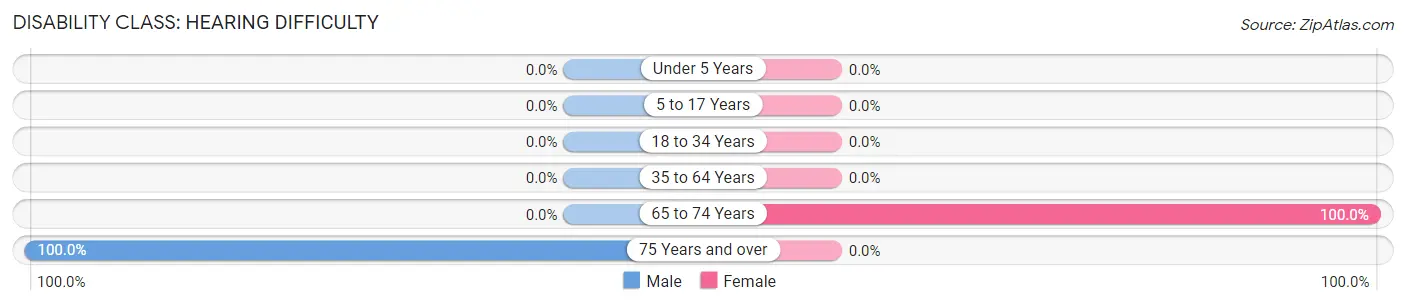
| Age Bracket | Male | Female |
| Under 5 Years | 0 (0.0%) | 0 (0.0%) |
| 5 to 17 Years | 0 (0.0%) | 0 (0.0%) |
| 18 to 34 Years | 0 (0.0%) | 0 (0.0%) |
| 35 to 64 Years | 0 (0.0%) | 0 (0.0%) |
| 65 to 74 Years | 0 (0.0%) | 5 (100.0%) |
| 75 Years and over | 5 (100.0%) | 0 (0.0%) |
Disability Class: Vision Difficulty
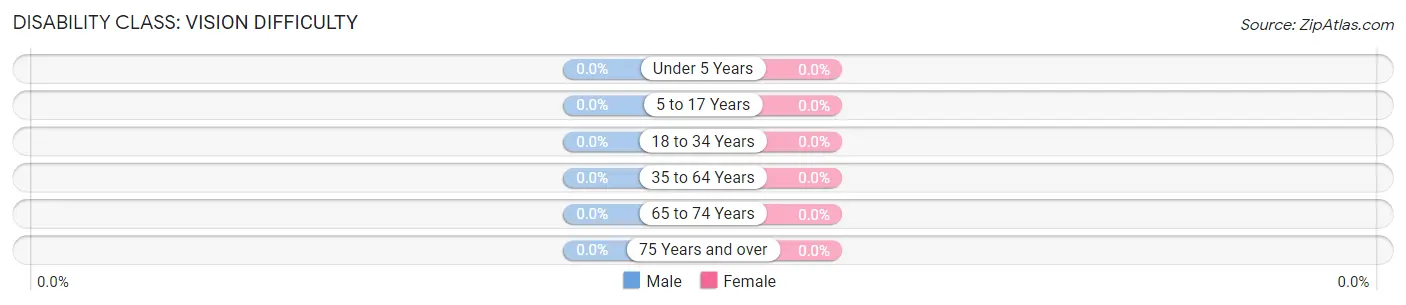
| Age Bracket | Male | Female |
| Under 5 Years | 0 (0.0%) | 0 (0.0%) |
| 5 to 17 Years | 0 (0.0%) | 0 (0.0%) |
| 18 to 34 Years | 0 (0.0%) | 0 (0.0%) |
| 35 to 64 Years | 0 (0.0%) | 0 (0.0%) |
| 65 to 74 Years | 0 (0.0%) | 0 (0.0%) |
| 75 Years and over | 0 (0.0%) | 0 (0.0%) |
Disability Class: Cognitive Difficulty

| Age Bracket | Male | Female |
| 5 to 17 Years | 0 (0.0%) | 0 (0.0%) |
| 18 to 34 Years | 0 (0.0%) | 0 (0.0%) |
| 35 to 64 Years | 0 (0.0%) | 0 (0.0%) |
| 65 to 74 Years | 0 (0.0%) | 0 (0.0%) |
| 75 Years and over | 0 (0.0%) | 0 (0.0%) |
Disability Class: Ambulatory Difficulty
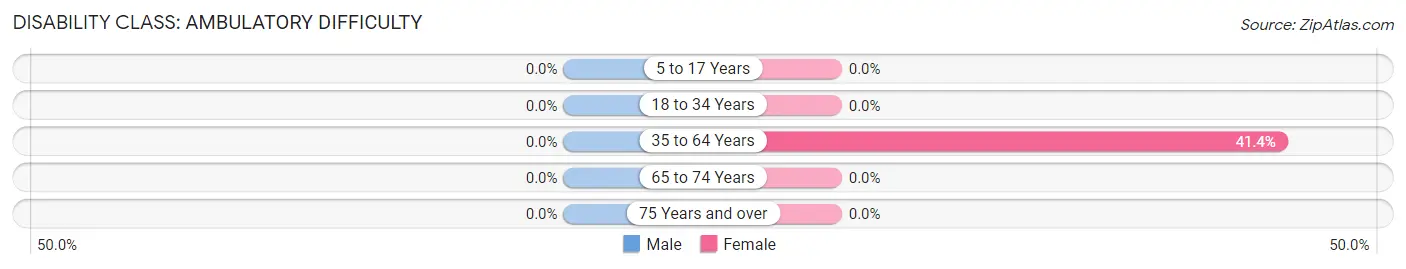
| Age Bracket | Male | Female |
| 5 to 17 Years | 0 (0.0%) | 0 (0.0%) |
| 18 to 34 Years | 0 (0.0%) | 0 (0.0%) |
| 35 to 64 Years | 0 (0.0%) | 24 (41.4%) |
| 65 to 74 Years | 0 (0.0%) | 0 (0.0%) |
| 75 Years and over | 0 (0.0%) | 0 (0.0%) |
Disability Class: Self-Care Difficulty
| Age Bracket | Male | Female |
| 5 to 17 Years | 0 (0.0%) | 0 (0.0%) |
| 18 to 34 Years | 0 (0.0%) | 0 (0.0%) |
| 35 to 64 Years | 0 (0.0%) | 0 (0.0%) |
| 65 to 74 Years | 0 (0.0%) | 0 (0.0%) |
| 75 Years and over | 0 (0.0%) | 0 (0.0%) |
Technology Access in Brainards
Computing Device Access in Brainards
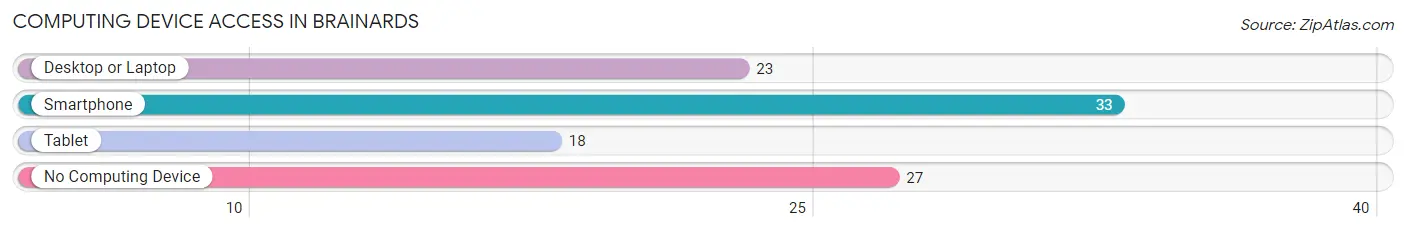
| Device Type | # Households | % Households |
| Desktop or Laptop | 23 | 38.3% |
| Smartphone | 33 | 55.0% |
| Tablet | 18 | 30.0% |
| No Computing Device | 27 | 45.0% |
| Total | 60 | 100.0% |
Internet Access in Brainards
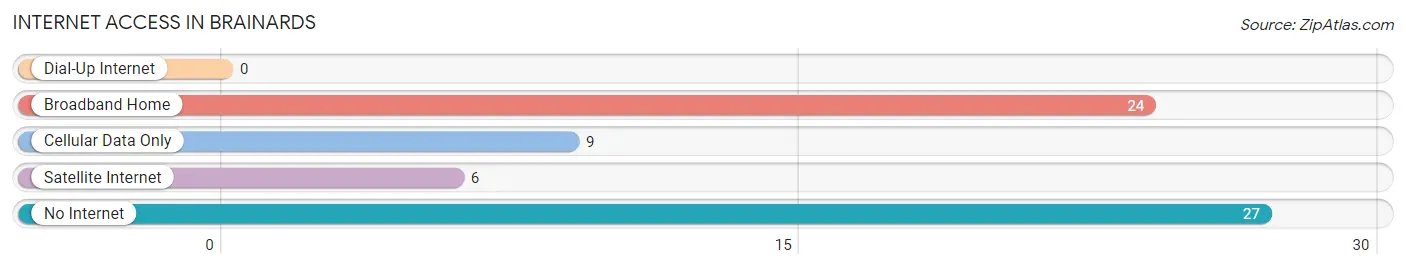
| Internet Type | # Households | % Households |
| Dial-Up Internet | 0 | 0.0% |
| Broadband Home | 24 | 40.0% |
| Cellular Data Only | 9 | 15.0% |
| Satellite Internet | 6 | 10.0% |
| No Internet | 27 | 45.0% |
| Total | 60 | 100.0% |
Brainards Summary
History
Brainards, NJ is a small unincorporated community located in Morris County, New Jersey. It is situated in the northern part of the state, just south of the New York border. The area was first settled in the late 1700s by Dutch and German immigrants. The first known settler was Johannes Brainard, who arrived in 1790 and established a farm. The area was known as Brainardstown until the early 1900s, when it was changed to Brainards.
The area was primarily agricultural until the mid-1900s, when it began to experience a population boom. This was due to the construction of the nearby Interstate 80, which made the area more accessible to commuters. The population continued to grow throughout the 20th century, and today Brainards is a small but vibrant community.
Geography
Brainards is located in the northern part of Morris County, New Jersey. It is situated in the foothills of the Appalachian Mountains, and is surrounded by rolling hills and forests. The area is known for its scenic beauty, and is home to several state parks and nature preserves.
The climate in Brainards is typical of the northeastern United States, with cold winters and warm summers. The average annual temperature is around 50 degrees Fahrenheit, and the average annual precipitation is around 40 inches.
Economy
Brainards is primarily a residential community, and the local economy is largely based on service industries. The area is home to several small businesses, including restaurants, retail stores, and professional services. There are also several light industrial businesses in the area, including a plastics factory and a printing company.
The area is also home to several large corporations, including a pharmaceutical company and a telecommunications company. These companies provide employment opportunities for local residents, and contribute to the local economy.
Demographics
As of the 2010 census, the population of Brainards was 2,845. The population is primarily white (90.3%), with small percentages of African American (3.2%), Asian (2.2%), and Hispanic (2.1%) residents. The median household income is $76,945, and the median home value is $521,000.
Brainards is a small but diverse community. The area is home to a variety of religious denominations, including Catholic, Protestant, and Jewish. The area is also home to a variety of cultural and recreational activities, including festivals, concerts, and outdoor activities.
Conclusion
Brainards, NJ is a small but vibrant community located in Morris County, New Jersey. The area was first settled in the late 1700s, and has since grown into a diverse and prosperous community. The area is home to a variety of businesses, and is known for its scenic beauty and recreational activities. The population is primarily white, with small percentages of African American, Asian, and Hispanic residents. Brainards is a great place to live, work, and play.
Common Questions
What is Per Capita Income in Brainards?
Per Capita income in Brainards is $47,240.
What is the Median Family Income in Brainards?
Median Family Income in Brainards is $118,125.
What is the Median Household income in Brainards?
Median Household Income in Brainards is $165,278.
What is Income or Wage Gap in Brainards?
Income or Wage Gap in Brainards is 19.5%.
Women in Brainards earn 80.5 cents for every dollar earned by a man.
What is Inequality or Gini Index in Brainards?
Inequality or Gini Index in Brainards is 0.21.
What is the Total Population of Brainards?
Total Population of Brainards is 166.
What is the Total Male Population of Brainards?
Total Male Population of Brainards is 85.
What is the Total Female Population of Brainards?
Total Female Population of Brainards is 81.
What is the Ratio of Males per 100 Females in Brainards?
There are 104.94 Males per 100 Females in Brainards.
What is the Ratio of Females per 100 Males in Brainards?
There are 95.29 Females per 100 Males in Brainards.
What is the Median Population Age in Brainards?
Median Population Age in Brainards is 50.5 Years.
What is the Average Family Size in Brainards
Average Family Size in Brainards is 2.5 People.
What is the Average Household Size in Brainards
Average Household Size in Brainards is 2.8 People.
How Large is the Labor Force in Brainards?
There are 128 People in the Labor Forcein in Brainards.
What is the Percentage of People in the Labor Force in Brainards?
97.0% of People are in the Labor Force in Brainards.
What is the Unemployment Rate in Brainards?
Unemployment Rate in Brainards is 7.8%.