Zip Codes with the Highest Percentage of Population Employed in Installation, Maintenance & Repair in Paterson, NJ
RELATED REPORTS & OPTIONS
Installation, Maintenance & Repair
Paterson
Compare Zip Codes
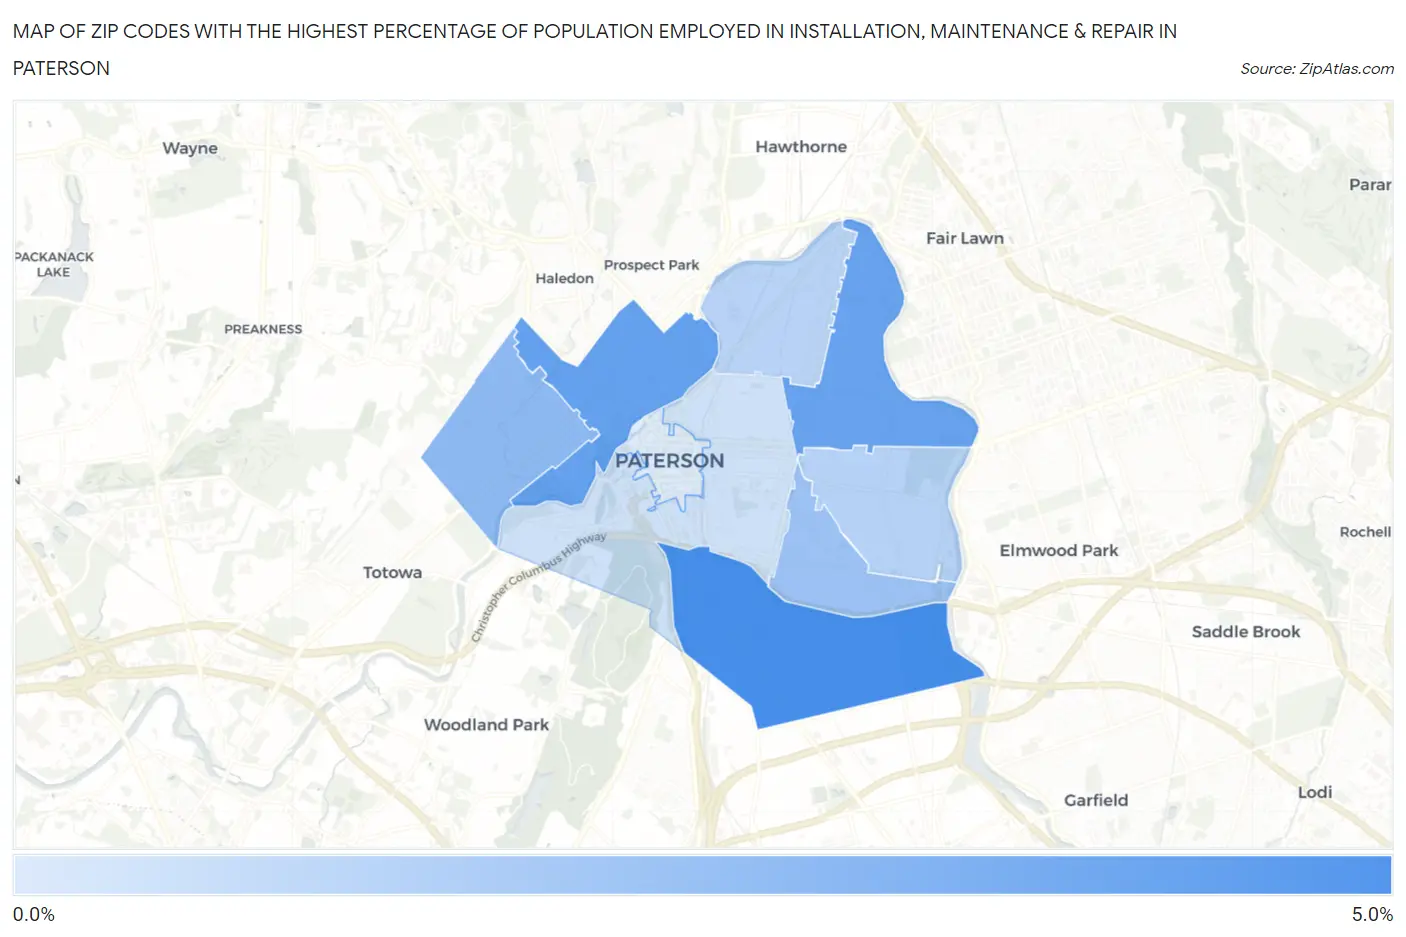
Map of Zip Codes with the Highest Percentage of Population Employed in Installation, Maintenance & Repair in Paterson
0.91%
4.8%
Zip Codes with the Highest Percentage of Population Employed in Installation, Maintenance & Repair in Paterson, NJ
| Zip Code | % Employed | vs State | vs National | |
| 1. | 07503 | 4.8% | 2.5%(+2.23)#62 | 3.1%(+1.68)#9,497 |
| 2. | 07522 | 3.9% | 2.5%(+1.43)#108 | 3.1%(+0.882)#12,592 |
| 3. | 07514 | 3.9% | 2.5%(+1.42)#109 | 3.1%(+0.872)#12,628 |
| 4. | 07502 | 2.9% | 2.5%(+0.370)#210 | 3.1%(-0.181)#17,566 |
| 5. | 07513 | 2.6% | 2.5%(+0.073)#243 | 3.1%(-0.477)#19,113 |
| 6. | 07504 | 1.9% | 2.5%(-0.592)#352 | 3.1%(-1.14)#22,355 |
| 7. | 07524 | 1.9% | 2.5%(-0.651)#358 | 3.1%(-1.20)#22,594 |
| 8. | 07501 | 1.3% | 2.5%(-1.26)#439 | 3.1%(-1.81)#25,054 |
| 9. | 07505 | 0.91% | 2.5%(-1.60)#472 | 3.1%(-2.16)#26,163 |
1
Common Questions
What are the Top 5 Zip Codes with the Highest Percentage of Population Employed in Installation, Maintenance & Repair in Paterson, NJ?
Top 5 Zip Codes with the Highest Percentage of Population Employed in Installation, Maintenance & Repair in Paterson, NJ are:
What zip code has the Highest Percentage of Population Employed in Installation, Maintenance & Repair in Paterson, NJ?
07503 has the Highest Percentage of Population Employed in Installation, Maintenance & Repair in Paterson, NJ with 4.8%.
What is the Percentage of Population Employed in Installation, Maintenance & Repair in Paterson, NJ?
Percentage of Population Employed in Installation, Maintenance & Repair in Paterson is 2.8%.
What is the Percentage of Population Employed in Installation, Maintenance & Repair in New Jersey?
Percentage of Population Employed in Installation, Maintenance & Repair in New Jersey is 2.5%.
What is the Percentage of Population Employed in Installation, Maintenance & Repair in the United States?
Percentage of Population Employed in Installation, Maintenance & Repair in the United States is 3.1%.