Robertsville, NJ Map & Demographics
Robertsville Map
Robertsville Overview
$69,973
PER CAPITA INCOME
$197,529
AVG FAMILY INCOME
$188,068
AVG HOUSEHOLD INCOME
51.0%
WAGE / INCOME GAP [ % ]
49.0¢/ $1
WAGE / INCOME GAP [ $ ]
$13,308
FAMILY INCOME DEFICIT
0.42
INEQUALITY / GINI INDEX
12,646
TOTAL POPULATION
5,937
MALE POPULATION
6,709
FEMALE POPULATION
88.49
MALES / 100 FEMALES
113.00
FEMALES / 100 MALES
40.2
MEDIAN AGE
3.3
AVG FAMILY SIZE
3.1
AVG HOUSEHOLD SIZE
6,631
LABOR FORCE [ PEOPLE ]
66.8%
PERCENT IN LABOR FORCE
4.2%
UNEMPLOYMENT RATE
Income in Robertsville
Income Overview in Robertsville
Per Capita Income in Robertsville is $69,973, while median incomes of families and households are $197,529 and $188,068 respectively.
| Characteristic | Number | Measure |
| Per Capita Income | 12,646 | $69,973 |
| Median Family Income | 3,649 | $197,529 |
| Mean Family Income | 3,649 | $226,226 |
| Median Household Income | 4,099 | $188,068 |
| Mean Household Income | 4,099 | $213,805 |
| Income Deficit | 3,649 | $13,308 |
| Wage / Income Gap (%) | 12,646 | 51.03% |
| Wage / Income Gap ($) | 12,646 | 48.97¢ per $1 |
| Gini / Inequality Index | 12,646 | 0.42 |
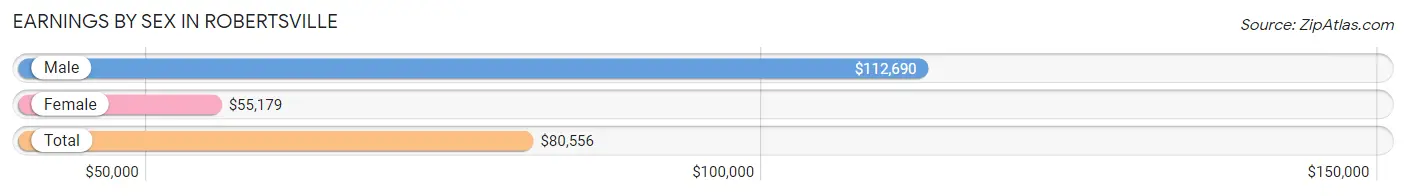
Earnings by Sex in Robertsville
Average Earnings in Robertsville are $80,556, $112,690 for men and $55,179 for women, a difference of 51.0%.
| Sex | Number | Average Earnings |
| Male | 3,741 (53.3%) | $112,690 |
| Female | 3,275 (46.7%) | $55,179 |
| Total | 7,016 (100.0%) | $80,556 |
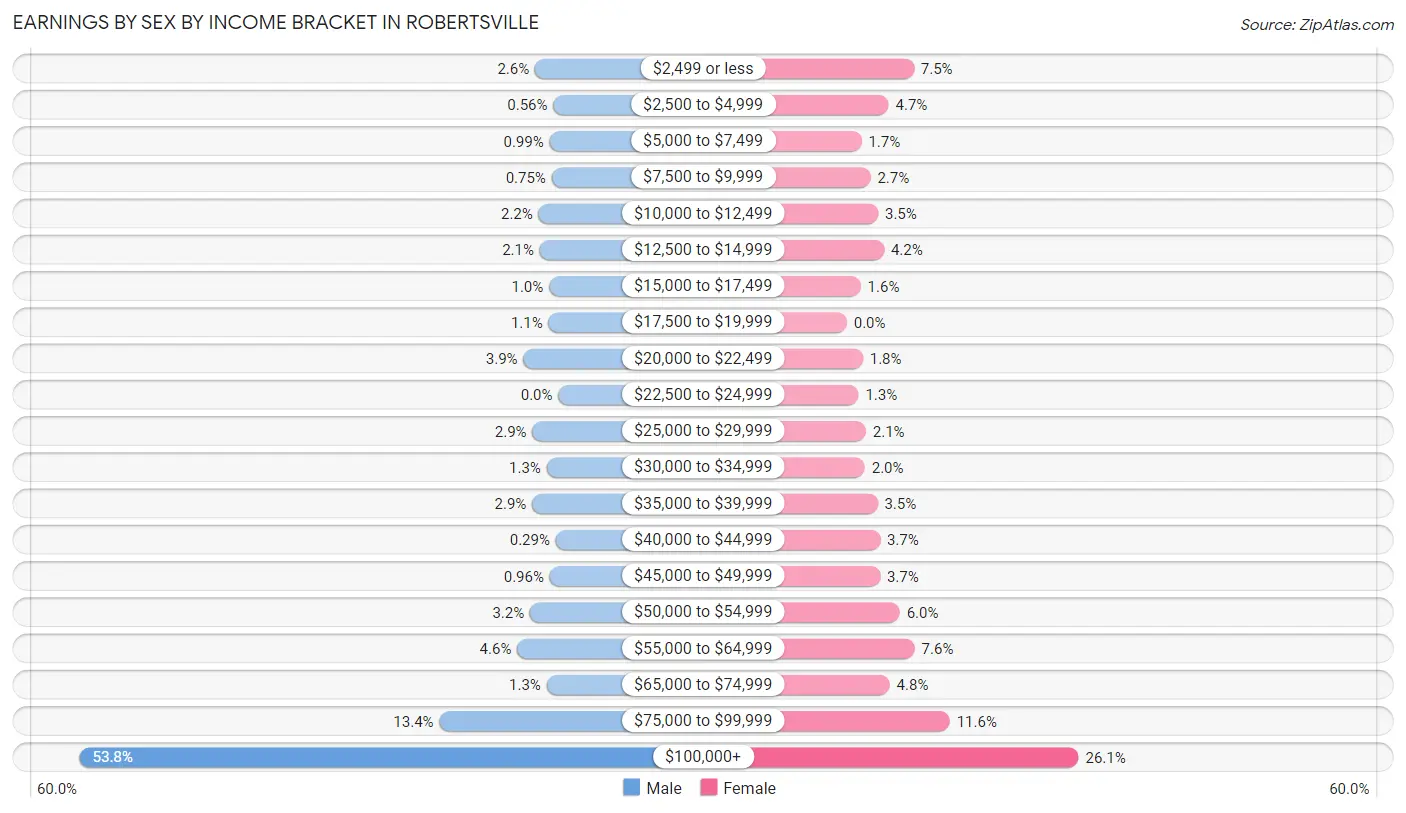
Earnings by Sex by Income Bracket in Robertsville
The most common earnings brackets in Robertsville are $100,000+ for men (2,013 | 53.8%) and $100,000+ for women (853 | 26.1%).
| Income | Male | Female |
| $2,499 or less | 98 (2.6%) | 247 (7.5%) |
| $2,500 to $4,999 | 21 (0.6%) | 154 (4.7%) |
| $5,000 to $7,499 | 37 (1.0%) | 54 (1.7%) |
| $7,500 to $9,999 | 28 (0.7%) | 87 (2.7%) |
| $10,000 to $12,499 | 83 (2.2%) | 115 (3.5%) |
| $12,500 to $14,999 | 78 (2.1%) | 137 (4.2%) |
| $15,000 to $17,499 | 39 (1.0%) | 51 (1.6%) |
| $17,500 to $19,999 | 41 (1.1%) | 0 (0.0%) |
| $20,000 to $22,499 | 147 (3.9%) | 59 (1.8%) |
| $22,500 to $24,999 | 0 (0.0%) | 43 (1.3%) |
| $25,000 to $29,999 | 109 (2.9%) | 70 (2.1%) |
| $30,000 to $34,999 | 49 (1.3%) | 66 (2.0%) |
| $35,000 to $39,999 | 110 (2.9%) | 113 (3.5%) |
| $40,000 to $44,999 | 11 (0.3%) | 122 (3.7%) |
| $45,000 to $49,999 | 36 (1.0%) | 122 (3.7%) |
| $50,000 to $54,999 | 119 (3.2%) | 195 (5.9%) |
| $55,000 to $64,999 | 173 (4.6%) | 250 (7.6%) |
| $65,000 to $74,999 | 49 (1.3%) | 158 (4.8%) |
| $75,000 to $99,999 | 500 (13.4%) | 379 (11.6%) |
| $100,000+ | 2,013 (53.8%) | 853 (26.1%) |
| Total | 3,741 (100.0%) | 3,275 (100.0%) |
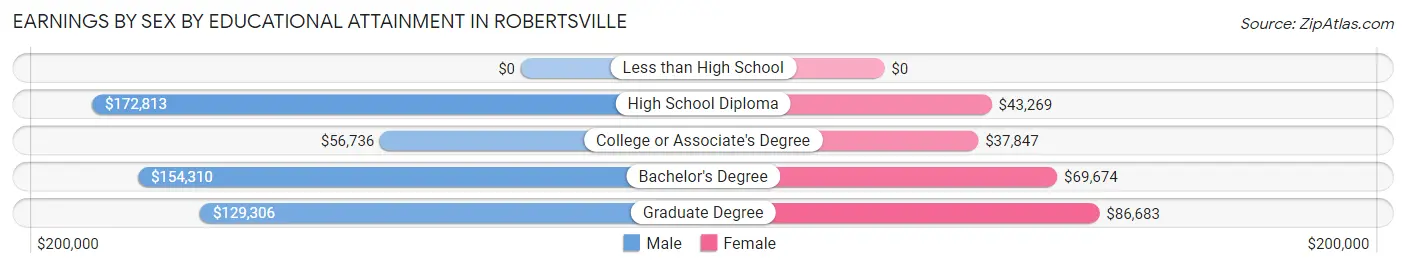
Earnings by Sex by Educational Attainment in Robertsville
Average earnings in Robertsville are $126,959 for men and $63,611 for women, a difference of 49.9%. Men with an educational attainment of high school diploma enjoy the highest average annual earnings of $172,813, while those with college or associate's degree education earn the least with $56,736. Women with an educational attainment of graduate degree earn the most with the average annual earnings of $86,683, while those with college or associate's degree education have the smallest earnings of $37,847.
| Educational Attainment | Male Income | Female Income |
| Less than High School | - | - |
| High School Diploma | $172,813 | $43,269 |
| College or Associate's Degree | $56,736 | $37,847 |
| Bachelor's Degree | $154,310 | $69,674 |
| Graduate Degree | $129,306 | $86,683 |
| Total | $126,959 | $63,611 |
Family Income in Robertsville
Family Income Brackets in Robertsville
According to the Robertsville family income data, there are 1,697 families falling into the $200,000+ income range, which is the most common income bracket and makes up 46.5% of all families.
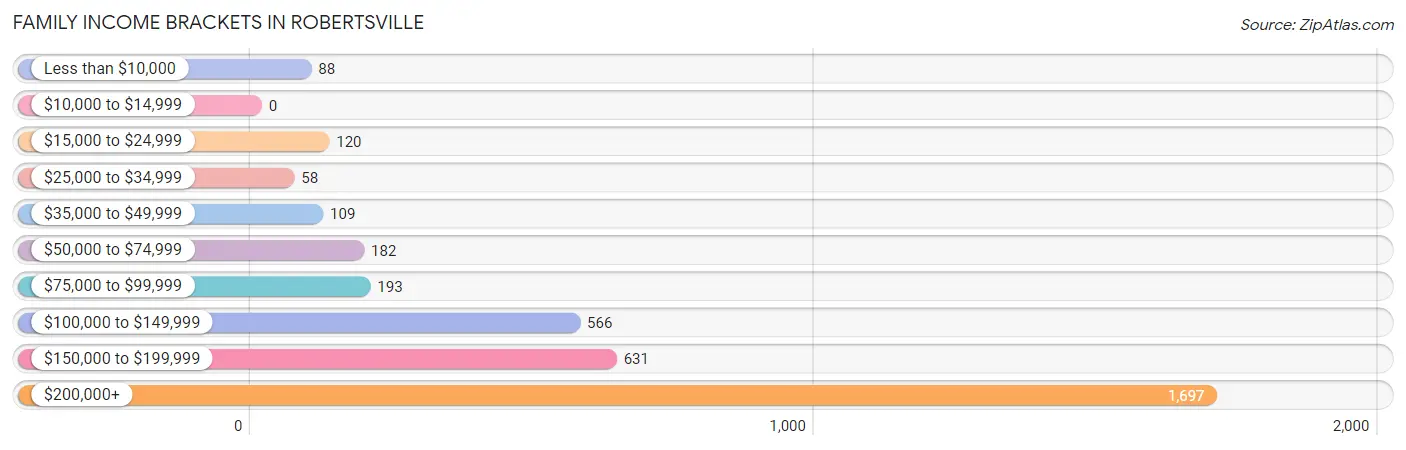
| Income Bracket | # Families | % Families |
| Less than $10,000 | 88 | 2.4% |
| $10,000 to $14,999 | 0 | 0.0% |
| $15,000 to $24,999 | 120 | 3.3% |
| $25,000 to $34,999 | 58 | 1.6% |
| $35,000 to $49,999 | 109 | 3.0% |
| $50,000 to $74,999 | 182 | 5.0% |
| $75,000 to $99,999 | 193 | 5.3% |
| $100,000 to $149,999 | 566 | 15.5% |
| $150,000 to $199,999 | 631 | 17.3% |
| $200,000+ | 1,697 | 46.5% |
Family Income by Famaliy Size in Robertsville
6-person families (247 | 6.8%) account for the highest median family income in Robertsville with $250,001 per family, while 3-person families (726 | 19.9%) have the highest median income of $73,576 per family member.
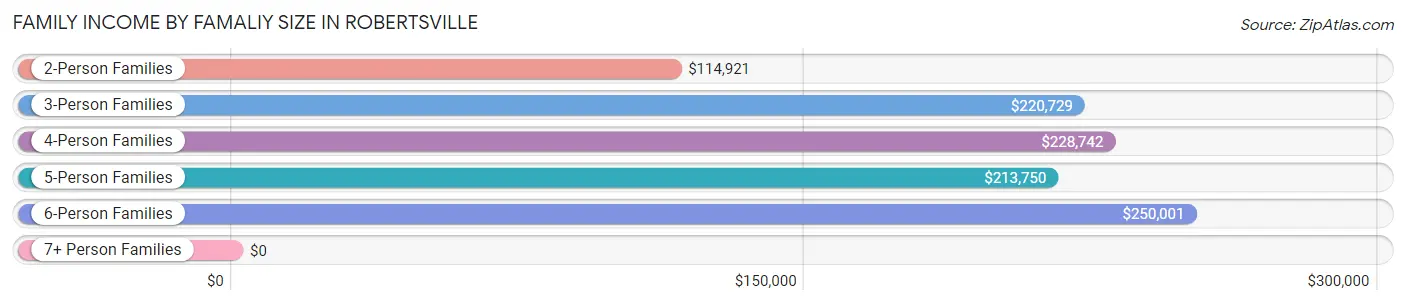
| Income Bracket | # Families | Median Income |
| 2-Person Families | 1,382 (37.9%) | $114,921 |
| 3-Person Families | 726 (19.9%) | $220,729 |
| 4-Person Families | 987 (27.1%) | $228,742 |
| 5-Person Families | 301 (8.3%) | $213,750 |
| 6-Person Families | 247 (6.8%) | $250,001 |
| 7+ Person Families | 6 (0.2%) | $0 |
| Total | 3,649 (100.0%) | $197,529 |
Family Income by Number of Earners in Robertsville
The median family income in Robertsville is $197,529, with families comprising 3+ earners (515) having the highest median family income of $250,001, while families with no earners (389) have the lowest median family income of $81,250, accounting for 14.1% and 10.7% of families, respectively.
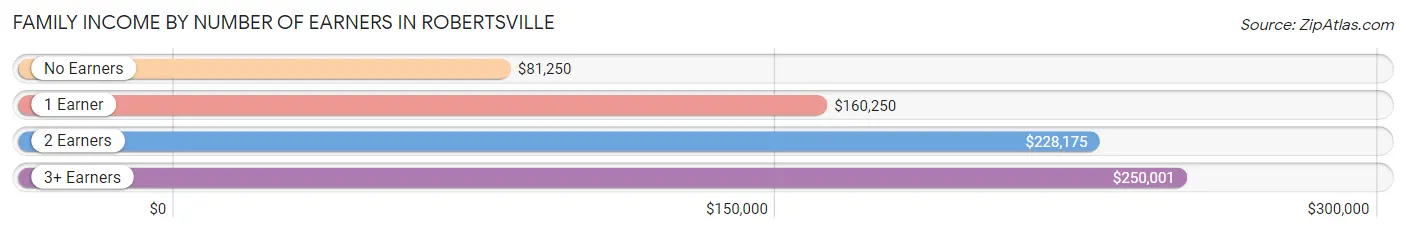
| Number of Earners | # Families | Median Income |
| No Earners | 389 (10.7%) | $81,250 |
| 1 Earner | 922 (25.3%) | $160,250 |
| 2 Earners | 1,823 (50.0%) | $228,175 |
| 3+ Earners | 515 (14.1%) | $250,001 |
| Total | 3,649 (100.0%) | $197,529 |
Household Income in Robertsville
Household Income Brackets in Robertsville
With 1,763 households falling in the category, the $200,000+ income range is the most frequent in Robertsville, accounting for 43.0% of all households.
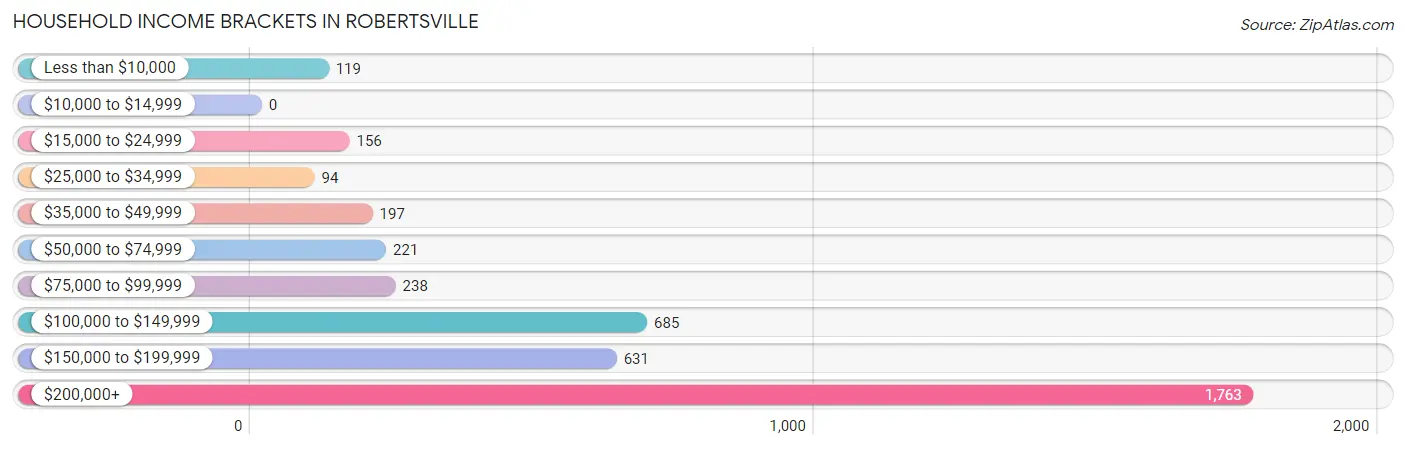
| Income Bracket | # Households | % Households |
| Less than $10,000 | 119 | 2.9% |
| $10,000 to $14,999 | 0 | 0.0% |
| $15,000 to $24,999 | 156 | 3.8% |
| $25,000 to $34,999 | 94 | 2.3% |
| $35,000 to $49,999 | 197 | 4.8% |
| $50,000 to $74,999 | 221 | 5.4% |
| $75,000 to $99,999 | 238 | 5.8% |
| $100,000 to $149,999 | 685 | 16.7% |
| $150,000 to $199,999 | 631 | 15.4% |
| $200,000+ | 1,763 | 43.0% |
Household Income by Householder Age in Robertsville
The median household income in Robertsville is $188,068, with the highest median household income of $227,856 found in the 25 to 44 years age bracket for the primary householder. A total of 1,105 households (27.0%) fall into this category.
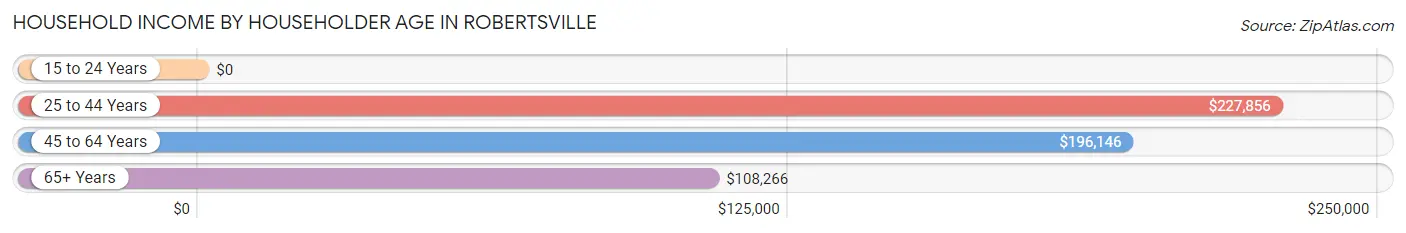
| Income Bracket | # Households | Median Income |
| 15 to 24 Years | 0 (0.0%) | $0 |
| 25 to 44 Years | 1,105 (27.0%) | $227,856 |
| 45 to 64 Years | 1,967 (48.0%) | $196,146 |
| 65+ Years | 1,027 (25.1%) | $108,266 |
| Total | 4,099 (100.0%) | $188,068 |
Poverty in Robertsville
Income Below Poverty by Sex and Age in Robertsville
With 2.6% poverty level for males and 2.1% for females among the residents of Robertsville, 55 to 64 year old males and 55 to 64 year old females are the most vulnerable to poverty, with 93 males (10.5%) and 75 females (8.2%) in their respective age groups living below the poverty level.
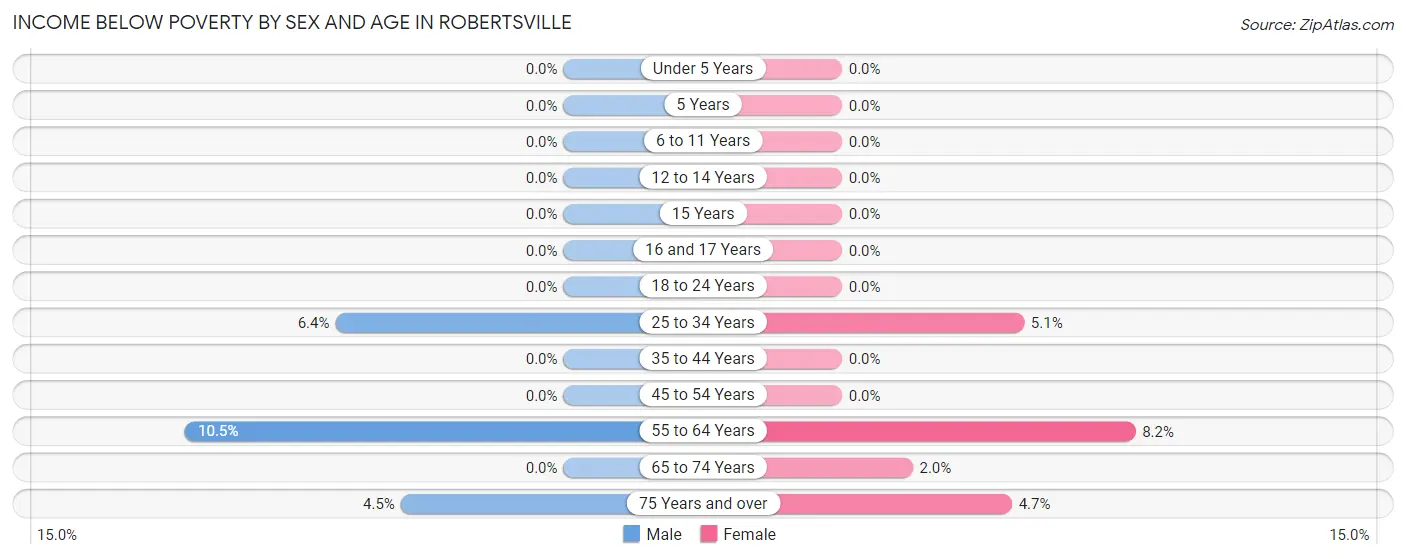
| Age Bracket | Male | Female |
| Under 5 Years | 0 (0.0%) | 0 (0.0%) |
| 5 Years | 0 (0.0%) | 0 (0.0%) |
| 6 to 11 Years | 0 (0.0%) | 0 (0.0%) |
| 12 to 14 Years | 0 (0.0%) | 0 (0.0%) |
| 15 Years | 0 (0.0%) | 0 (0.0%) |
| 16 and 17 Years | 0 (0.0%) | 0 (0.0%) |
| 18 to 24 Years | 0 (0.0%) | 0 (0.0%) |
| 25 to 34 Years | 52 (6.4%) | 38 (5.1%) |
| 35 to 44 Years | 0 (0.0%) | 0 (0.0%) |
| 45 to 54 Years | 0 (0.0%) | 0 (0.0%) |
| 55 to 64 Years | 93 (10.5%) | 75 (8.2%) |
| 65 to 74 Years | 0 (0.0%) | 11 (2.0%) |
| 75 Years and over | 11 (4.5%) | 16 (4.7%) |
| Total | 156 (2.6%) | 140 (2.1%) |
Income Above Poverty by Sex and Age in Robertsville
According to the poverty statistics in Robertsville, males aged under 5 years and females aged under 5 years are the age groups that are most secure financially, with 100.0% of males and 100.0% of females in these age groups living above the poverty line.
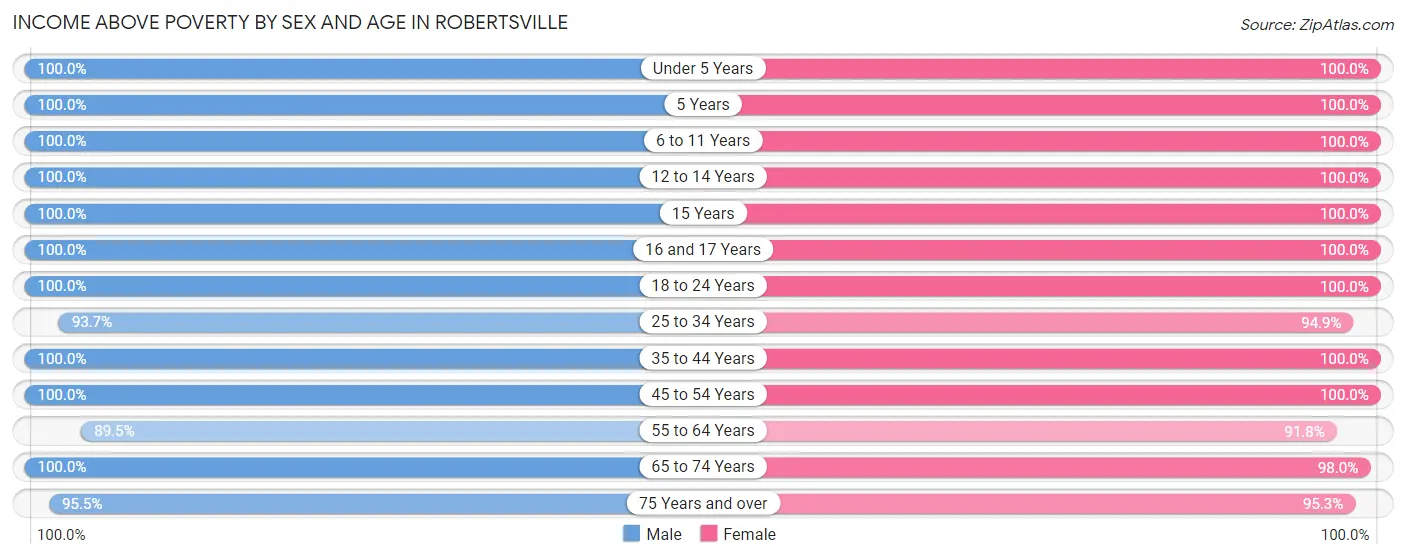
| Age Bracket | Male | Female |
| Under 5 Years | 296 (100.0%) | 554 (100.0%) |
| 5 Years | 57 (100.0%) | 45 (100.0%) |
| 6 to 11 Years | 364 (100.0%) | 586 (100.0%) |
| 12 to 14 Years | 336 (100.0%) | 233 (100.0%) |
| 15 Years | 74 (100.0%) | 174 (100.0%) |
| 16 and 17 Years | 187 (100.0%) | 261 (100.0%) |
| 18 to 24 Years | 432 (100.0%) | 594 (100.0%) |
| 25 to 34 Years | 767 (93.6%) | 712 (94.9%) |
| 35 to 44 Years | 764 (100.0%) | 778 (100.0%) |
| 45 to 54 Years | 963 (100.0%) | 919 (100.0%) |
| 55 to 64 Years | 790 (89.5%) | 843 (91.8%) |
| 65 to 74 Years | 519 (100.0%) | 548 (98.0%) |
| 75 Years and over | 232 (95.5%) | 322 (95.3%) |
| Total | 5,781 (97.4%) | 6,569 (97.9%) |
Income Below Poverty Among Married-Couple Families in Robertsville
The poverty statistics for married-couple families in Robertsville show that 2.7% or 87 of the total 3,219 families live below the poverty line. Families with no children have the highest poverty rate of 5.2%, comprising of 87 families. On the other hand, families with 1 or 2 children have the lowest poverty rate of 0.0%, which includes 0 families.
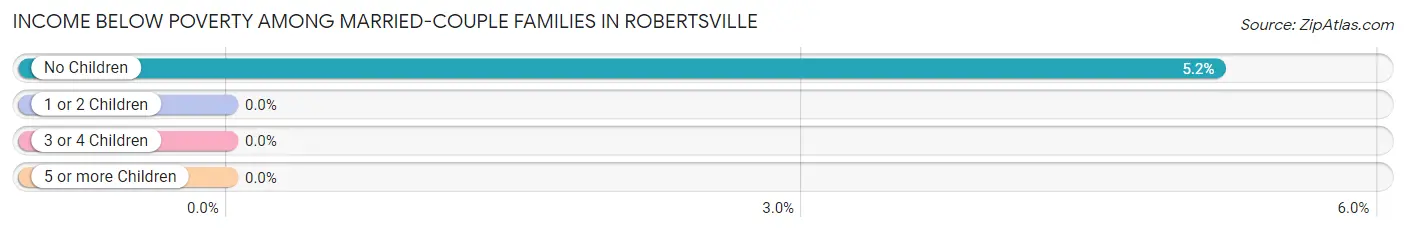
| Children | Above Poverty | Below Poverty |
| No Children | 1,598 (94.8%) | 87 (5.2%) |
| 1 or 2 Children | 1,291 (100.0%) | 0 (0.0%) |
| 3 or 4 Children | 237 (100.0%) | 0 (0.0%) |
| 5 or more Children | 6 (100.0%) | 0 (0.0%) |
| Total | 3,132 (97.3%) | 87 (2.7%) |
Income Below Poverty Among Single-Parent Households in Robertsville
| Children | Single Father | Single Mother |
| No Children | 0 (0.0%) | 0 (0.0%) |
| 1 or 2 Children | 0 (0.0%) | 0 (0.0%) |
| 3 or 4 Children | 0 (0.0%) | 0 (0.0%) |
| 5 or more Children | 0 (0.0%) | 0 (0.0%) |
| Total | 0 (0.0%) | 0 (0.0%) |
Income Below Poverty Among Married-Couple vs Single-Parent Households in Robertsville
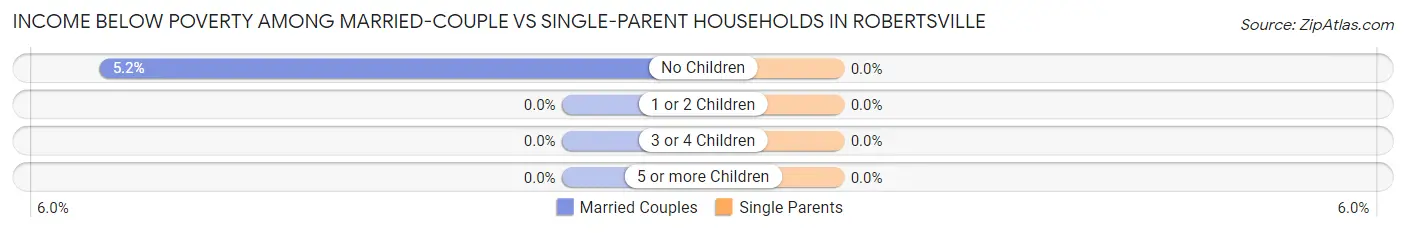
| Children | Married-Couple Families | Single-Parent Households |
| No Children | 87 (5.2%) | 0 (0.0%) |
| 1 or 2 Children | 0 (0.0%) | 0 (0.0%) |
| 3 or 4 Children | 0 (0.0%) | 0 (0.0%) |
| 5 or more Children | 0 (0.0%) | 0 (0.0%) |
| Total | 87 (2.7%) | 0 (0.0%) |
Race in Robertsville
The most populous races in Robertsville are White / Caucasian (9,832 | 77.7%), Asian (1,802 | 14.2%), and Hispanic or Latino (1,014 | 8.0%).
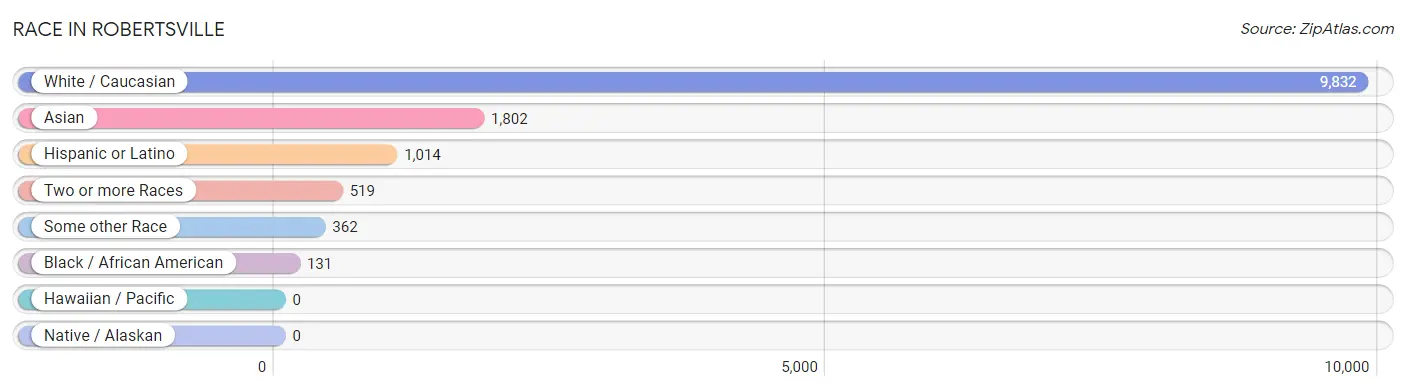
| Race | # Population | % Population |
| Asian | 1,802 | 14.2% |
| Black / African American | 131 | 1.0% |
| Hawaiian / Pacific | 0 | 0.0% |
| Hispanic or Latino | 1,014 | 8.0% |
| Native / Alaskan | 0 | 0.0% |
| White / Caucasian | 9,832 | 77.7% |
| Two or more Races | 519 | 4.1% |
| Some other Race | 362 | 2.9% |
| Total | 12,646 | 100.0% |
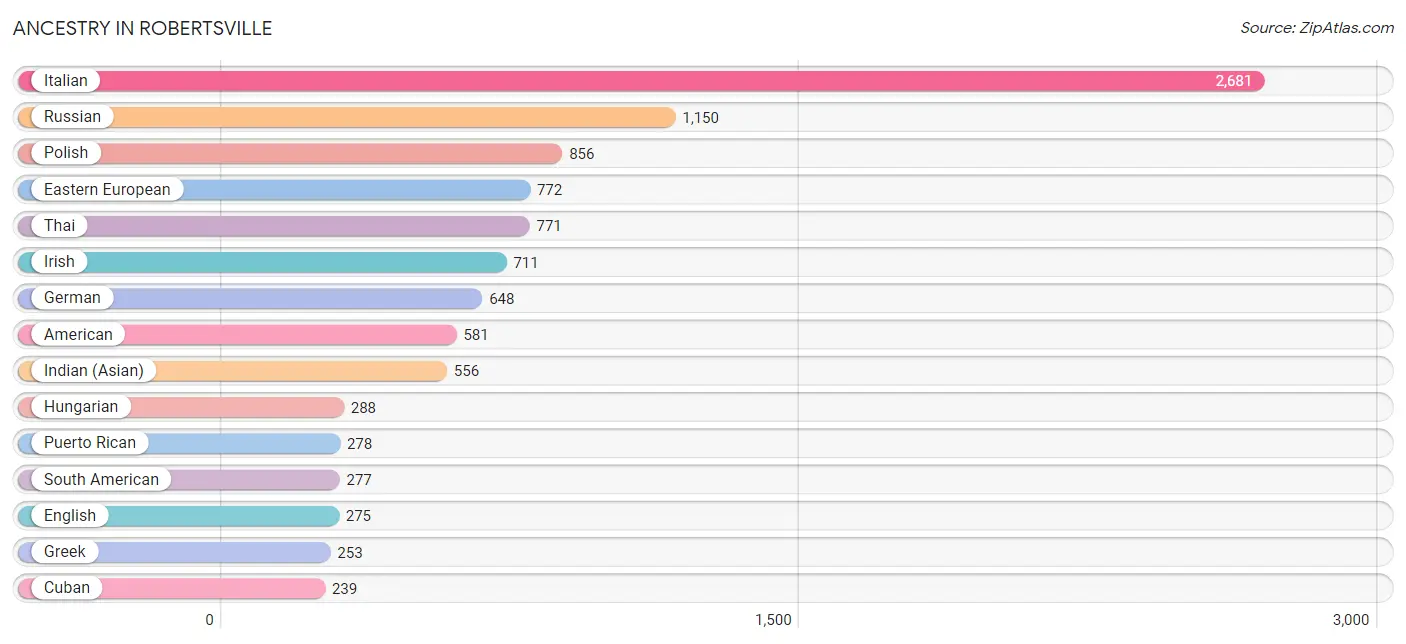
Ancestry in Robertsville
The most populous ancestries reported in Robertsville are Italian (2,681 | 21.2%), Russian (1,150 | 9.1%), Polish (856 | 6.8%), Eastern European (772 | 6.1%), and Thai (771 | 6.1%), together accounting for 49.3% of all Robertsville residents.
| Ancestry | # Population | % Population |
| African | 17 | 0.1% |
| Albanian | 126 | 1.0% |
| American | 581 | 4.6% |
| Arab | 87 | 0.7% |
| Austrian | 48 | 0.4% |
| Brazilian | 41 | 0.3% |
| Burmese | 181 | 1.4% |
| Central American | 8 | 0.1% |
| Cherokee | 94 | 0.7% |
| Colombian | 37 | 0.3% |
| Costa Rican | 8 | 0.1% |
| Cuban | 239 | 1.9% |
| Eastern European | 772 | 6.1% |
| Ecuadorian | 66 | 0.5% |
| Egyptian | 14 | 0.1% |
| English | 275 | 2.2% |
| European | 222 | 1.8% |
| Filipino | 17 | 0.1% |
| French | 45 | 0.4% |
| French Canadian | 68 | 0.5% |
| German | 648 | 5.1% |
| Greek | 253 | 2.0% |
| Haitian | 36 | 0.3% |
| Hungarian | 288 | 2.3% |
| Indian (Asian) | 556 | 4.4% |
| Irish | 711 | 5.6% |
| Israeli | 34 | 0.3% |
| Italian | 2,681 | 21.2% |
| Jamaican | 61 | 0.5% |
| Korean | 91 | 0.7% |
| Lithuanian | 26 | 0.2% |
| Macedonian | 52 | 0.4% |
| Mexican | 185 | 1.5% |
| Nigerian | 53 | 0.4% |
| Northern European | 43 | 0.3% |
| Peruvian | 144 | 1.1% |
| Polish | 856 | 6.8% |
| Puerto Rican | 278 | 2.2% |
| Romanian | 191 | 1.5% |
| Russian | 1,150 | 9.1% |
| Scottish | 37 | 0.3% |
| South American | 277 | 2.2% |
| Spaniard | 27 | 0.2% |
| Sri Lankan | 31 | 0.3% |
| Subsaharan African | 70 | 0.5% |
| Swedish | 49 | 0.4% |
| Thai | 771 | 6.1% |
| Turkish | 24 | 0.2% |
| Ukrainian | 171 | 1.3% |
| Uruguayan | 30 | 0.2% | View All 50 Rows |
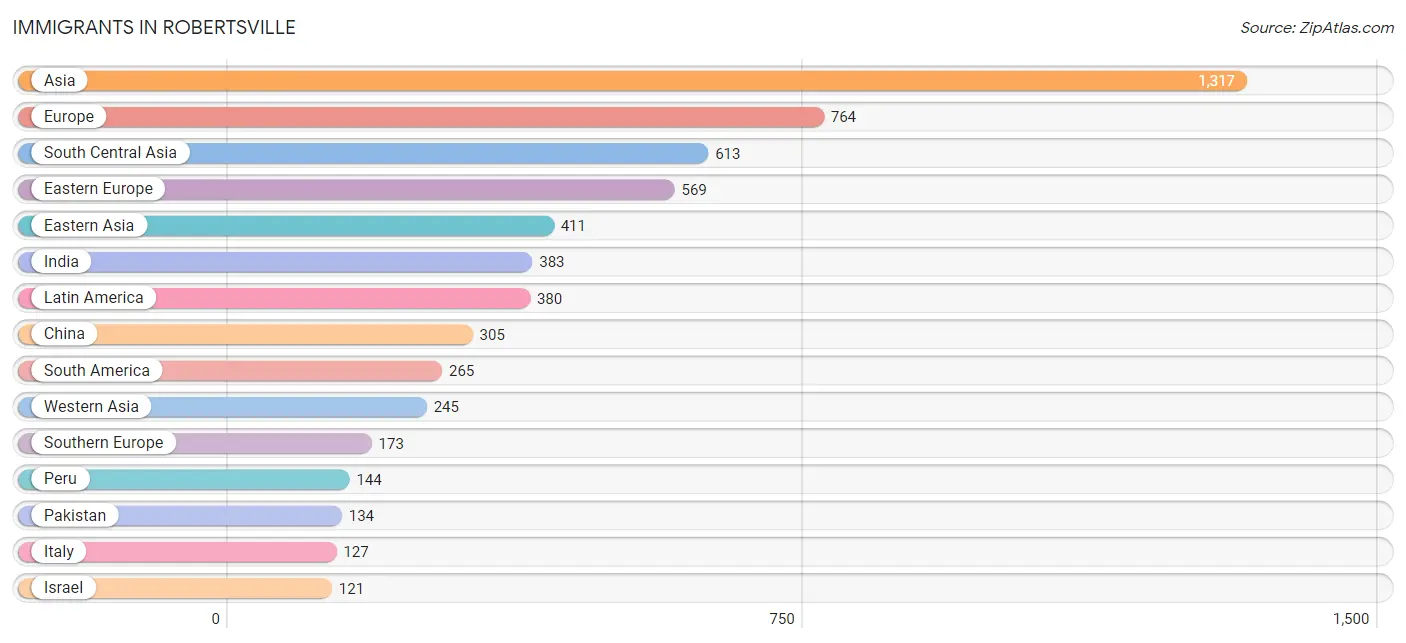
Immigrants in Robertsville
The most numerous immigrant groups reported in Robertsville came from Asia (1,317 | 10.4%), Europe (764 | 6.0%), South Central Asia (613 | 4.9%), Eastern Europe (569 | 4.5%), and Eastern Asia (411 | 3.3%), together accounting for 29.0% of all Robertsville residents.
| Immigration Origin | # Population | % Population |
| Africa | 12 | 0.1% |
| Asia | 1,317 | 10.4% |
| Belarus | 32 | 0.3% |
| Brazil | 88 | 0.7% |
| Caribbean | 69 | 0.5% |
| Central America | 46 | 0.4% |
| China | 305 | 2.4% |
| Colombia | 10 | 0.1% |
| Costa Rica | 8 | 0.1% |
| Cuba | 24 | 0.2% |
| Eastern Asia | 411 | 3.3% |
| Eastern Europe | 569 | 4.5% |
| Ecuador | 9 | 0.1% |
| Europe | 764 | 6.0% |
| Germany | 10 | 0.1% |
| Greece | 46 | 0.4% |
| Guyana | 14 | 0.1% |
| Hong Kong | 105 | 0.8% |
| India | 383 | 3.0% |
| Israel | 121 | 1.0% |
| Italy | 127 | 1.0% |
| Jamaica | 14 | 0.1% |
| Kazakhstan | 63 | 0.5% |
| Korea | 106 | 0.8% |
| Latin America | 380 | 3.0% |
| Mexico | 38 | 0.3% |
| Moldova | 11 | 0.1% |
| Nigeria | 12 | 0.1% |
| North Macedonia | 85 | 0.7% |
| Northern Europe | 12 | 0.1% |
| Pakistan | 134 | 1.1% |
| Peru | 144 | 1.1% |
| Philippines | 38 | 0.3% |
| Poland | 93 | 0.7% |
| Romania | 11 | 0.1% |
| Russia | 94 | 0.7% |
| South America | 265 | 2.1% |
| South Central Asia | 613 | 4.9% |
| South Eastern Asia | 48 | 0.4% |
| Southern Europe | 173 | 1.4% |
| Taiwan | 41 | 0.3% |
| Trinidad and Tobago | 31 | 0.3% |
| Ukraine | 92 | 0.7% |
| Uzbekistan | 4 | 0.0% |
| Vietnam | 10 | 0.1% |
| Western Africa | 12 | 0.1% |
| Western Asia | 245 | 1.9% |
| Western Europe | 10 | 0.1% | View All 48 Rows |
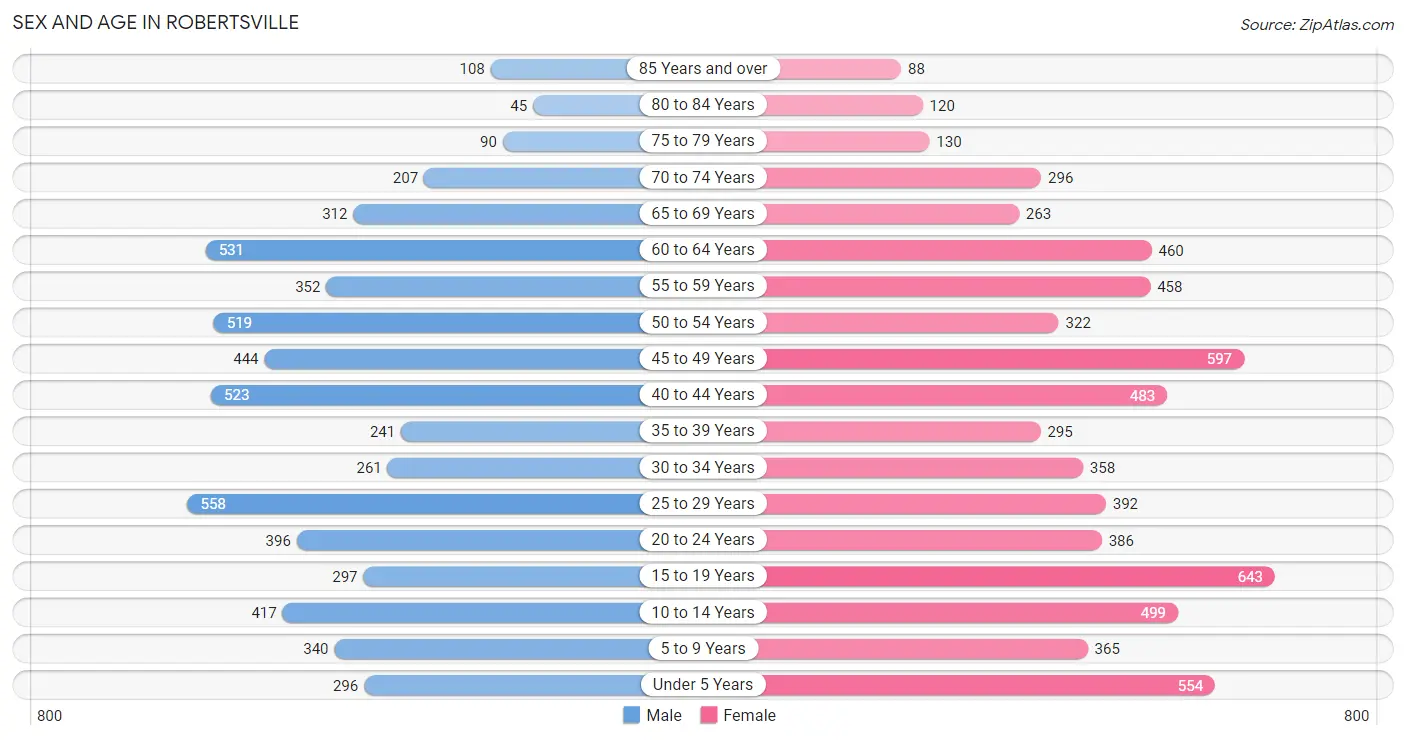
Sex and Age in Robertsville
Sex and Age in Robertsville
The most populous age groups in Robertsville are 25 to 29 Years (558 | 9.4%) for men and 15 to 19 Years (643 | 9.6%) for women.
| Age Bracket | Male | Female |
| Under 5 Years | 296 (5.0%) | 554 (8.3%) |
| 5 to 9 Years | 340 (5.7%) | 365 (5.4%) |
| 10 to 14 Years | 417 (7.0%) | 499 (7.4%) |
| 15 to 19 Years | 297 (5.0%) | 643 (9.6%) |
| 20 to 24 Years | 396 (6.7%) | 386 (5.8%) |
| 25 to 29 Years | 558 (9.4%) | 392 (5.8%) |
| 30 to 34 Years | 261 (4.4%) | 358 (5.3%) |
| 35 to 39 Years | 241 (4.1%) | 295 (4.4%) |
| 40 to 44 Years | 523 (8.8%) | 483 (7.2%) |
| 45 to 49 Years | 444 (7.5%) | 597 (8.9%) |
| 50 to 54 Years | 519 (8.7%) | 322 (4.8%) |
| 55 to 59 Years | 352 (5.9%) | 458 (6.8%) |
| 60 to 64 Years | 531 (8.9%) | 460 (6.9%) |
| 65 to 69 Years | 312 (5.3%) | 263 (3.9%) |
| 70 to 74 Years | 207 (3.5%) | 296 (4.4%) |
| 75 to 79 Years | 90 (1.5%) | 130 (1.9%) |
| 80 to 84 Years | 45 (0.8%) | 120 (1.8%) |
| 85 Years and over | 108 (1.8%) | 88 (1.3%) |
| Total | 5,937 (100.0%) | 6,709 (100.0%) |
Families and Households in Robertsville
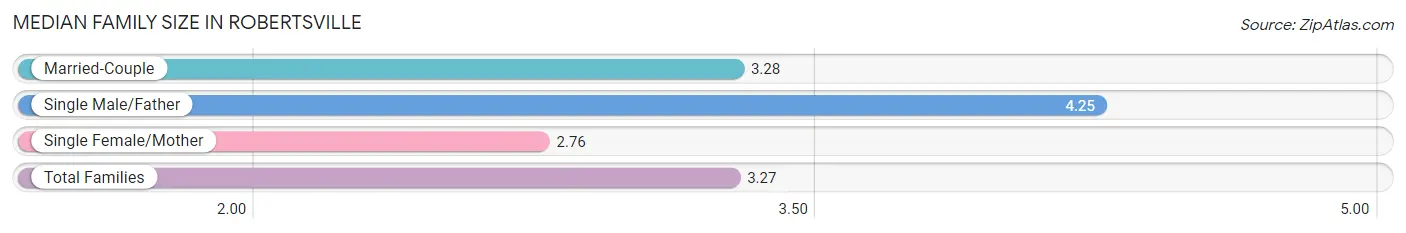
Median Family Size in Robertsville
The median family size in Robertsville is 3.27 persons per family, with single male/father families (126 | 3.5%) accounting for the largest median family size of 4.25 persons per family. On the other hand, single female/mother families (304 | 8.3%) represent the smallest median family size with 2.76 persons per family.
| Family Type | # Families | Family Size |
| Married-Couple | 3,219 (88.2%) | 3.28 |
| Single Male/Father | 126 (3.5%) | 4.25 |
| Single Female/Mother | 304 (8.3%) | 2.76 |
| Total Families | 3,649 (100.0%) | 3.27 |
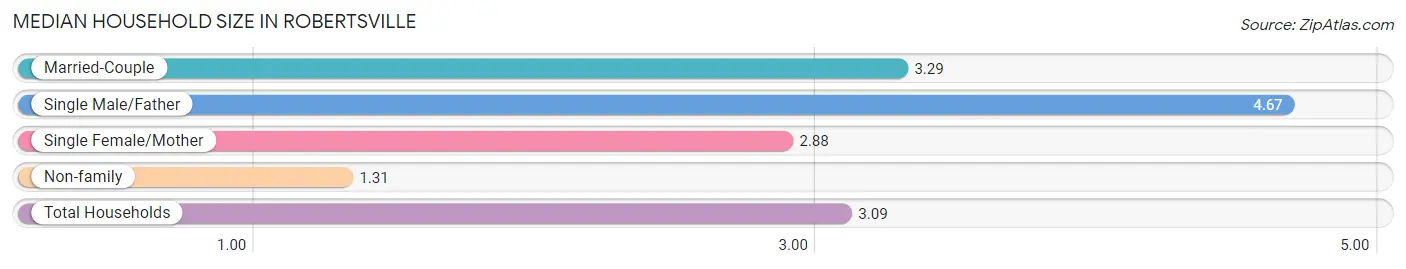
Median Household Size in Robertsville
The median household size in Robertsville is 3.09 persons per household, with single male/father households (126 | 3.1%) accounting for the largest median household size of 4.67 persons per household. non-family households (450 | 11.0%) represent the smallest median household size with 1.31 persons per household.
| Household Type | # Households | Household Size |
| Married-Couple | 3,219 (78.5%) | 3.29 |
| Single Male/Father | 126 (3.1%) | 4.67 |
| Single Female/Mother | 304 (7.4%) | 2.88 |
| Non-family | 450 (11.0%) | 1.31 |
| Total Households | 4,099 (100.0%) | 3.09 |
Household Size by Marriage Status in Robertsville
Out of a total of 4,099 households in Robertsville, 3,649 (89.0%) are family households, while 450 (11.0%) are nonfamily households. The most numerous type of family households are 2-person households, comprising 1,382, and the most common type of nonfamily households are 1-person households, comprising 346.
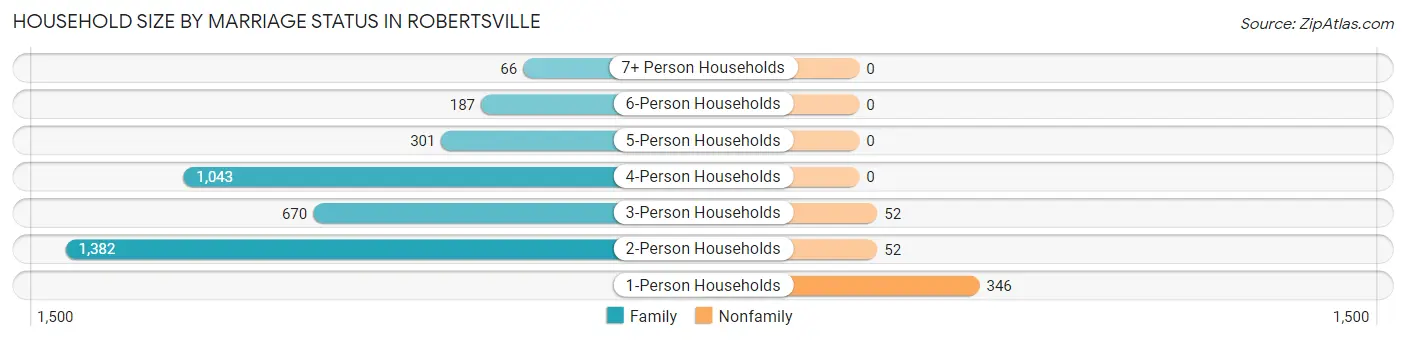
| Household Size | Family Households | Nonfamily Households |
| 1-Person Households | - | 346 (8.4%) |
| 2-Person Households | 1,382 (33.7%) | 52 (1.3%) |
| 3-Person Households | 670 (16.4%) | 52 (1.3%) |
| 4-Person Households | 1,043 (25.5%) | 0 (0.0%) |
| 5-Person Households | 301 (7.3%) | 0 (0.0%) |
| 6-Person Households | 187 (4.6%) | 0 (0.0%) |
| 7+ Person Households | 66 (1.6%) | 0 (0.0%) |
| Total | 3,649 (89.0%) | 450 (11.0%) |
Female Fertility in Robertsville
Fertility by Age in Robertsville
Average fertility rate in Robertsville is 49.0 births per 1,000 women. Women in the age bracket of 20 to 34 years have the highest fertility rate with 138.0 births per 1,000 women. Women in the age bracket of 20 to 34 years acount for 100.0% of all women with births.
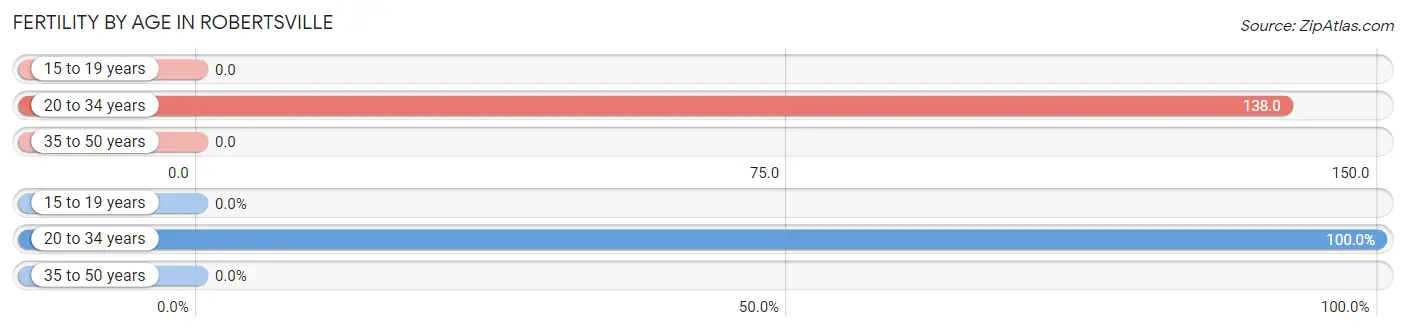
| Age Bracket | Women with Births | Births / 1,000 Women |
| 15 to 19 years | 0 (0.0%) | 0.0 |
| 20 to 34 years | 157 (100.0%) | 138.0 |
| 35 to 50 years | 0 (0.0%) | 0.0 |
| Total | 157 (100.0%) | 49.0 |
Fertility by Age by Marriage Status in Robertsville
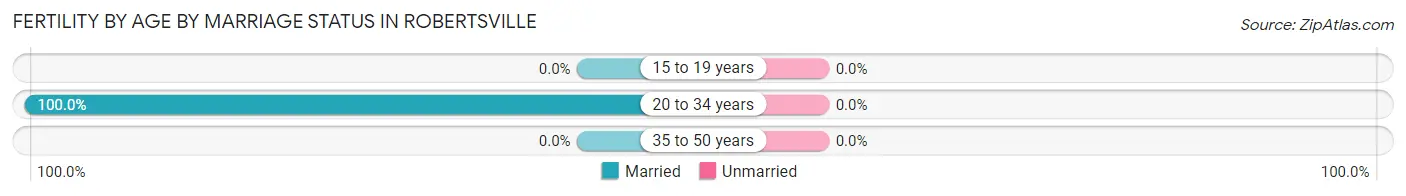
| Age Bracket | Married | Unmarried |
| 15 to 19 years | 0 (0.0%) | 0 (0.0%) |
| 20 to 34 years | 157 (100.0%) | 0 (0.0%) |
| 35 to 50 years | 0 (0.0%) | 0 (0.0%) |
| Total | 157 (100.0%) | 0 (0.0%) |
Fertility by Education in Robertsville
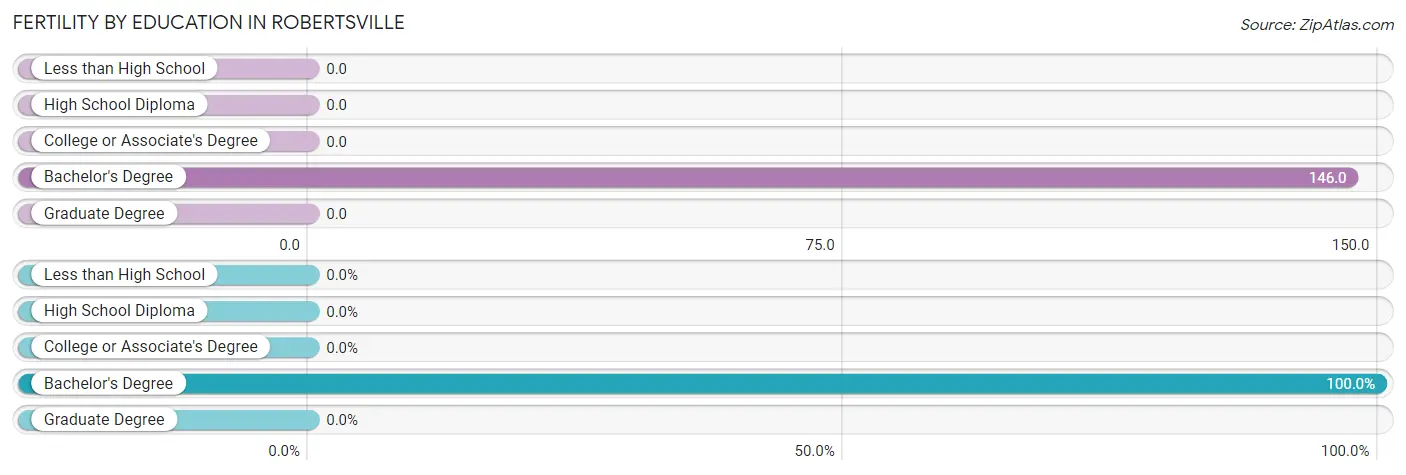
| Educational Attainment | Women with Births | Births / 1,000 Women |
| Less than High School | 0 (0.0%) | 0.0 |
| High School Diploma | 0 (0.0%) | 0.0 |
| College or Associate's Degree | 0 (0.0%) | 0.0 |
| Bachelor's Degree | 157 (100.0%) | 146.0 |
| Graduate Degree | 0 (0.0%) | 0.0 |
| Total | 157 (100.0%) | 49.0 |
Fertility by Education by Marriage Status in Robertsville
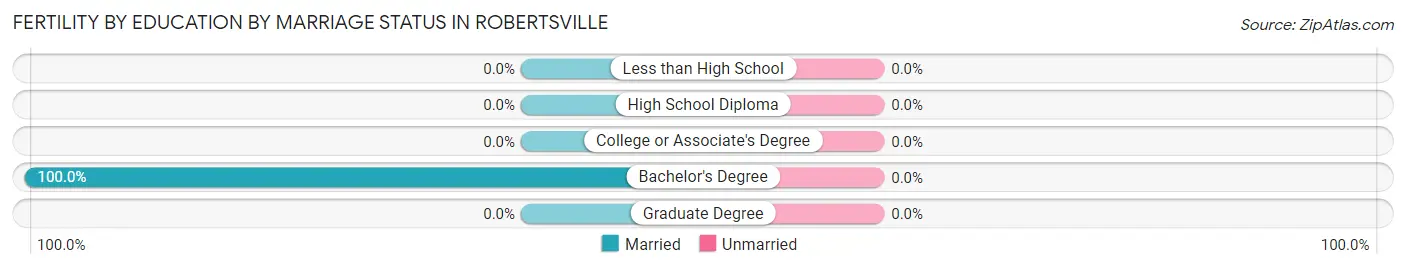
| Educational Attainment | Married | Unmarried |
| Less than High School | 0 (0.0%) | 0 (0.0%) |
| High School Diploma | 0 (0.0%) | 0 (0.0%) |
| College or Associate's Degree | 0 (0.0%) | 0 (0.0%) |
| Bachelor's Degree | 157 (100.0%) | 0 (0.0%) |
| Graduate Degree | 0 (0.0%) | 0 (0.0%) |
| Total | 157 (100.0%) | 0 (0.0%) |
Employment Characteristics in Robertsville
Employment by Class of Employer in Robertsville
Among the 6,228 employed individuals in Robertsville, private company employees (4,545 | 73.0%), local government employees (345 | 5.5%), and state government employees (340 | 5.5%) make up the most common classes of employment.
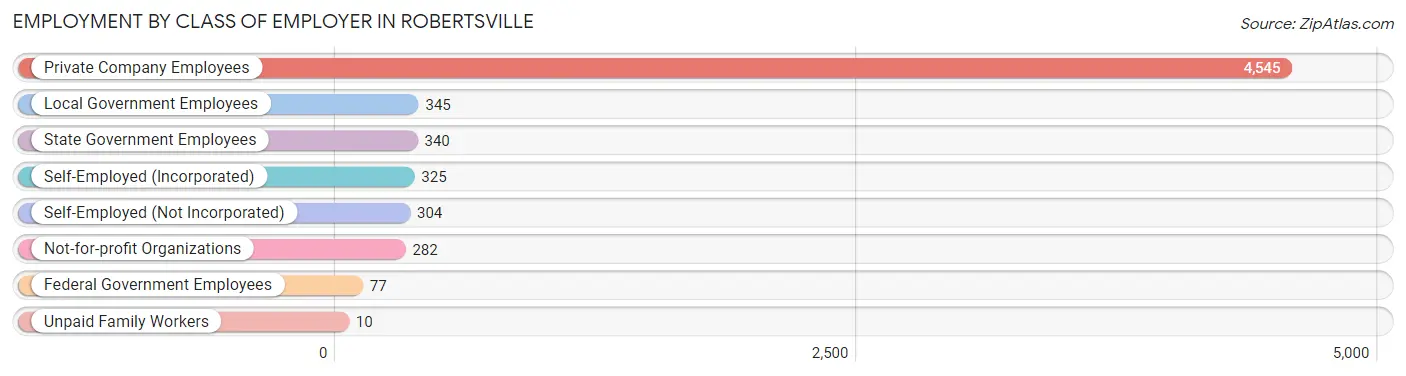
| Employer Class | # Employees | % Employees |
| Private Company Employees | 4,545 | 73.0% |
| Self-Employed (Incorporated) | 325 | 5.2% |
| Self-Employed (Not Incorporated) | 304 | 4.9% |
| Not-for-profit Organizations | 282 | 4.5% |
| Local Government Employees | 345 | 5.5% |
| State Government Employees | 340 | 5.5% |
| Federal Government Employees | 77 | 1.2% |
| Unpaid Family Workers | 10 | 0.2% |
| Total | 6,228 | 100.0% |
Employment Status by Age in Robertsville
According to the labor force statistics for Robertsville, out of the total population over 16 years of age (9,927), 66.8% or 6,631 individuals are in the labor force, with 4.2% or 279 of them unemployed. The age group with the highest labor force participation rate is 30 to 34 years, with 95.0% or 588 individuals in the labor force. Within the labor force, the 16 to 19 years age range has the highest percentage of unemployed individuals, with 20.2% or 33 of them being unemployed.
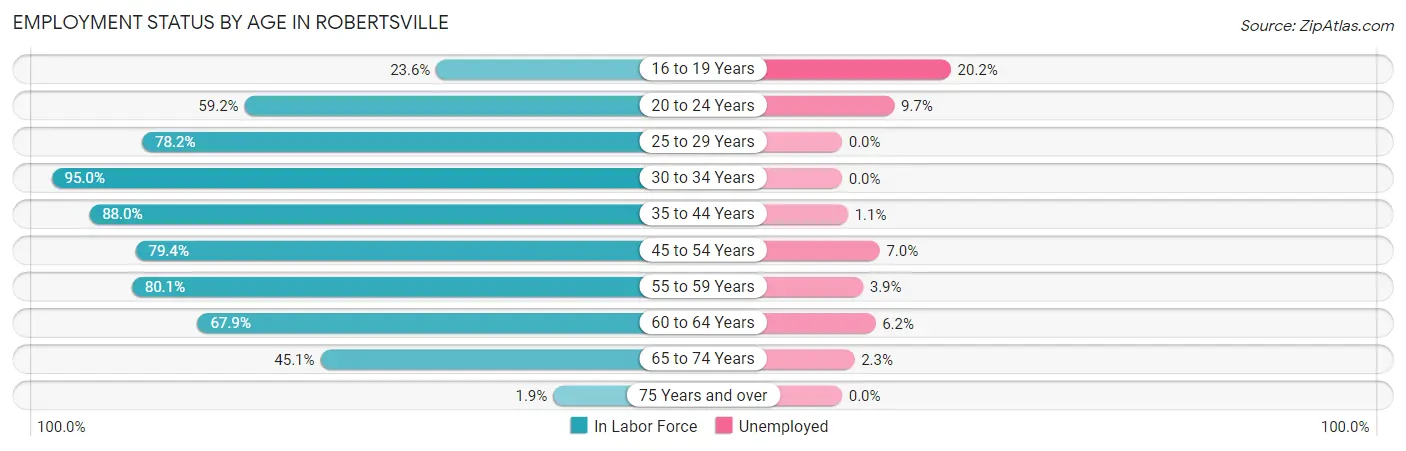
| Age Bracket | In Labor Force | Unemployed |
| 16 to 19 Years | 163 (23.6%) | 33 (20.2%) |
| 20 to 24 Years | 463 (59.2%) | 45 (9.7%) |
| 25 to 29 Years | 743 (78.2%) | 0 (0.0%) |
| 30 to 34 Years | 588 (95.0%) | 0 (0.0%) |
| 35 to 44 Years | 1,357 (88.0%) | 15 (1.1%) |
| 45 to 54 Years | 1,494 (79.4%) | 105 (7.0%) |
| 55 to 59 Years | 649 (80.1%) | 25 (3.9%) |
| 60 to 64 Years | 673 (67.9%) | 42 (6.2%) |
| 65 to 74 Years | 486 (45.1%) | 11 (2.3%) |
| 75 Years and over | 11 (1.9%) | 0 (0.0%) |
| Total | 6,631 (66.8%) | 279 (4.2%) |
Employment Status by Educational Attainment in Robertsville
According to labor force statistics for Robertsville, 81.0% of individuals (5,503) out of the total population between 25 and 64 years of age (6,794) are in the labor force, with 3.4% or 187 of them being unemployed. The group with the highest labor force participation rate are those with the educational attainment of bachelor's degree or higher, with 85.3% or 3,658 individuals in the labor force. Within the labor force, individuals with high school diploma education have the highest percentage of unemployment, with 11.9% or 76 of them being unemployed.
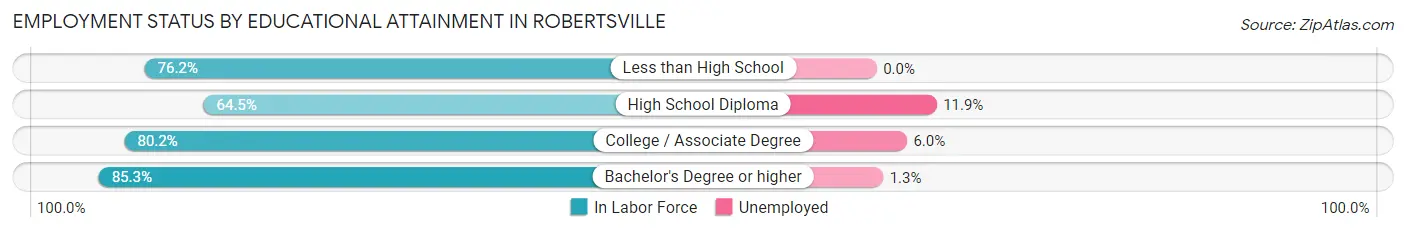
| Educational Attainment | In Labor Force | Unemployed |
| Less than High School | 163 (76.2%) | 0 (0.0%) |
| High School Diploma | 637 (64.5%) | 117 (11.9%) |
| College / Associate Degree | 1,047 (80.2%) | 78 (6.0%) |
| Bachelor's Degree or higher | 3,658 (85.3%) | 56 (1.3%) |
| Total | 5,503 (81.0%) | 231 (3.4%) |
Employment Occupations by Sex in Robertsville
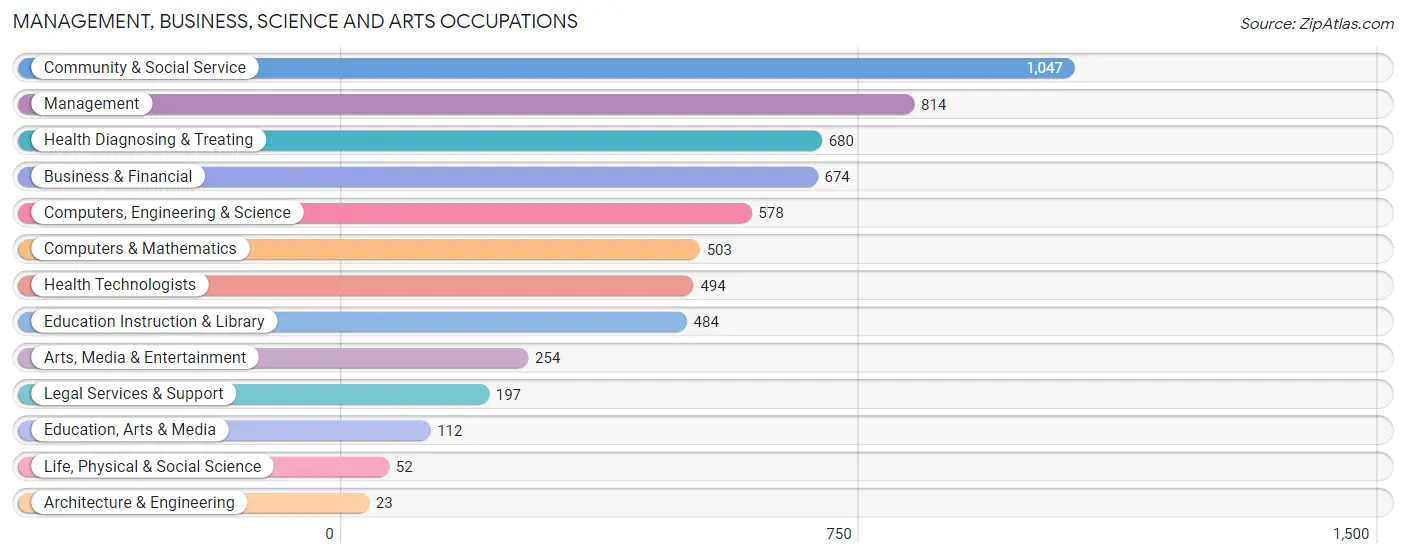
Management, Business, Science and Arts Occupations
The most common Management, Business, Science and Arts occupations in Robertsville are Community & Social Service (1,047 | 16.5%), Management (814 | 12.8%), Health Diagnosing & Treating (680 | 10.7%), Business & Financial (674 | 10.6%), and Computers, Engineering & Science (578 | 9.1%).
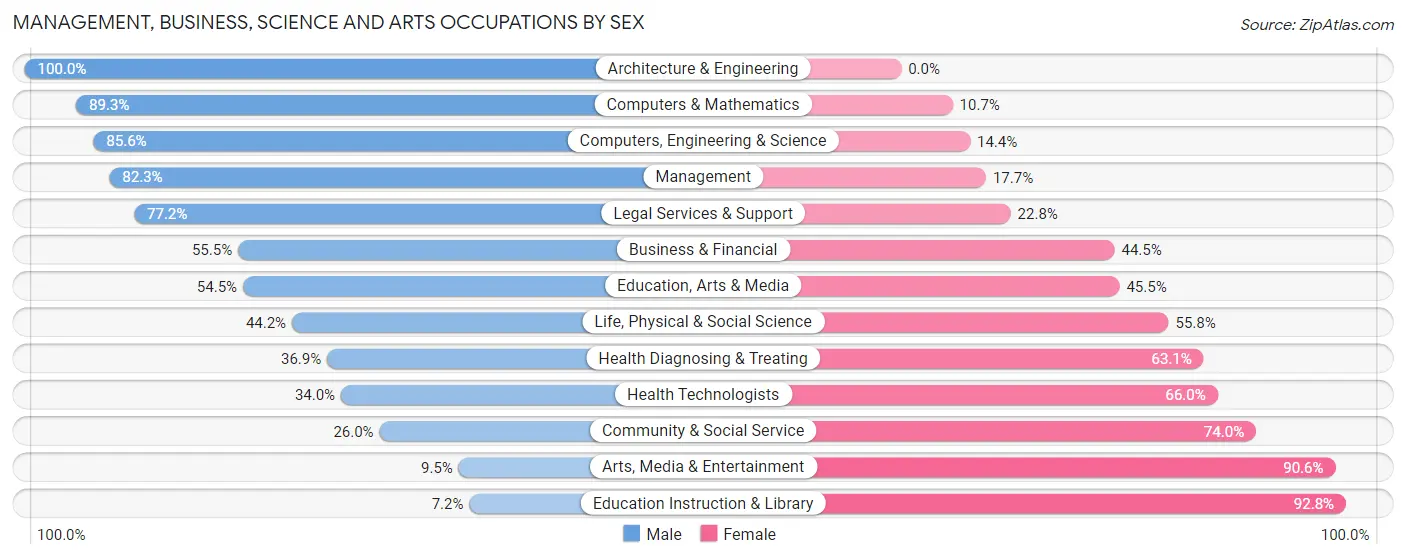
Management, Business, Science and Arts Occupations by Sex
Within the Management, Business, Science and Arts occupations in Robertsville, the most male-oriented occupations are Architecture & Engineering (100.0%), Computers & Mathematics (89.3%), and Computers, Engineering & Science (85.6%), while the most female-oriented occupations are Education Instruction & Library (92.8%), Arts, Media & Entertainment (90.5%), and Community & Social Service (74.0%).
| Occupation | Male | Female |
| Management | 670 (82.3%) | 144 (17.7%) |
| Business & Financial | 374 (55.5%) | 300 (44.5%) |
| Computers, Engineering & Science | 495 (85.6%) | 83 (14.4%) |
| Computers & Mathematics | 449 (89.3%) | 54 (10.7%) |
| Architecture & Engineering | 23 (100.0%) | 0 (0.0%) |
| Life, Physical & Social Science | 23 (44.2%) | 29 (55.8%) |
| Community & Social Service | 272 (26.0%) | 775 (74.0%) |
| Education, Arts & Media | 61 (54.5%) | 51 (45.5%) |
| Legal Services & Support | 152 (77.2%) | 45 (22.8%) |
| Education Instruction & Library | 35 (7.2%) | 449 (92.8%) |
| Arts, Media & Entertainment | 24 (9.5%) | 230 (90.5%) |
| Health Diagnosing & Treating | 251 (36.9%) | 429 (63.1%) |
| Health Technologists | 168 (34.0%) | 326 (66.0%) |
| Total (Category) | 2,062 (54.4%) | 1,731 (45.6%) |
| Total (Overall) | 3,414 (53.8%) | 2,937 (46.2%) |
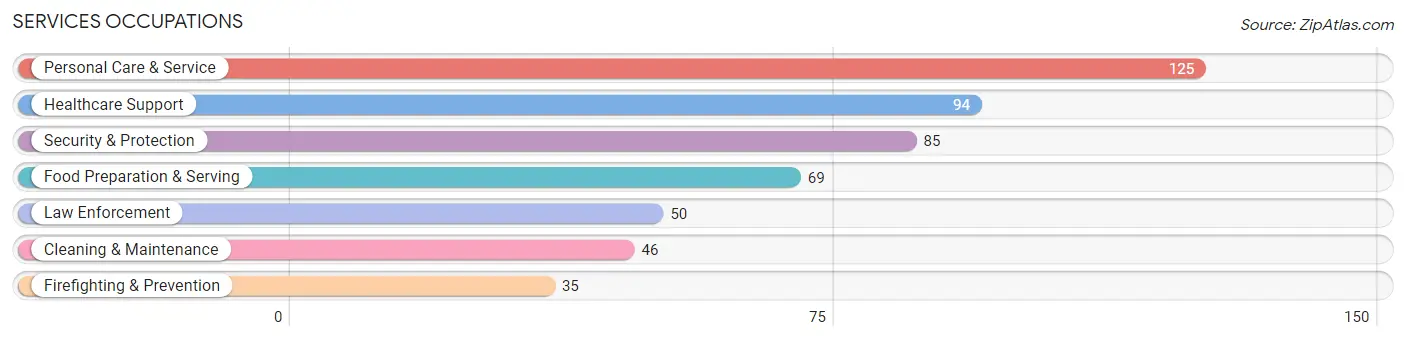
Services Occupations
The most common Services occupations in Robertsville are Personal Care & Service (125 | 2.0%), Healthcare Support (94 | 1.5%), Security & Protection (85 | 1.3%), Food Preparation & Serving (69 | 1.1%), and Law Enforcement (50 | 0.8%).
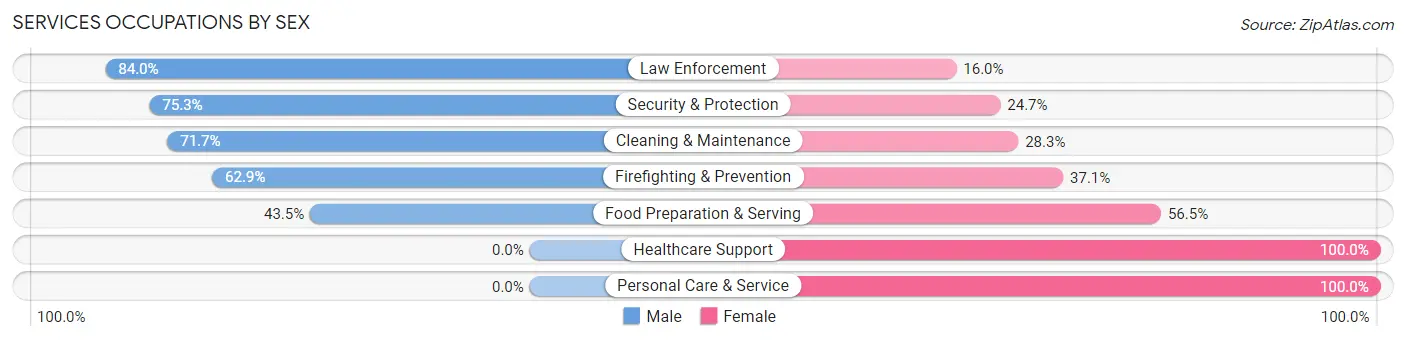
Services Occupations by Sex
Within the Services occupations in Robertsville, the most male-oriented occupations are Law Enforcement (84.0%), Security & Protection (75.3%), and Cleaning & Maintenance (71.7%), while the most female-oriented occupations are Healthcare Support (100.0%), Personal Care & Service (100.0%), and Food Preparation & Serving (56.5%).
| Occupation | Male | Female |
| Healthcare Support | 0 (0.0%) | 94 (100.0%) |
| Security & Protection | 64 (75.3%) | 21 (24.7%) |
| Firefighting & Prevention | 22 (62.9%) | 13 (37.1%) |
| Law Enforcement | 42 (84.0%) | 8 (16.0%) |
| Food Preparation & Serving | 30 (43.5%) | 39 (56.5%) |
| Cleaning & Maintenance | 33 (71.7%) | 13 (28.3%) |
| Personal Care & Service | 0 (0.0%) | 125 (100.0%) |
| Total (Category) | 127 (30.3%) | 292 (69.7%) |
| Total (Overall) | 3,414 (53.8%) | 2,937 (46.2%) |
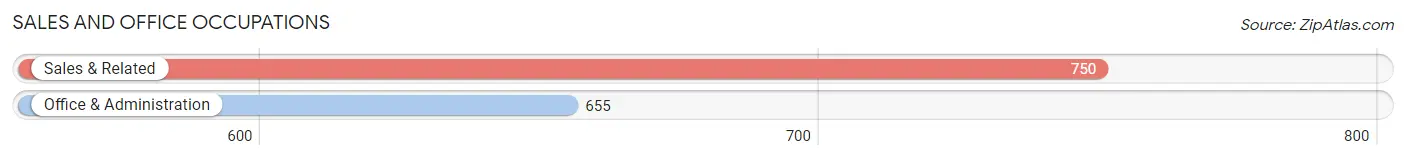
Sales and Office Occupations
The most common Sales and Office occupations in Robertsville are Sales & Related (750 | 11.8%), and Office & Administration (655 | 10.3%).
Sales and Office Occupations by Sex
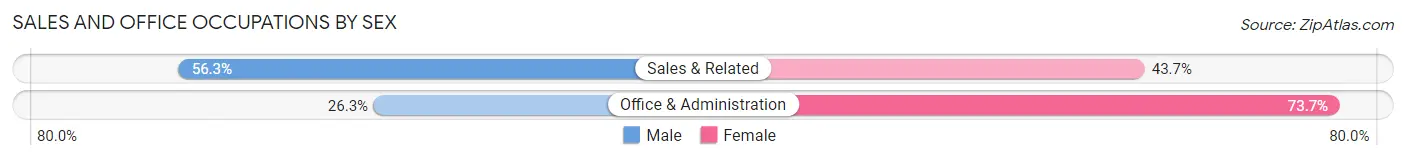
| Occupation | Male | Female |
| Sales & Related | 422 (56.3%) | 328 (43.7%) |
| Office & Administration | 172 (26.3%) | 483 (73.7%) |
| Total (Category) | 594 (42.3%) | 811 (57.7%) |
| Total (Overall) | 3,414 (53.8%) | 2,937 (46.2%) |
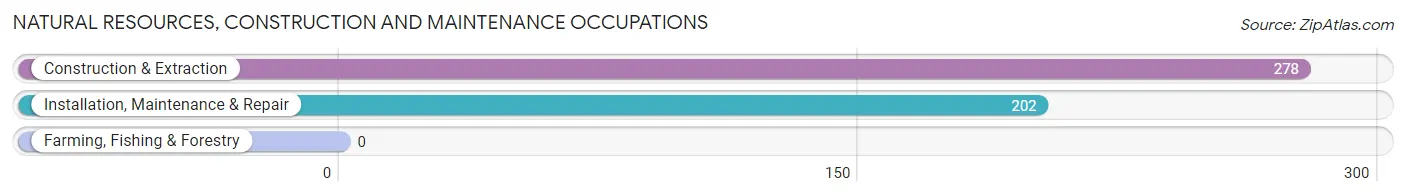
Natural Resources, Construction and Maintenance Occupations
The most common Natural Resources, Construction and Maintenance occupations in Robertsville are Construction & Extraction (278 | 4.4%), and Installation, Maintenance & Repair (202 | 3.2%).
Natural Resources, Construction and Maintenance Occupations by Sex
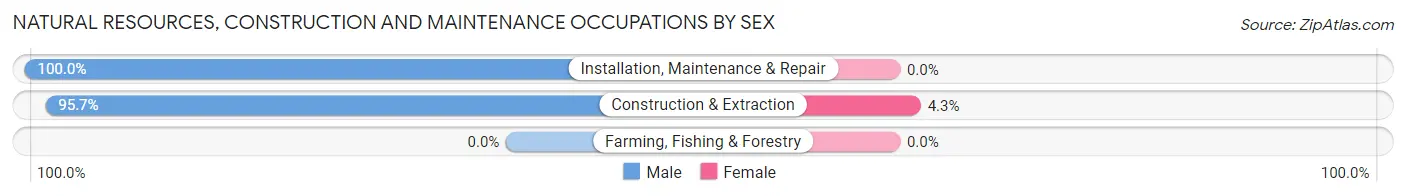
| Occupation | Male | Female |
| Farming, Fishing & Forestry | 0 (0.0%) | 0 (0.0%) |
| Construction & Extraction | 266 (95.7%) | 12 (4.3%) |
| Installation, Maintenance & Repair | 202 (100.0%) | 0 (0.0%) |
| Total (Category) | 468 (97.5%) | 12 (2.5%) |
| Total (Overall) | 3,414 (53.8%) | 2,937 (46.2%) |
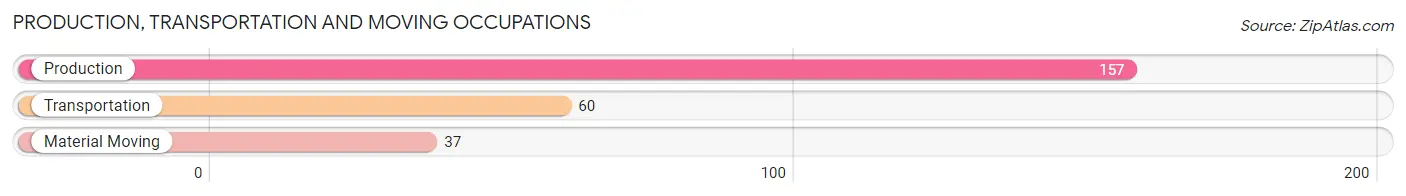
Production, Transportation and Moving Occupations
The most common Production, Transportation and Moving occupations in Robertsville are Production (157 | 2.5%), Transportation (60 | 0.9%), and Material Moving (37 | 0.6%).
Production, Transportation and Moving Occupations by Sex
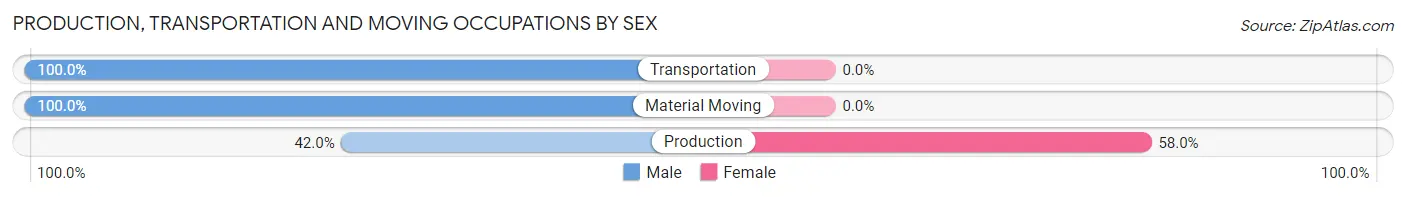
| Occupation | Male | Female |
| Production | 66 (42.0%) | 91 (58.0%) |
| Transportation | 60 (100.0%) | 0 (0.0%) |
| Material Moving | 37 (100.0%) | 0 (0.0%) |
| Total (Category) | 163 (64.2%) | 91 (35.8%) |
| Total (Overall) | 3,414 (53.8%) | 2,937 (46.2%) |
Employment Industries by Sex in Robertsville
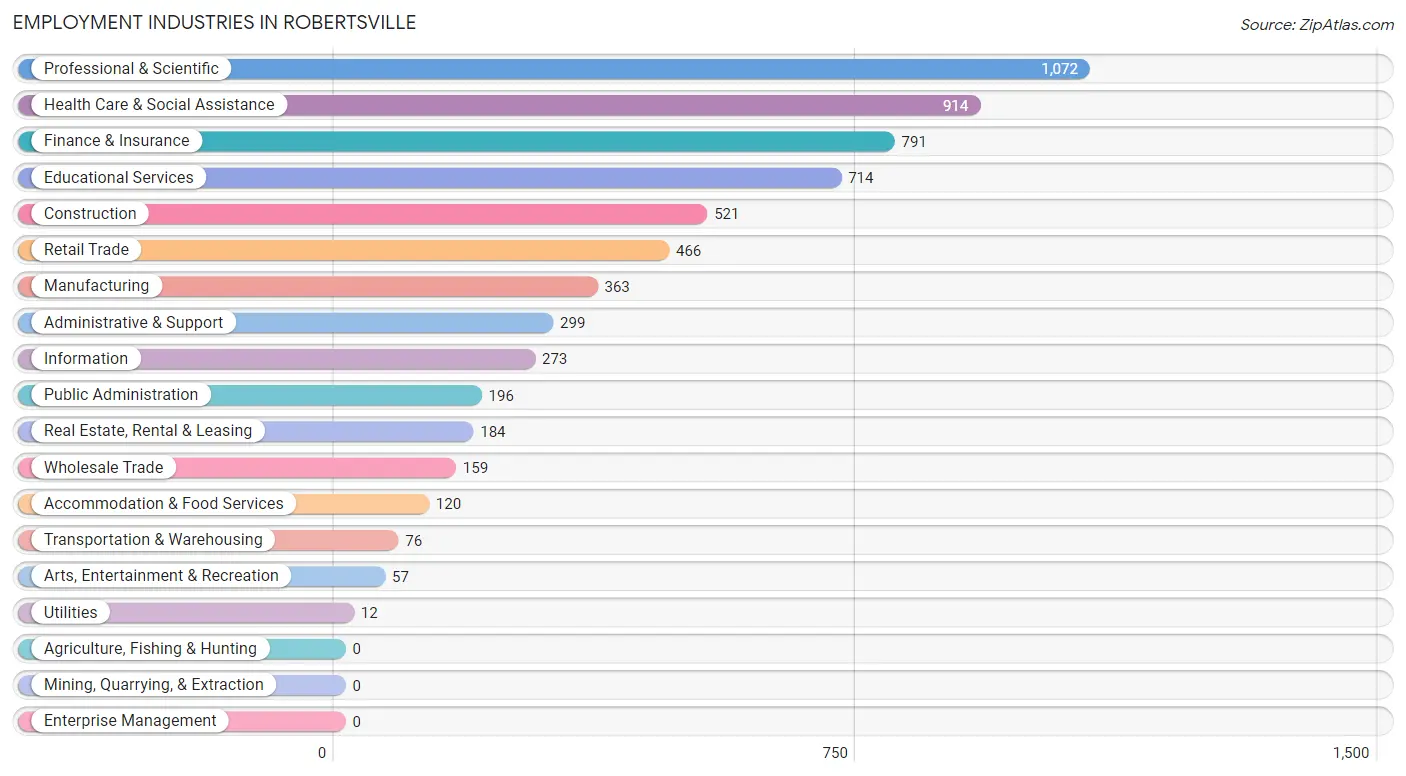
Employment Industries in Robertsville
The major employment industries in Robertsville include Professional & Scientific (1,072 | 16.9%), Health Care & Social Assistance (914 | 14.4%), Finance & Insurance (791 | 12.4%), Educational Services (714 | 11.2%), and Construction (521 | 8.2%).
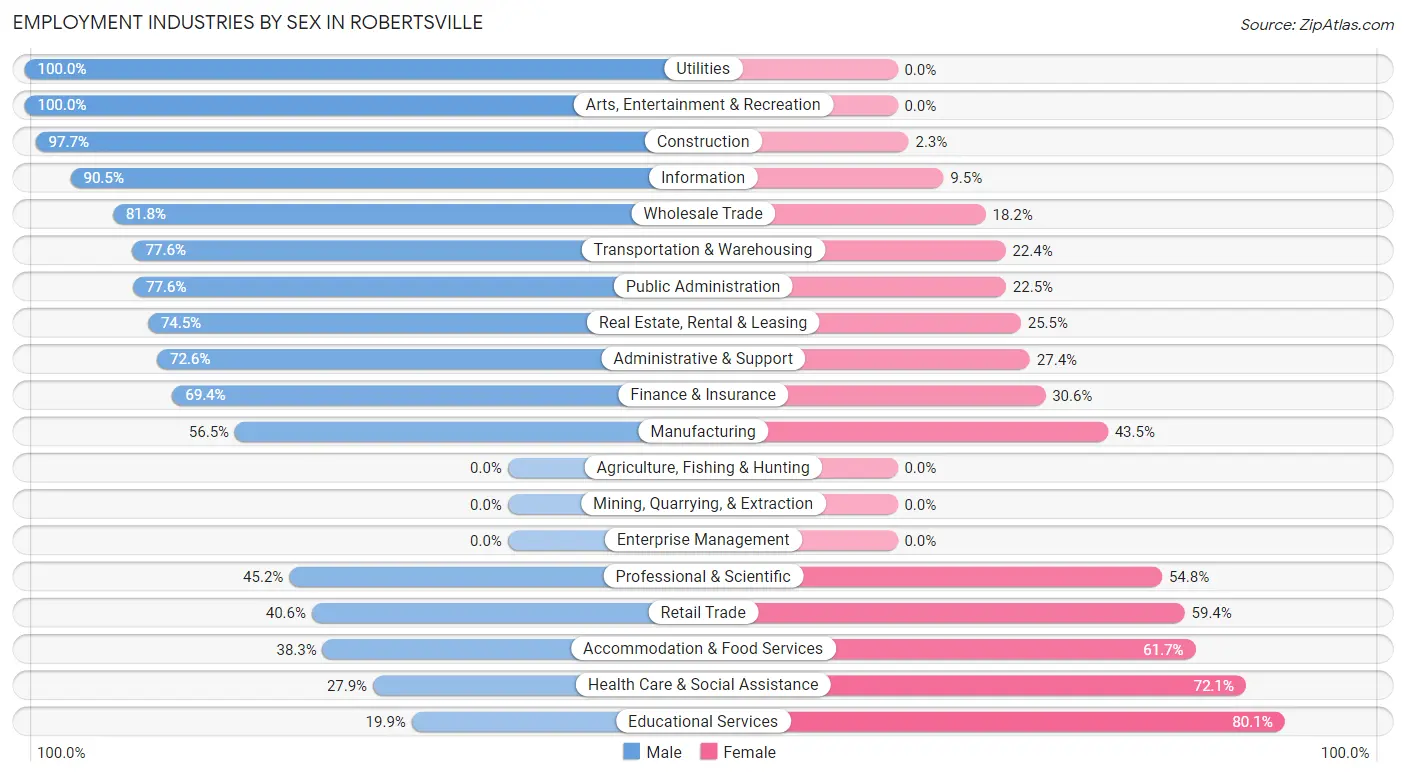
Employment Industries by Sex in Robertsville
The Robertsville industries that see more men than women are Utilities (100.0%), Arts, Entertainment & Recreation (100.0%), and Construction (97.7%), whereas the industries that tend to have a higher number of women are Educational Services (80.1%), Health Care & Social Assistance (72.1%), and Accommodation & Food Services (61.7%).
| Industry | Male | Female |
| Agriculture, Fishing & Hunting | 0 (0.0%) | 0 (0.0%) |
| Mining, Quarrying, & Extraction | 0 (0.0%) | 0 (0.0%) |
| Construction | 509 (97.7%) | 12 (2.3%) |
| Manufacturing | 205 (56.5%) | 158 (43.5%) |
| Wholesale Trade | 130 (81.8%) | 29 (18.2%) |
| Retail Trade | 189 (40.6%) | 277 (59.4%) |
| Transportation & Warehousing | 59 (77.6%) | 17 (22.4%) |
| Utilities | 12 (100.0%) | 0 (0.0%) |
| Information | 247 (90.5%) | 26 (9.5%) |
| Finance & Insurance | 549 (69.4%) | 242 (30.6%) |
| Real Estate, Rental & Leasing | 137 (74.5%) | 47 (25.5%) |
| Professional & Scientific | 485 (45.2%) | 587 (54.8%) |
| Enterprise Management | 0 (0.0%) | 0 (0.0%) |
| Administrative & Support | 217 (72.6%) | 82 (27.4%) |
| Educational Services | 142 (19.9%) | 572 (80.1%) |
| Health Care & Social Assistance | 255 (27.9%) | 659 (72.1%) |
| Arts, Entertainment & Recreation | 57 (100.0%) | 0 (0.0%) |
| Accommodation & Food Services | 46 (38.3%) | 74 (61.7%) |
| Public Administration | 152 (77.5%) | 44 (22.5%) |
| Total | 3,414 (53.8%) | 2,937 (46.2%) |
Education in Robertsville
School Enrollment in Robertsville
The most common levels of schooling among the 3,380 students in Robertsville are high school (955 | 28.2%), college / undergraduate (650 | 19.2%), and elementary school (647 | 19.1%).
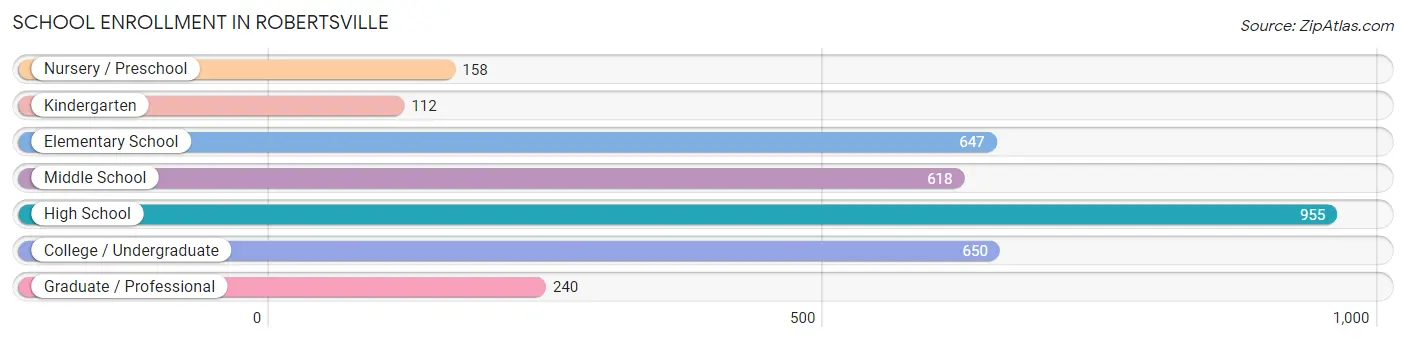
| School Level | # Students | % Students |
| Nursery / Preschool | 158 | 4.7% |
| Kindergarten | 112 | 3.3% |
| Elementary School | 647 | 19.1% |
| Middle School | 618 | 18.3% |
| High School | 955 | 28.2% |
| College / Undergraduate | 650 | 19.2% |
| Graduate / Professional | 240 | 7.1% |
| Total | 3,380 | 100.0% |
School Enrollment by Age by Funding Source in Robertsville
Out of a total of 3,380 students who are enrolled in schools in Robertsville, 433 (12.8%) attend a private institution, while the remaining 2,947 (87.2%) are enrolled in public schools. The age group of 3 to 4 year olds has the highest likelihood of being enrolled in private schools, with 82 (56.6% in the age bracket) enrolled. Conversely, the age group of 10 to 14 year olds has the lowest likelihood of being enrolled in a private school, with 880 (98.9% in the age bracket) attending a public institution.
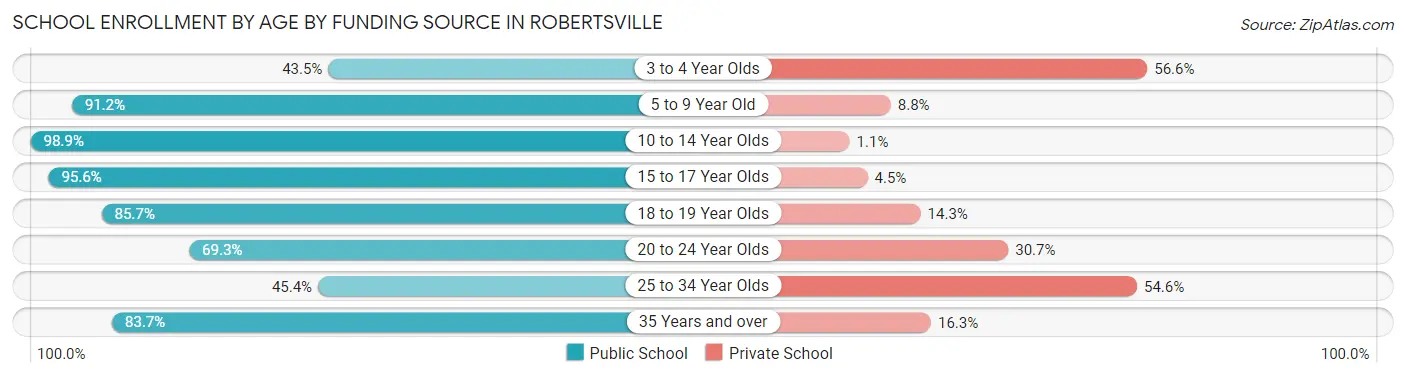
| Age Bracket | Public School | Private School |
| 3 to 4 Year Olds | 63 (43.4%) | 82 (56.6%) |
| 5 to 9 Year Old | 643 (91.2%) | 62 (8.8%) |
| 10 to 14 Year Olds | 880 (98.9%) | 10 (1.1%) |
| 15 to 17 Year Olds | 665 (95.6%) | 31 (4.4%) |
| 18 to 19 Year Olds | 209 (85.7%) | 35 (14.3%) |
| 20 to 24 Year Olds | 303 (69.3%) | 134 (30.7%) |
| 25 to 34 Year Olds | 44 (45.4%) | 53 (54.6%) |
| 35 Years and over | 139 (83.7%) | 27 (16.3%) |
| Total | 2,947 (87.2%) | 433 (12.8%) |
Educational Attainment by Field of Study in Robertsville
Business (1,085 | 21.3%), engineering (549 | 10.8%), social sciences (504 | 9.9%), education (495 | 9.7%), and arts & humanities (375 | 7.3%) are the most common fields of study among 5,102 individuals in Robertsville who have obtained a bachelor's degree or higher.
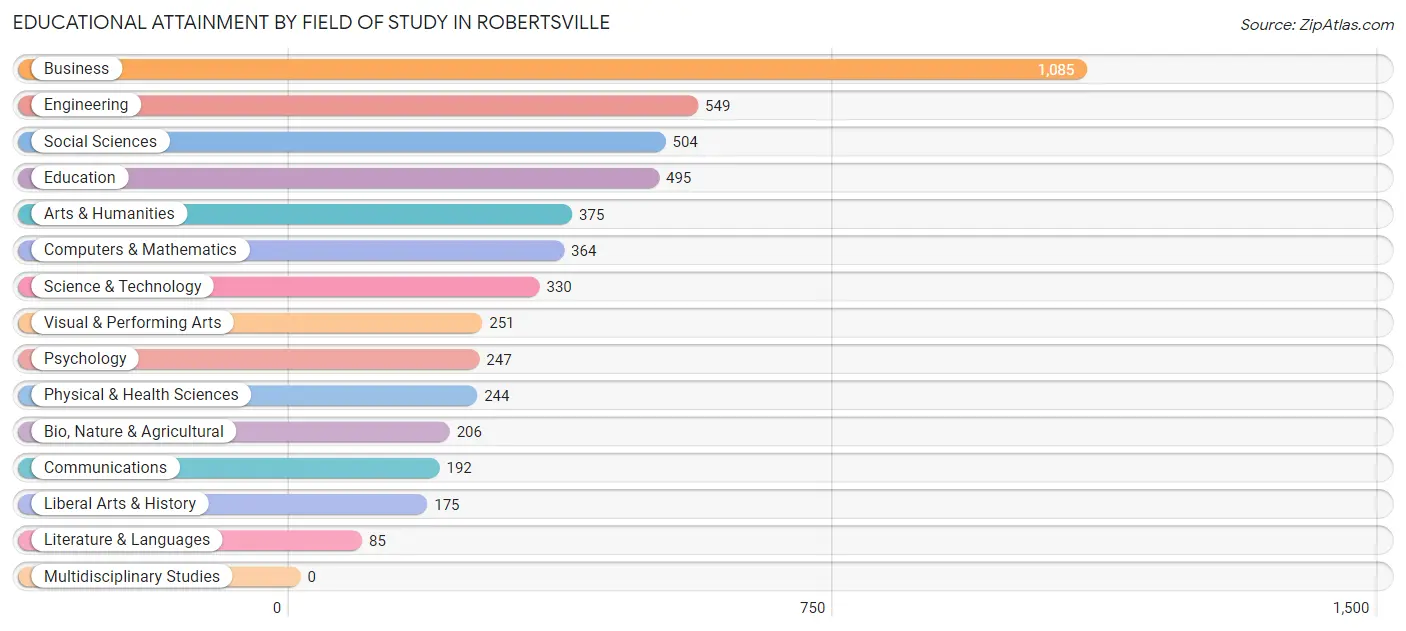
| Field of Study | # Graduates | % Graduates |
| Computers & Mathematics | 364 | 7.1% |
| Bio, Nature & Agricultural | 206 | 4.0% |
| Physical & Health Sciences | 244 | 4.8% |
| Psychology | 247 | 4.8% |
| Social Sciences | 504 | 9.9% |
| Engineering | 549 | 10.8% |
| Multidisciplinary Studies | 0 | 0.0% |
| Science & Technology | 330 | 6.5% |
| Business | 1,085 | 21.3% |
| Education | 495 | 9.7% |
| Literature & Languages | 85 | 1.7% |
| Liberal Arts & History | 175 | 3.4% |
| Visual & Performing Arts | 251 | 4.9% |
| Communications | 192 | 3.8% |
| Arts & Humanities | 375 | 7.3% |
| Total | 5,102 | 100.0% |
Transportation & Commute in Robertsville
Vehicle Availability by Sex in Robertsville
The most prevalent vehicle ownership categories in Robertsville are males with 2 vehicles (1,840, accounting for 54.1%) and females with 2 vehicles (1,498, making up 65.1%).
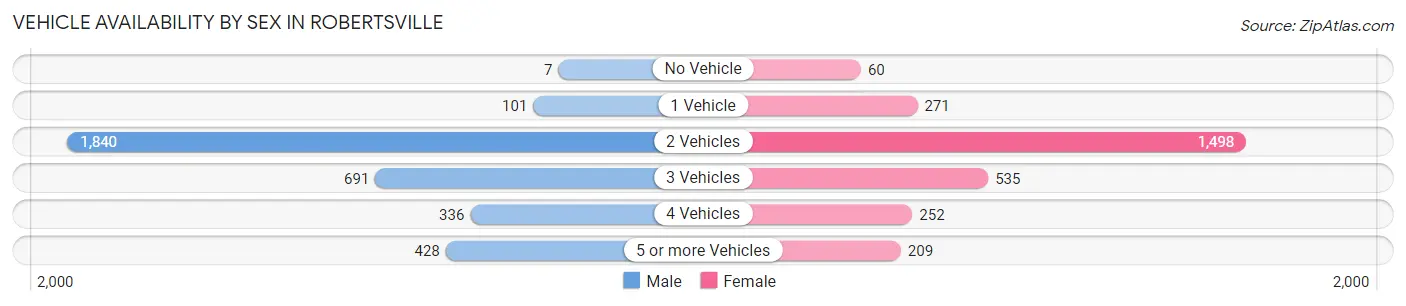
| Vehicles Available | Male | Female |
| No Vehicle | 7 (0.2%) | 60 (2.1%) |
| 1 Vehicle | 101 (3.0%) | 271 (9.6%) |
| 2 Vehicles | 1,840 (54.1%) | 1,498 (53.0%) |
| 3 Vehicles | 691 (20.3%) | 535 (18.9%) |
| 4 Vehicles | 336 (9.9%) | 252 (8.9%) |
| 5 or more Vehicles | 428 (12.6%) | 209 (7.4%) |
| Total | 3,403 (100.0%) | 2,825 (100.0%) |
Commute Time in Robertsville
The most frequently occuring commute durations in Robertsville are 90 or more minutes (742 commuters, 14.9%), 45 to 59 minutes (707 commuters, 14.2%), and 60 to 89 minutes (688 commuters, 13.8%).
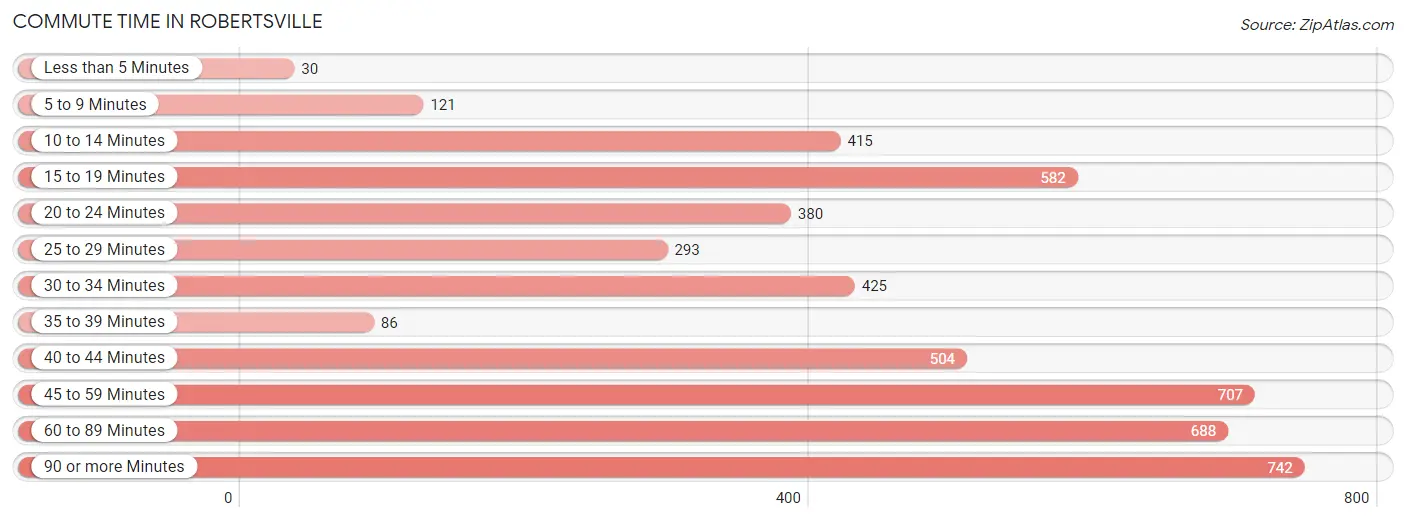
| Commute Time | # Commuters | % Commuters |
| Less than 5 Minutes | 30 | 0.6% |
| 5 to 9 Minutes | 121 | 2.4% |
| 10 to 14 Minutes | 415 | 8.4% |
| 15 to 19 Minutes | 582 | 11.7% |
| 20 to 24 Minutes | 380 | 7.6% |
| 25 to 29 Minutes | 293 | 5.9% |
| 30 to 34 Minutes | 425 | 8.6% |
| 35 to 39 Minutes | 86 | 1.7% |
| 40 to 44 Minutes | 504 | 10.1% |
| 45 to 59 Minutes | 707 | 14.2% |
| 60 to 89 Minutes | 688 | 13.8% |
| 90 or more Minutes | 742 | 14.9% |
Commute Time by Sex in Robertsville
The most common commute times in Robertsville are 90 or more minutes (658 commuters, 23.8%) for males and 10 to 14 minutes (325 commuters, 14.7%) for females.
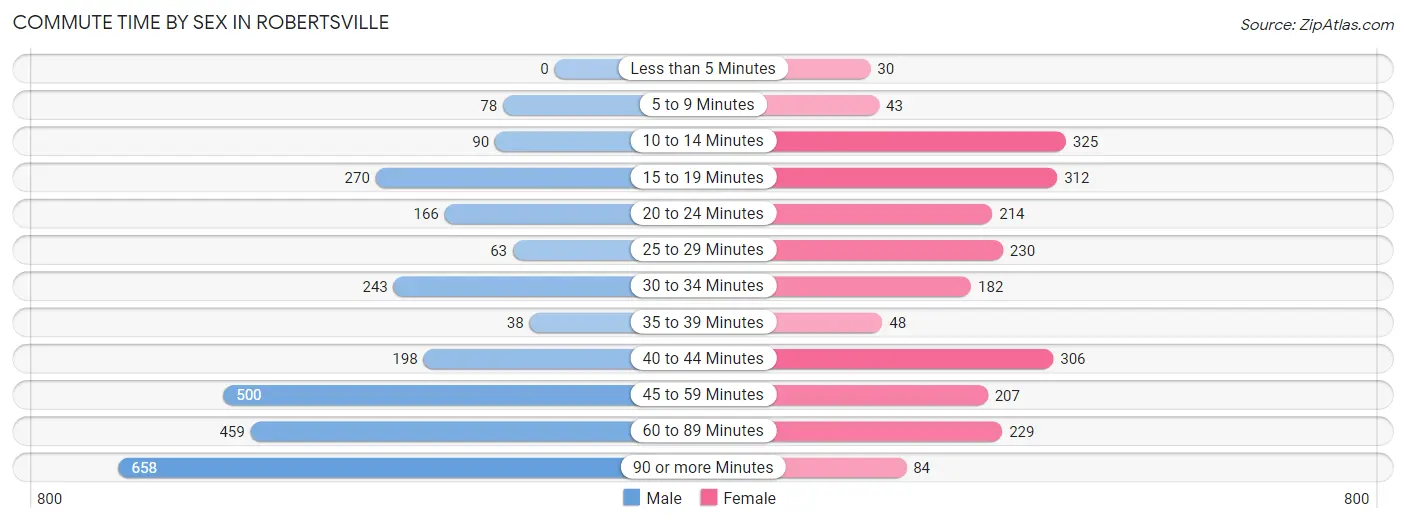
| Commute Time | Male | Female |
| Less than 5 Minutes | 0 (0.0%) | 30 (1.4%) |
| 5 to 9 Minutes | 78 (2.8%) | 43 (1.9%) |
| 10 to 14 Minutes | 90 (3.3%) | 325 (14.7%) |
| 15 to 19 Minutes | 270 (9.8%) | 312 (14.1%) |
| 20 to 24 Minutes | 166 (6.0%) | 214 (9.7%) |
| 25 to 29 Minutes | 63 (2.3%) | 230 (10.4%) |
| 30 to 34 Minutes | 243 (8.8%) | 182 (8.2%) |
| 35 to 39 Minutes | 38 (1.4%) | 48 (2.2%) |
| 40 to 44 Minutes | 198 (7.2%) | 306 (13.9%) |
| 45 to 59 Minutes | 500 (18.1%) | 207 (9.4%) |
| 60 to 89 Minutes | 459 (16.6%) | 229 (10.4%) |
| 90 or more Minutes | 658 (23.8%) | 84 (3.8%) |
Time of Departure to Work by Sex in Robertsville
The most frequent times of departure to work in Robertsville are 7:00 AM to 7:29 AM (466, 16.9%) for males and 7:00 AM to 7:29 AM (452, 20.4%) for females.
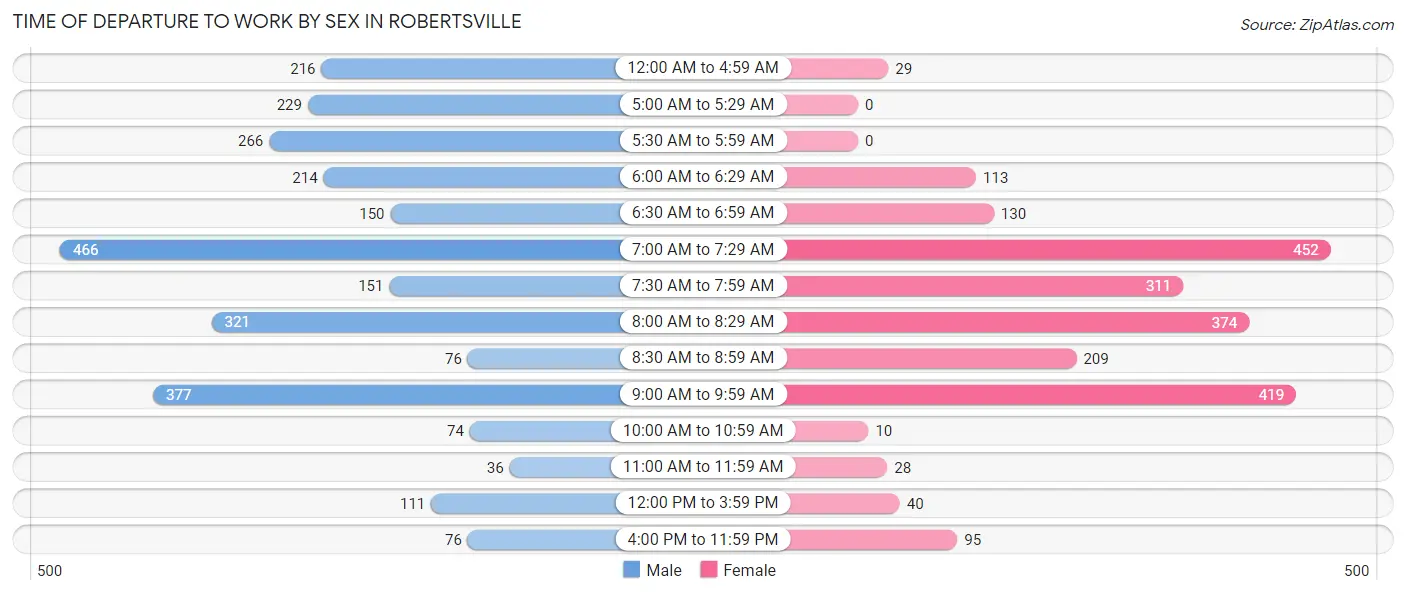
| Time of Departure | Male | Female |
| 12:00 AM to 4:59 AM | 216 (7.8%) | 29 (1.3%) |
| 5:00 AM to 5:29 AM | 229 (8.3%) | 0 (0.0%) |
| 5:30 AM to 5:59 AM | 266 (9.6%) | 0 (0.0%) |
| 6:00 AM to 6:29 AM | 214 (7.7%) | 113 (5.1%) |
| 6:30 AM to 6:59 AM | 150 (5.4%) | 130 (5.9%) |
| 7:00 AM to 7:29 AM | 466 (16.9%) | 452 (20.4%) |
| 7:30 AM to 7:59 AM | 151 (5.5%) | 311 (14.1%) |
| 8:00 AM to 8:29 AM | 321 (11.6%) | 374 (16.9%) |
| 8:30 AM to 8:59 AM | 76 (2.8%) | 209 (9.5%) |
| 9:00 AM to 9:59 AM | 377 (13.6%) | 419 (19.0%) |
| 10:00 AM to 10:59 AM | 74 (2.7%) | 10 (0.4%) |
| 11:00 AM to 11:59 AM | 36 (1.3%) | 28 (1.3%) |
| 12:00 PM to 3:59 PM | 111 (4.0%) | 40 (1.8%) |
| 4:00 PM to 11:59 PM | 76 (2.8%) | 95 (4.3%) |
| Total | 2,763 (100.0%) | 2,210 (100.0%) |
Housing Occupancy in Robertsville
Occupancy by Ownership in Robertsville
Of the total 4,099 dwellings in Robertsville, owner-occupied units account for 3,759 (91.7%), while renter-occupied units make up 340 (8.3%).
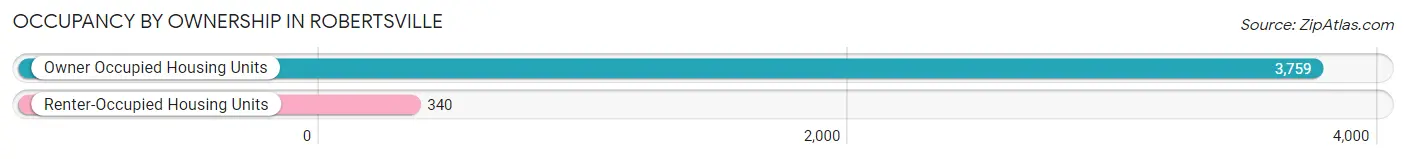
| Occupancy | # Housing Units | % Housing Units |
| Owner Occupied Housing Units | 3,759 | 91.7% |
| Renter-Occupied Housing Units | 340 | 8.3% |
| Total Occupied Housing Units | 4,099 | 100.0% |
Occupancy by Household Size in Robertsville
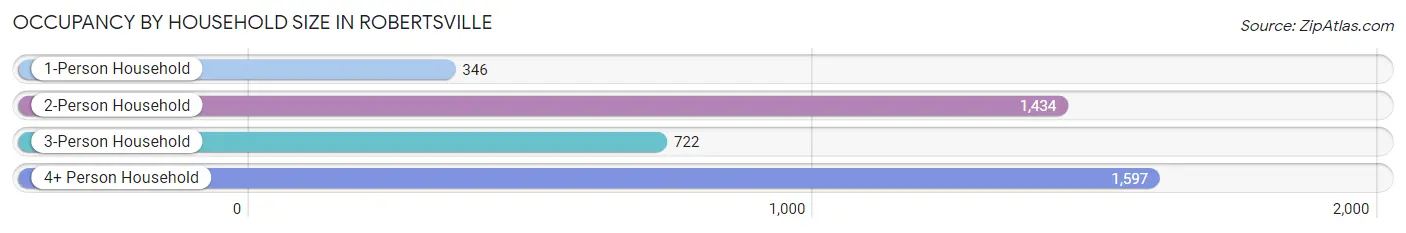
| Household Size | # Housing Units | % Housing Units |
| 1-Person Household | 346 | 8.4% |
| 2-Person Household | 1,434 | 35.0% |
| 3-Person Household | 722 | 17.6% |
| 4+ Person Household | 1,597 | 39.0% |
| Total Housing Units | 4,099 | 100.0% |
Occupancy by Ownership by Household Size in Robertsville
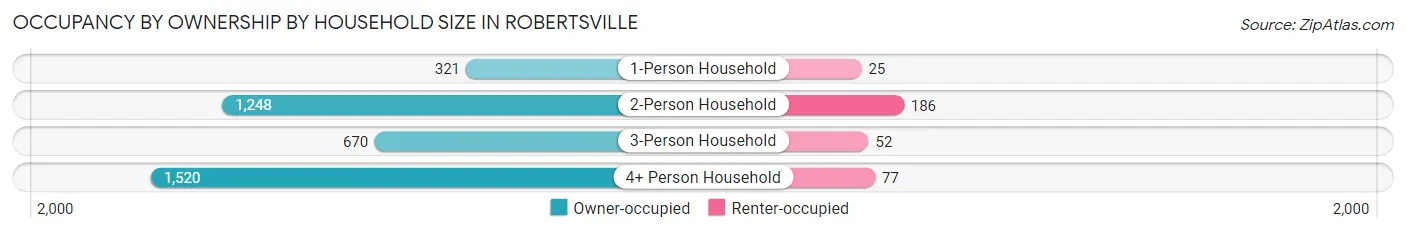
| Household Size | Owner-occupied | Renter-occupied |
| 1-Person Household | 321 (92.8%) | 25 (7.2%) |
| 2-Person Household | 1,248 (87.0%) | 186 (13.0%) |
| 3-Person Household | 670 (92.8%) | 52 (7.2%) |
| 4+ Person Household | 1,520 (95.2%) | 77 (4.8%) |
| Total Housing Units | 3,759 (91.7%) | 340 (8.3%) |
Occupancy by Educational Attainment in Robertsville
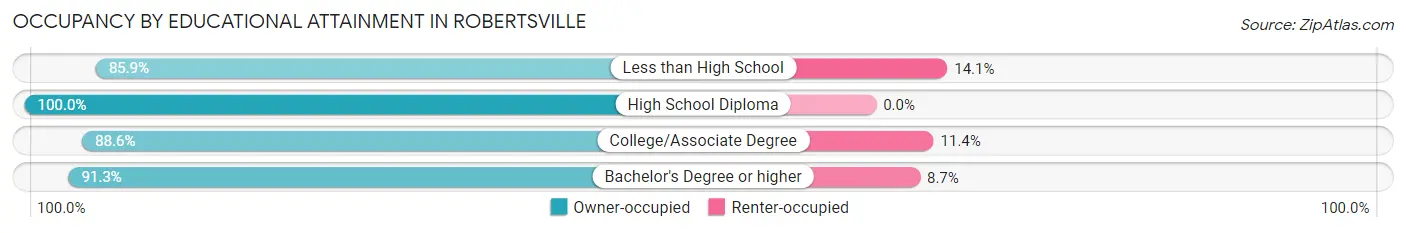
| Household Size | Owner-occupied | Renter-occupied |
| Less than High School | 207 (85.9%) | 34 (14.1%) |
| High School Diploma | 599 (100.0%) | 0 (0.0%) |
| College/Associate Degree | 739 (88.6%) | 95 (11.4%) |
| Bachelor's Degree or higher | 2,214 (91.3%) | 211 (8.7%) |
Occupancy by Age of Householder in Robertsville
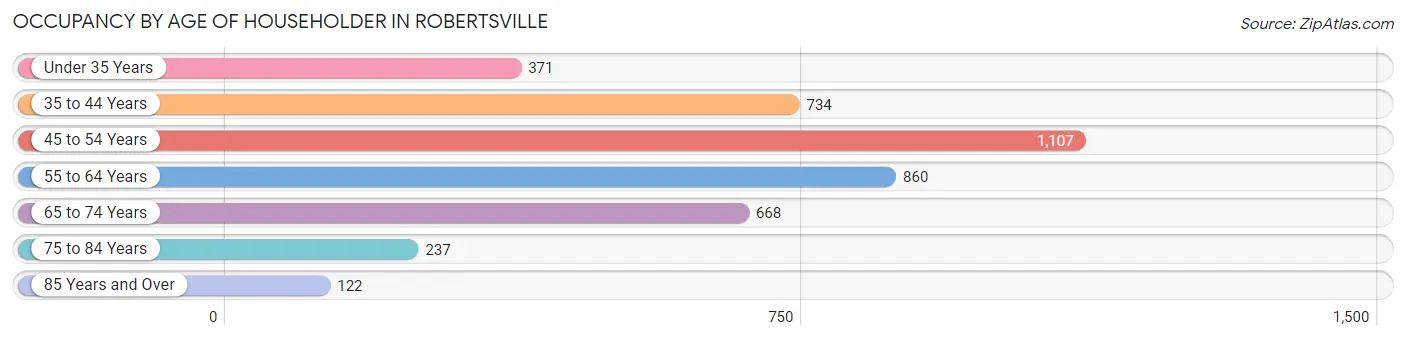
| Age Bracket | # Households | % Households |
| Under 35 Years | 371 | 9.0% |
| 35 to 44 Years | 734 | 17.9% |
| 45 to 54 Years | 1,107 | 27.0% |
| 55 to 64 Years | 860 | 21.0% |
| 65 to 74 Years | 668 | 16.3% |
| 75 to 84 Years | 237 | 5.8% |
| 85 Years and Over | 122 | 3.0% |
| Total | 4,099 | 100.0% |
Housing Finances in Robertsville
Median Income by Occupancy in Robertsville
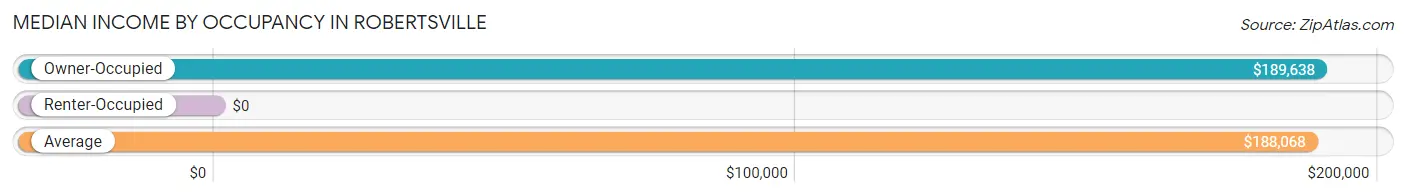
| Occupancy Type | # Households | Median Income |
| Owner-Occupied | 3,759 (91.7%) | $189,638 |
| Renter-Occupied | 340 (8.3%) | $0 |
| Average | 4,099 (100.0%) | $188,068 |
Occupancy by Householder Income Bracket in Robertsville
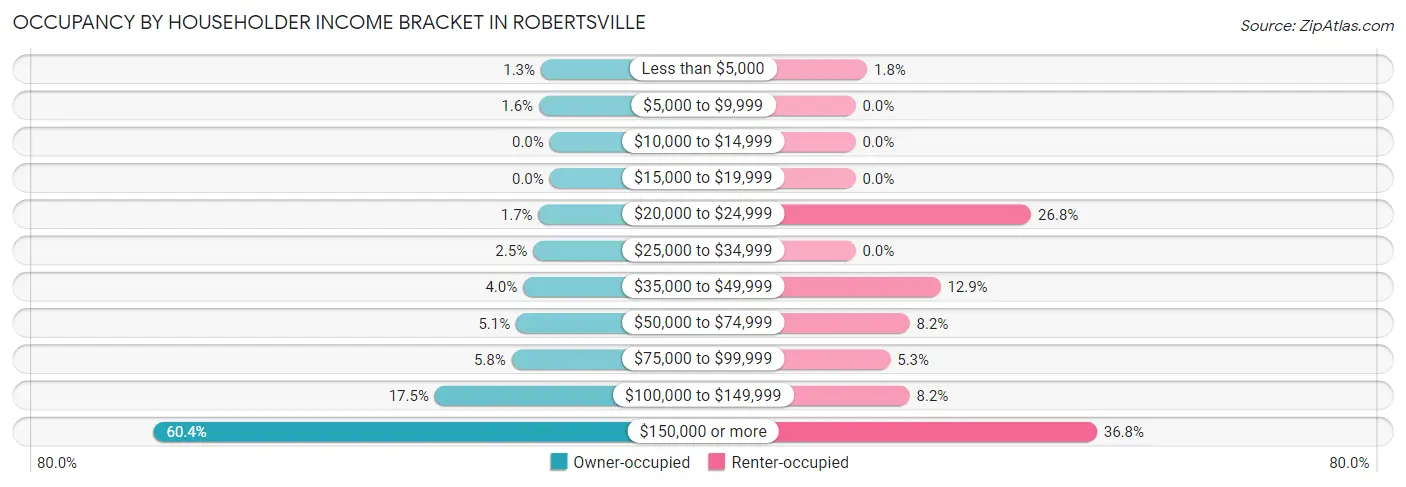
| Income Bracket | Owner-occupied | Renter-occupied |
| Less than $5,000 | 50 (1.3%) | 6 (1.8%) |
| $5,000 to $9,999 | 61 (1.6%) | 0 (0.0%) |
| $10,000 to $14,999 | 0 (0.0%) | 0 (0.0%) |
| $15,000 to $19,999 | 0 (0.0%) | 0 (0.0%) |
| $20,000 to $24,999 | 64 (1.7%) | 91 (26.8%) |
| $25,000 to $34,999 | 95 (2.5%) | 0 (0.0%) |
| $35,000 to $49,999 | 152 (4.0%) | 44 (12.9%) |
| $50,000 to $74,999 | 192 (5.1%) | 28 (8.2%) |
| $75,000 to $99,999 | 218 (5.8%) | 18 (5.3%) |
| $100,000 to $149,999 | 658 (17.5%) | 28 (8.2%) |
| $150,000 or more | 2,269 (60.4%) | 125 (36.8%) |
| Total | 3,759 (100.0%) | 340 (100.0%) |
Monthly Housing Cost Tiers in Robertsville
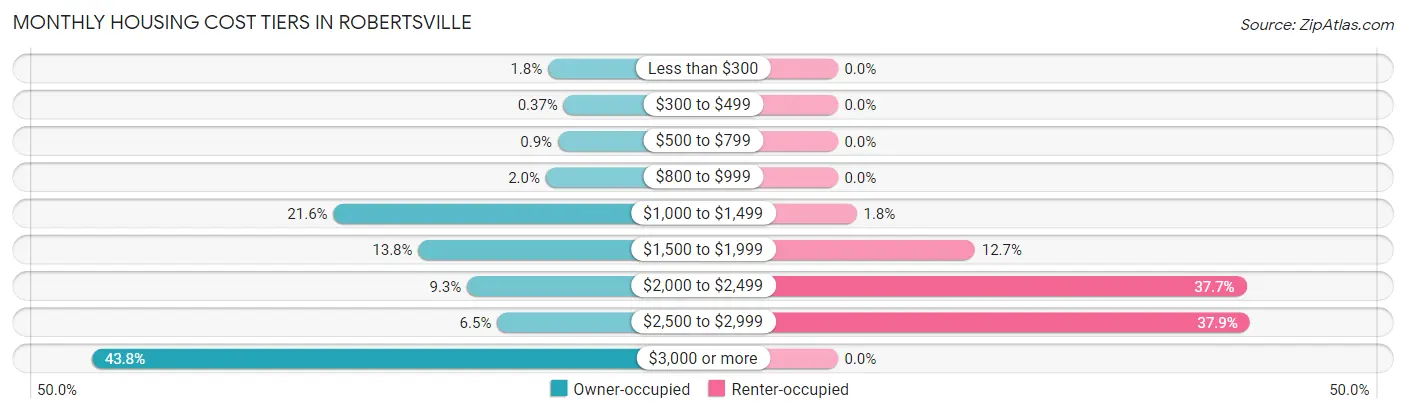
| Monthly Cost | Owner-occupied | Renter-occupied |
| Less than $300 | 68 (1.8%) | 0 (0.0%) |
| $300 to $499 | 14 (0.4%) | 0 (0.0%) |
| $500 to $799 | 34 (0.9%) | 0 (0.0%) |
| $800 to $999 | 76 (2.0%) | 0 (0.0%) |
| $1,000 to $1,499 | 811 (21.6%) | 6 (1.8%) |
| $1,500 to $1,999 | 517 (13.8%) | 43 (12.7%) |
| $2,000 to $2,499 | 348 (9.3%) | 128 (37.7%) |
| $2,500 to $2,999 | 244 (6.5%) | 129 (37.9%) |
| $3,000 or more | 1,647 (43.8%) | 0 (0.0%) |
| Total | 3,759 (100.0%) | 340 (100.0%) |
Physical Housing Characteristics in Robertsville
Housing Structures in Robertsville
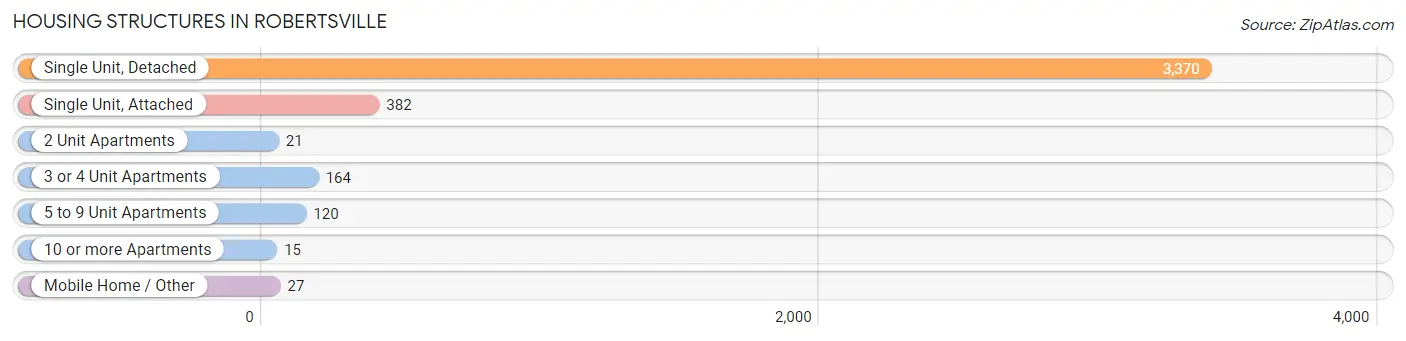
| Structure Type | # Housing Units | % Housing Units |
| Single Unit, Detached | 3,370 | 82.2% |
| Single Unit, Attached | 382 | 9.3% |
| 2 Unit Apartments | 21 | 0.5% |
| 3 or 4 Unit Apartments | 164 | 4.0% |
| 5 to 9 Unit Apartments | 120 | 2.9% |
| 10 or more Apartments | 15 | 0.4% |
| Mobile Home / Other | 27 | 0.7% |
| Total | 4,099 | 100.0% |
Housing Structures by Occupancy in Robertsville
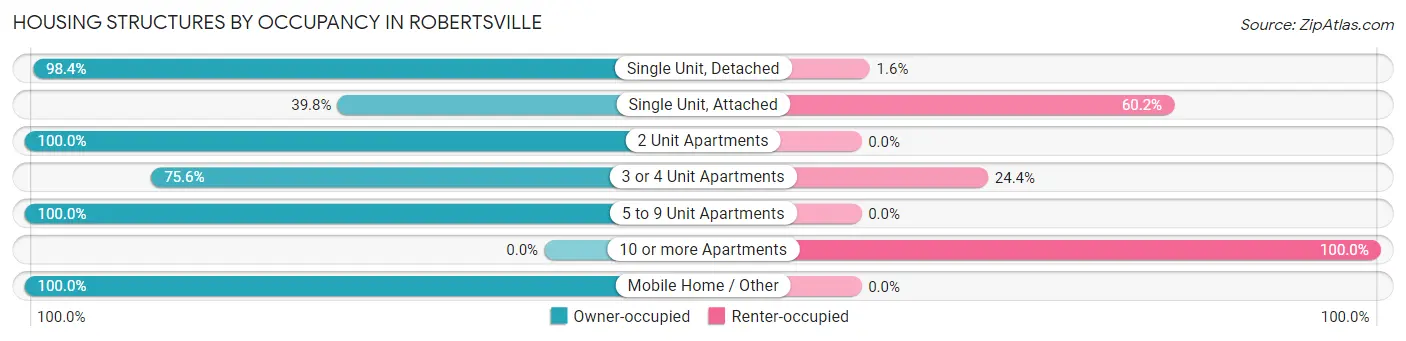
| Structure Type | Owner-occupied | Renter-occupied |
| Single Unit, Detached | 3,315 (98.4%) | 55 (1.6%) |
| Single Unit, Attached | 152 (39.8%) | 230 (60.2%) |
| 2 Unit Apartments | 21 (100.0%) | 0 (0.0%) |
| 3 or 4 Unit Apartments | 124 (75.6%) | 40 (24.4%) |
| 5 to 9 Unit Apartments | 120 (100.0%) | 0 (0.0%) |
| 10 or more Apartments | 0 (0.0%) | 15 (100.0%) |
| Mobile Home / Other | 27 (100.0%) | 0 (0.0%) |
| Total | 3,759 (91.7%) | 340 (8.3%) |
Housing Structures by Number of Rooms in Robertsville
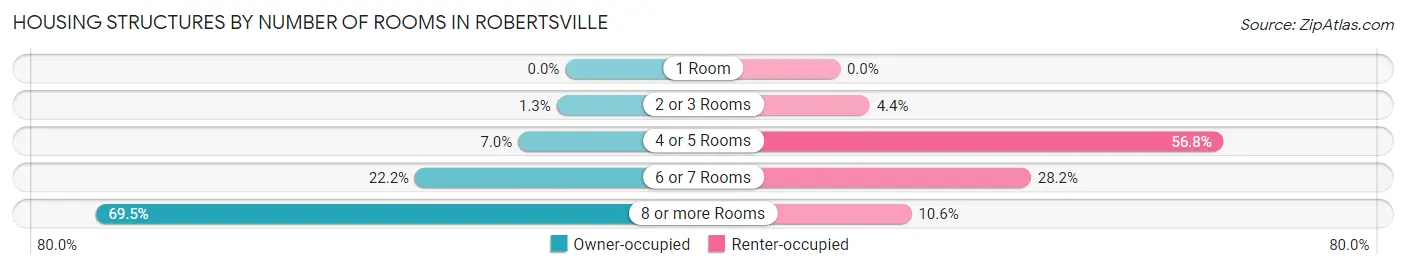
| Number of Rooms | Owner-occupied | Renter-occupied |
| 1 Room | 0 (0.0%) | 0 (0.0%) |
| 2 or 3 Rooms | 48 (1.3%) | 15 (4.4%) |
| 4 or 5 Rooms | 262 (7.0%) | 193 (56.8%) |
| 6 or 7 Rooms | 836 (22.2%) | 96 (28.2%) |
| 8 or more Rooms | 2,613 (69.5%) | 36 (10.6%) |
| Total | 3,759 (100.0%) | 340 (100.0%) |
Housing Structure by Heating Type in Robertsville
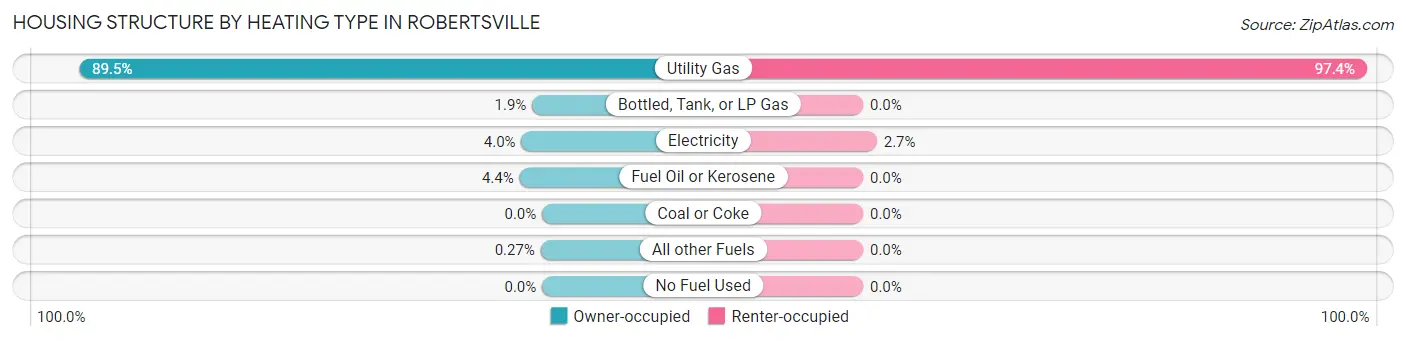
| Heating Type | Owner-occupied | Renter-occupied |
| Utility Gas | 3,363 (89.5%) | 331 (97.4%) |
| Bottled, Tank, or LP Gas | 72 (1.9%) | 0 (0.0%) |
| Electricity | 150 (4.0%) | 9 (2.6%) |
| Fuel Oil or Kerosene | 164 (4.4%) | 0 (0.0%) |
| Coal or Coke | 0 (0.0%) | 0 (0.0%) |
| All other Fuels | 10 (0.3%) | 0 (0.0%) |
| No Fuel Used | 0 (0.0%) | 0 (0.0%) |
| Total | 3,759 (100.0%) | 340 (100.0%) |
Household Vehicle Usage in Robertsville
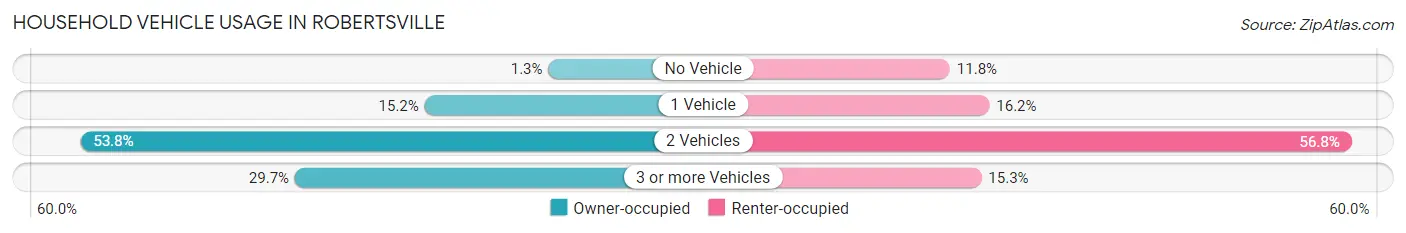
| Vehicles per Household | Owner-occupied | Renter-occupied |
| No Vehicle | 50 (1.3%) | 40 (11.8%) |
| 1 Vehicle | 571 (15.2%) | 55 (16.2%) |
| 2 Vehicles | 2,021 (53.8%) | 193 (56.8%) |
| 3 or more Vehicles | 1,117 (29.7%) | 52 (15.3%) |
| Total | 3,759 (100.0%) | 340 (100.0%) |
Real Estate & Mortgages in Robertsville
Real Estate and Mortgage Overview in Robertsville
| Characteristic | Without Mortgage | With Mortgage |
| Housing Units | 1,328 | 2,431 |
| Median Property Value | $578,600 | $630,200 |
| Median Household Income | $115,435 | $1,808 |
| Monthly Housing Costs | $1,365 | $1,647 |
| Real Estate Taxes | $10,001 | $13 |
Property Value by Mortgage Status in Robertsville
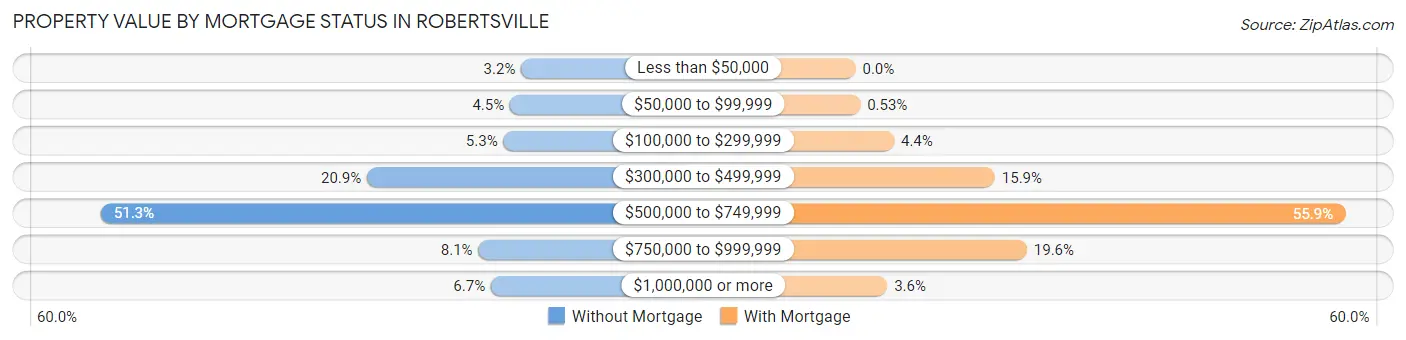
| Property Value | Without Mortgage | With Mortgage |
| Less than $50,000 | 43 (3.2%) | 0 (0.0%) |
| $50,000 to $99,999 | 60 (4.5%) | 13 (0.5%) |
| $100,000 to $299,999 | 70 (5.3%) | 107 (4.4%) |
| $300,000 to $499,999 | 277 (20.9%) | 387 (15.9%) |
| $500,000 to $749,999 | 681 (51.3%) | 1,360 (55.9%) |
| $750,000 to $999,999 | 108 (8.1%) | 476 (19.6%) |
| $1,000,000 or more | 89 (6.7%) | 88 (3.6%) |
| Total | 1,328 (100.0%) | 2,431 (100.0%) |
Household Income by Mortgage Status in Robertsville
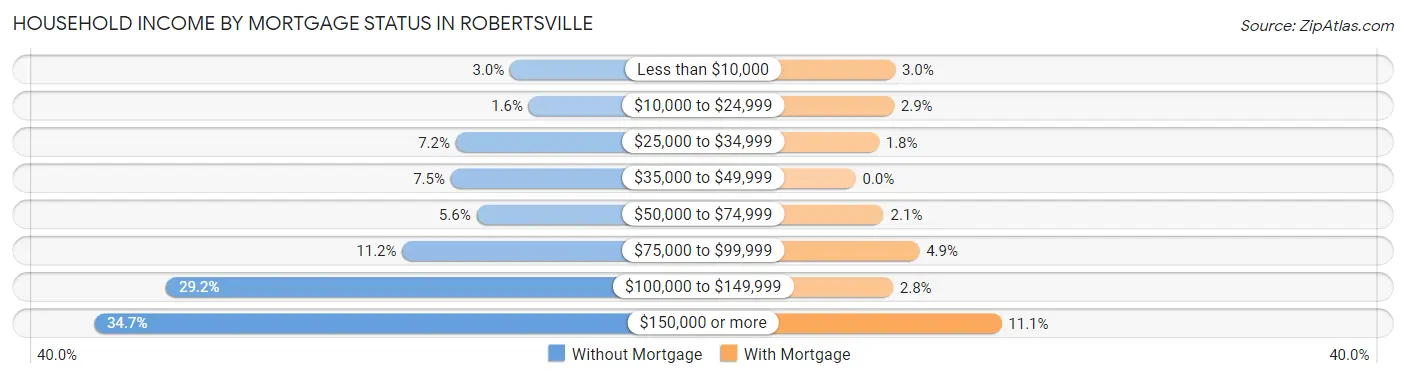
| Household Income | Without Mortgage | With Mortgage |
| Less than $10,000 | 40 (3.0%) | 73 (3.0%) |
| $10,000 to $24,999 | 21 (1.6%) | 71 (2.9%) |
| $25,000 to $34,999 | 95 (7.1%) | 43 (1.8%) |
| $35,000 to $49,999 | 100 (7.5%) | 0 (0.0%) |
| $50,000 to $74,999 | 74 (5.6%) | 52 (2.1%) |
| $75,000 to $99,999 | 149 (11.2%) | 118 (4.9%) |
| $100,000 to $149,999 | 388 (29.2%) | 69 (2.8%) |
| $150,000 or more | 461 (34.7%) | 270 (11.1%) |
| Total | 1,328 (100.0%) | 2,431 (100.0%) |
Property Value to Household Income Ratio in Robertsville
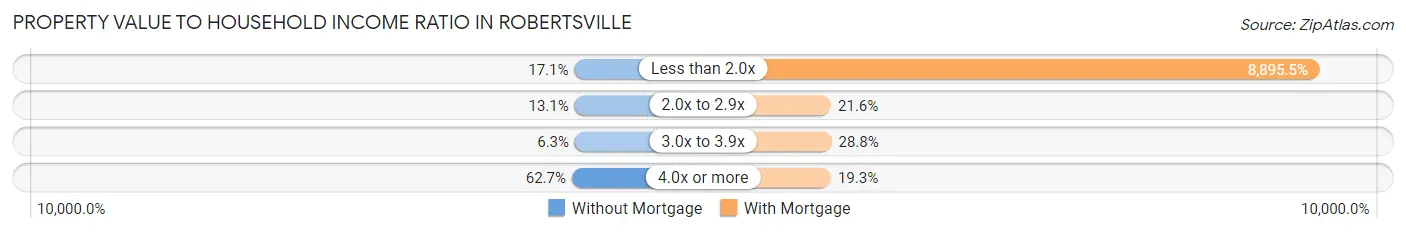
| Value-to-Income Ratio | Without Mortgage | With Mortgage |
| Less than 2.0x | 227 (17.1%) | 216,250 (8,895.5%) |
| 2.0x to 2.9x | 174 (13.1%) | 524 (21.5%) |
| 3.0x to 3.9x | 84 (6.3%) | 699 (28.7%) |
| 4.0x or more | 832 (62.6%) | 468 (19.3%) |
| Total | 1,328 (100.0%) | 2,431 (100.0%) |
Real Estate Taxes by Mortgage Status in Robertsville
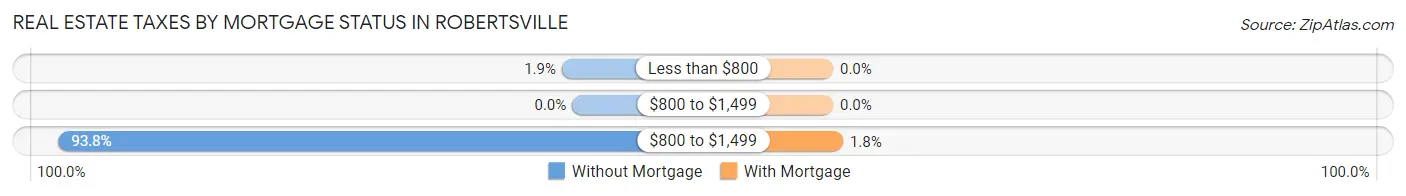
| Property Taxes | Without Mortgage | With Mortgage |
| Less than $800 | 25 (1.9%) | 0 (0.0%) |
| $800 to $1,499 | 0 (0.0%) | 0 (0.0%) |
| $800 to $1,499 | 1,246 (93.8%) | 44 (1.8%) |
| Total | 1,328 (100.0%) | 2,431 (100.0%) |
Health & Disability in Robertsville
Health Insurance Coverage by Age in Robertsville
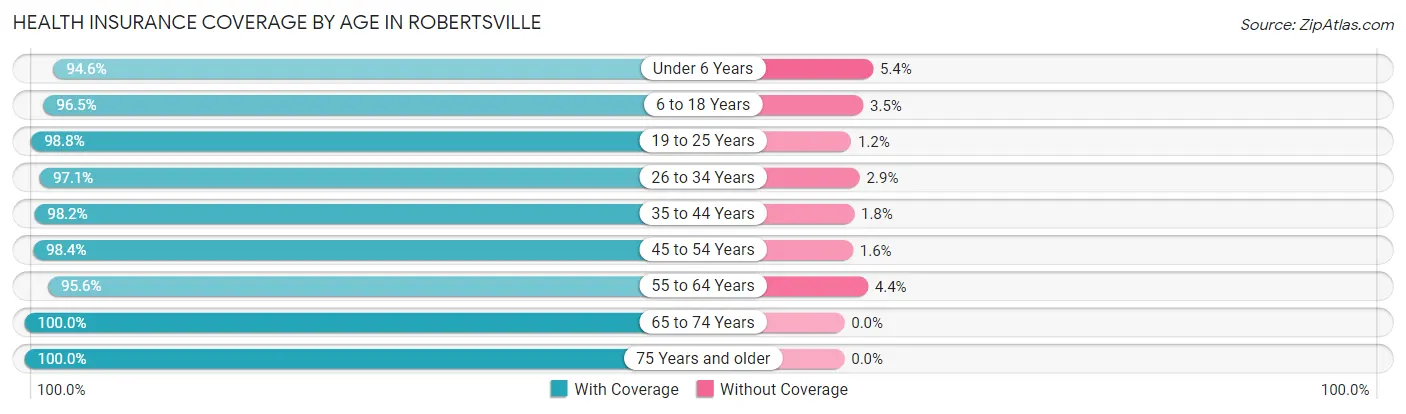
| Age Bracket | With Coverage | Without Coverage |
| Under 6 Years | 901 (94.6%) | 51 (5.4%) |
| 6 to 18 Years | 2,228 (96.5%) | 81 (3.5%) |
| 19 to 25 Years | 1,199 (98.8%) | 15 (1.2%) |
| 26 to 34 Years | 1,250 (97.1%) | 37 (2.9%) |
| 35 to 44 Years | 1,514 (98.2%) | 28 (1.8%) |
| 45 to 54 Years | 1,852 (98.4%) | 30 (1.6%) |
| 55 to 64 Years | 1,722 (95.6%) | 79 (4.4%) |
| 65 to 74 Years | 1,078 (100.0%) | 0 (0.0%) |
| 75 Years and older | 581 (100.0%) | 0 (0.0%) |
| Total | 12,325 (97.5%) | 321 (2.5%) |
Health Insurance Coverage by Citizenship Status in Robertsville
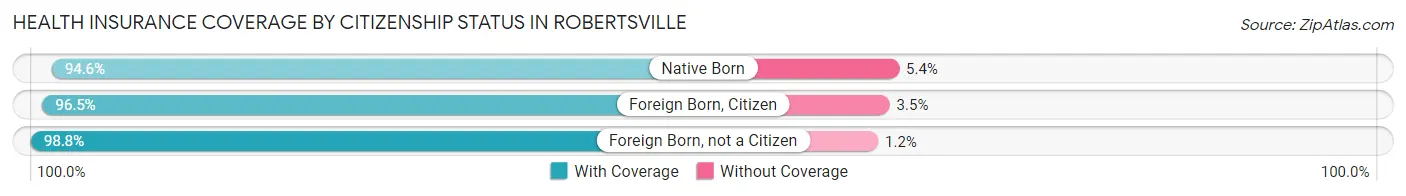
| Citizenship Status | With Coverage | Without Coverage |
| Native Born | 901 (94.6%) | 51 (5.4%) |
| Foreign Born, Citizen | 2,228 (96.5%) | 81 (3.5%) |
| Foreign Born, not a Citizen | 1,199 (98.8%) | 15 (1.2%) |
Health Insurance Coverage by Household Income in Robertsville
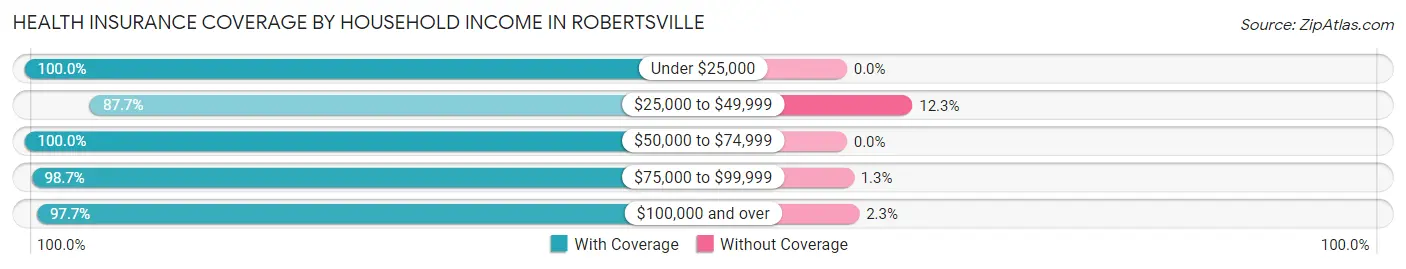
| Household Income | With Coverage | Without Coverage |
| Under $25,000 | 476 (100.0%) | 0 (0.0%) |
| $25,000 to $49,999 | 507 (87.7%) | 71 (12.3%) |
| $50,000 to $74,999 | 535 (100.0%) | 0 (0.0%) |
| $75,000 to $99,999 | 611 (98.7%) | 8 (1.3%) |
| $100,000 and over | 10,196 (97.7%) | 242 (2.3%) |
Public vs Private Health Insurance Coverage by Age in Robertsville
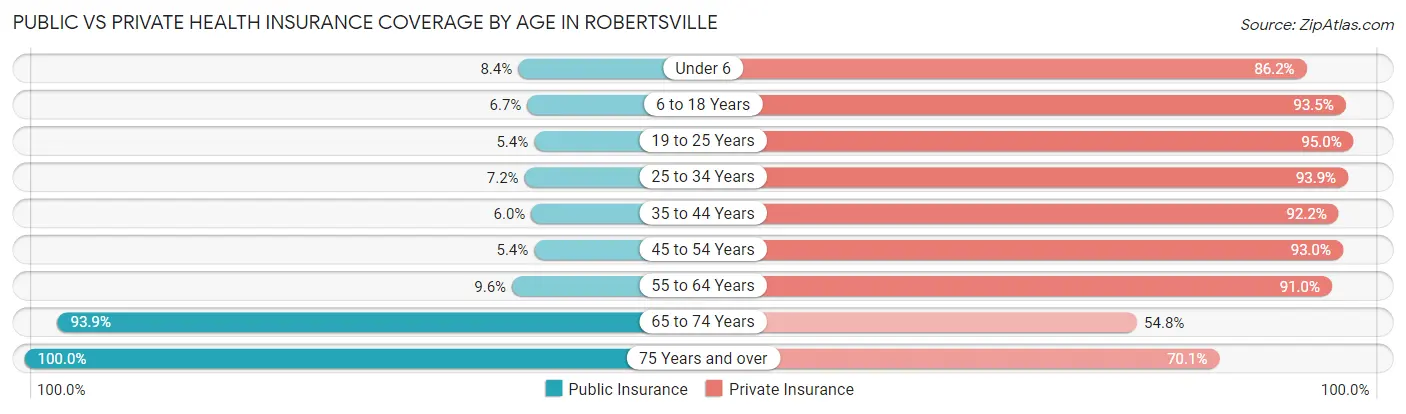
| Age Bracket | Public Insurance | Private Insurance |
| Under 6 | 80 (8.4%) | 821 (86.2%) |
| 6 to 18 Years | 155 (6.7%) | 2,159 (93.5%) |
| 19 to 25 Years | 66 (5.4%) | 1,153 (95.0%) |
| 25 to 34 Years | 93 (7.2%) | 1,209 (93.9%) |
| 35 to 44 Years | 92 (6.0%) | 1,422 (92.2%) |
| 45 to 54 Years | 102 (5.4%) | 1,750 (93.0%) |
| 55 to 64 Years | 172 (9.6%) | 1,638 (90.9%) |
| 65 to 74 Years | 1,012 (93.9%) | 591 (54.8%) |
| 75 Years and over | 581 (100.0%) | 407 (70.1%) |
| Total | 2,353 (18.6%) | 11,150 (88.2%) |
Disability Status by Sex by Age in Robertsville
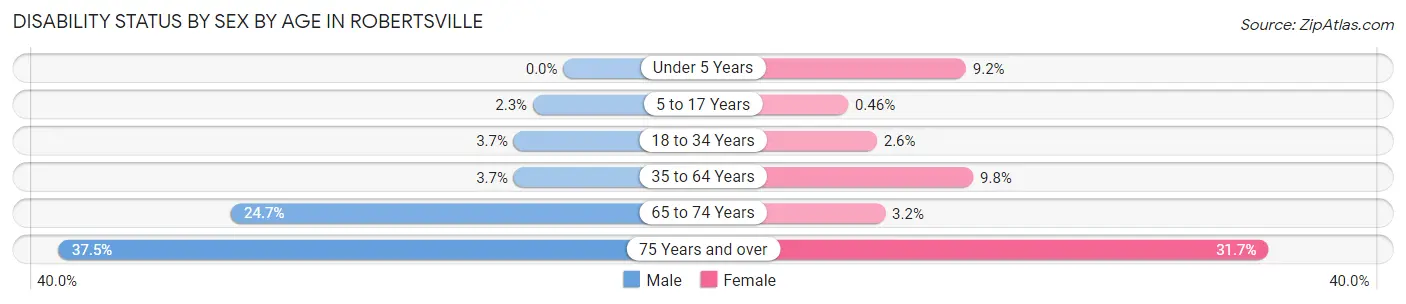
| Age Bracket | Male | Female |
| Under 5 Years | 0 (0.0%) | 51 (9.2%) |
| 5 to 17 Years | 23 (2.3%) | 6 (0.5%) |
| 18 to 34 Years | 46 (3.7%) | 35 (2.6%) |
| 35 to 64 Years | 96 (3.7%) | 255 (9.8%) |
| 65 to 74 Years | 128 (24.7%) | 18 (3.2%) |
| 75 Years and over | 91 (37.4%) | 107 (31.7%) |
Disability Class by Sex by Age in Robertsville
Disability Class: Hearing Difficulty
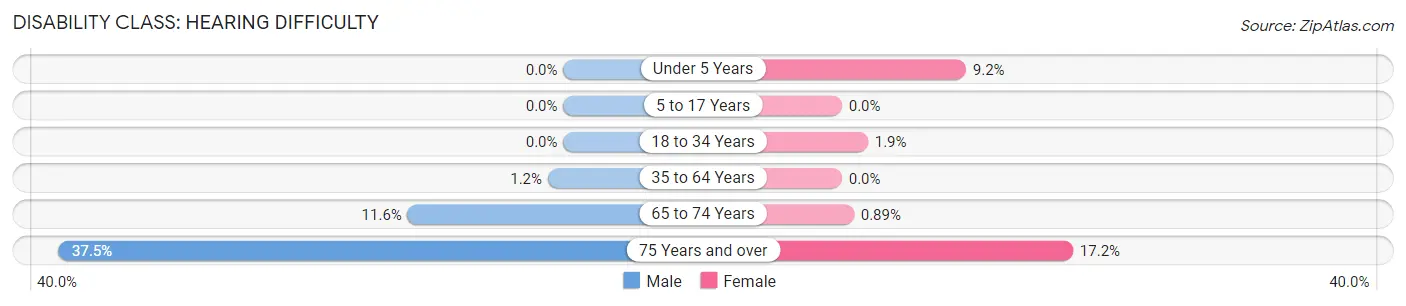
| Age Bracket | Male | Female |
| Under 5 Years | 0 (0.0%) | 51 (9.2%) |
| 5 to 17 Years | 0 (0.0%) | 0 (0.0%) |
| 18 to 34 Years | 0 (0.0%) | 26 (1.9%) |
| 35 to 64 Years | 30 (1.1%) | 0 (0.0%) |
| 65 to 74 Years | 60 (11.6%) | 5 (0.9%) |
| 75 Years and over | 91 (37.4%) | 58 (17.2%) |
Disability Class: Vision Difficulty
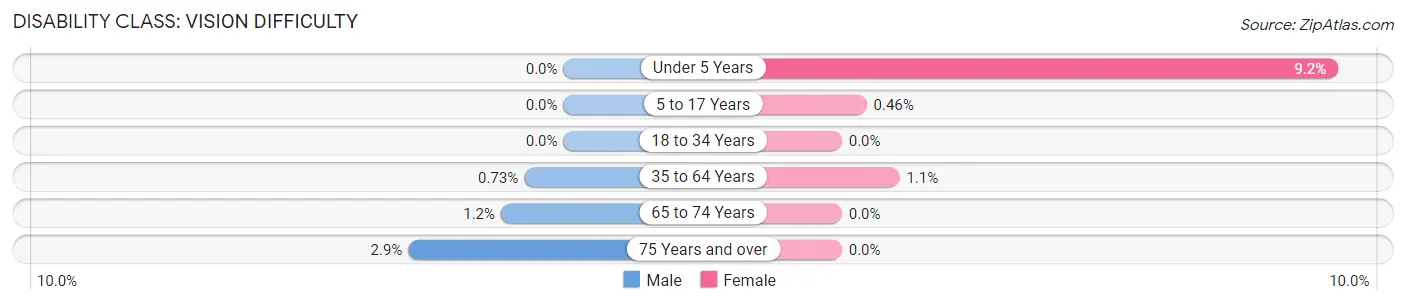
| Age Bracket | Male | Female |
| Under 5 Years | 0 (0.0%) | 51 (9.2%) |
| 5 to 17 Years | 0 (0.0%) | 6 (0.5%) |
| 18 to 34 Years | 0 (0.0%) | 0 (0.0%) |
| 35 to 64 Years | 19 (0.7%) | 28 (1.1%) |
| 65 to 74 Years | 6 (1.2%) | 0 (0.0%) |
| 75 Years and over | 7 (2.9%) | 0 (0.0%) |
Disability Class: Cognitive Difficulty
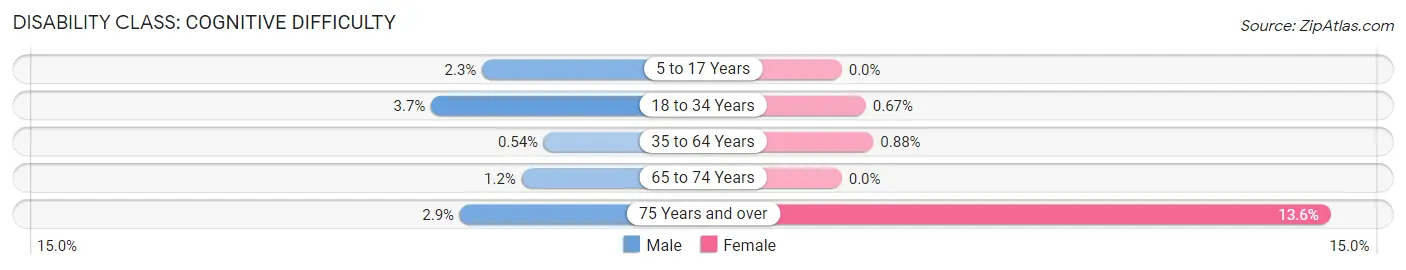
| Age Bracket | Male | Female |
| 5 to 17 Years | 23 (2.3%) | 0 (0.0%) |
| 18 to 34 Years | 46 (3.7%) | 9 (0.7%) |
| 35 to 64 Years | 14 (0.5%) | 23 (0.9%) |
| 65 to 74 Years | 6 (1.2%) | 0 (0.0%) |
| 75 Years and over | 7 (2.9%) | 46 (13.6%) |
Disability Class: Ambulatory Difficulty
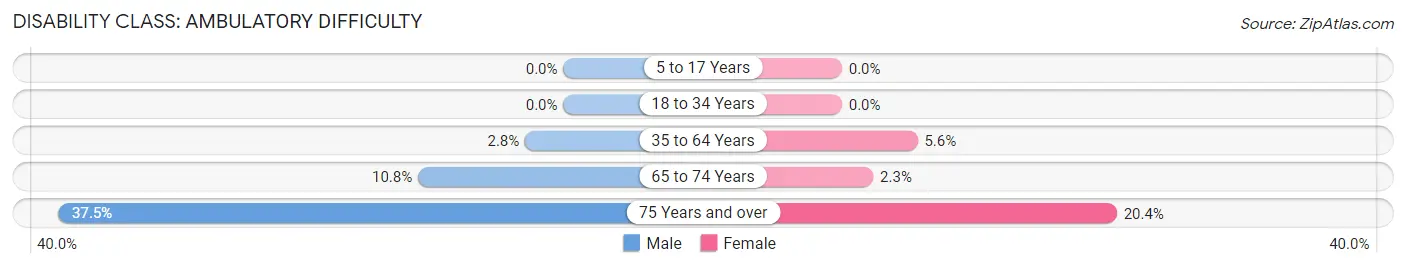
| Age Bracket | Male | Female |
| 5 to 17 Years | 0 (0.0%) | 0 (0.0%) |
| 18 to 34 Years | 0 (0.0%) | 0 (0.0%) |
| 35 to 64 Years | 74 (2.8%) | 147 (5.6%) |
| 65 to 74 Years | 56 (10.8%) | 13 (2.3%) |
| 75 Years and over | 91 (37.4%) | 69 (20.4%) |
Disability Class: Self-Care Difficulty
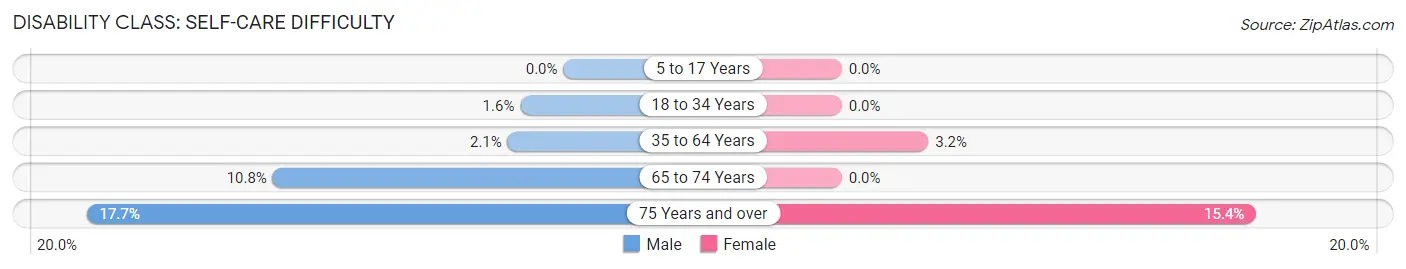
| Age Bracket | Male | Female |
| 5 to 17 Years | 0 (0.0%) | 0 (0.0%) |
| 18 to 34 Years | 20 (1.6%) | 0 (0.0%) |
| 35 to 64 Years | 54 (2.1%) | 84 (3.2%) |
| 65 to 74 Years | 56 (10.8%) | 0 (0.0%) |
| 75 Years and over | 43 (17.7%) | 52 (15.4%) |
Technology Access in Robertsville
Computing Device Access in Robertsville
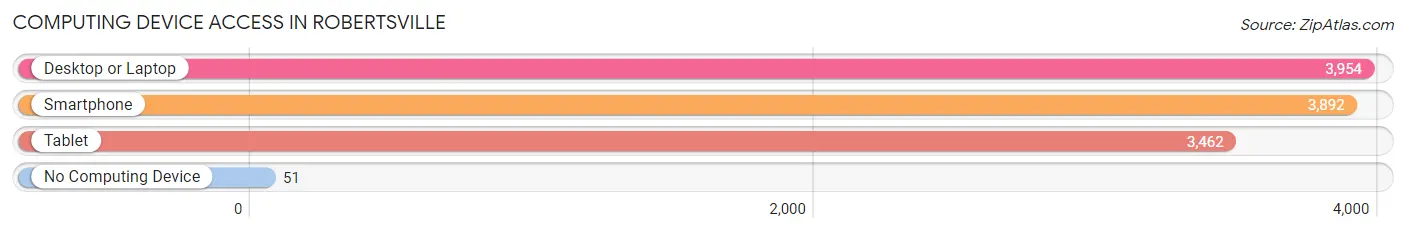
| Device Type | # Households | % Households |
| Desktop or Laptop | 3,954 | 96.5% |
| Smartphone | 3,892 | 95.0% |
| Tablet | 3,462 | 84.5% |
| No Computing Device | 51 | 1.2% |
| Total | 4,099 | 100.0% |
Internet Access in Robertsville
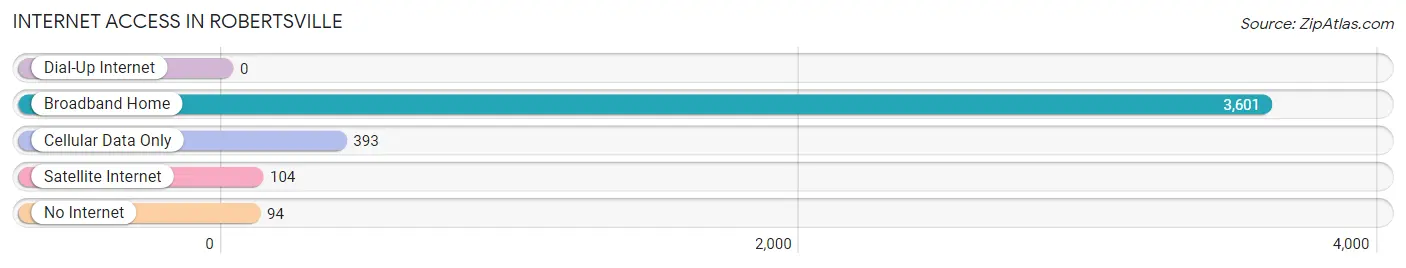
| Internet Type | # Households | % Households |
| Dial-Up Internet | 0 | 0.0% |
| Broadband Home | 3,601 | 87.8% |
| Cellular Data Only | 393 | 9.6% |
| Satellite Internet | 104 | 2.5% |
| No Internet | 94 | 2.3% |
| Total | 4,099 | 100.0% |
Robertsville Summary
Robertsville is a small unincorporated community located in Monmouth County, New Jersey. It is situated in the northern part of the county, near the border with Ocean County. The community is located within the boundaries of the borough of Manasquan, and is part of the Manasquan-Belmar Metropolitan Statistical Area.
History
The area that is now Robertsville was originally inhabited by the Lenape Native Americans. The first European settlers arrived in the area in the late 17th century, and the community was established in the early 19th century. The community was named after the Roberts family, who were among the first settlers in the area.
Geography
Robertsville is located in northern Monmouth County, near the border with Ocean County. It is situated in the borough of Manasquan, and is part of the Manasquan-Belmar Metropolitan Statistical Area. The community is located at an elevation of approximately 20 feet (6 meters) above sea level.
The climate in Robertsville is classified as humid subtropical, with hot, humid summers and mild winters. The average annual temperature is around 60°F (15°C), and the average annual precipitation is around 45 inches (114 cm).
Economy
The economy of Robertsville is largely based on tourism and retail. The community is home to several small businesses, including restaurants, shops, and other services. The community is also home to a number of small farms, which produce a variety of fruits and vegetables.
Demographics
As of the 2010 census, the population of Robertsville was 1,845. The racial makeup of the community was 94.3% White, 2.2% African American, 0.7% Asian, and 2.8% from other races. The median household income was $68,750, and the median family income was $76,250.
Conclusion
Robertsville is a small unincorporated community located in Monmouth County, New Jersey. It is situated in the northern part of the county, near the border with Ocean County. The community is home to a number of small businesses, farms, and other services, and is largely supported by tourism and retail. The population of Robertsville was 1,845 as of the 2010 census, and the median household income was $68,750.
Common Questions
What is Per Capita Income in Robertsville?
Per Capita income in Robertsville is $69,973.
What is the Median Family Income in Robertsville?
Median Family Income in Robertsville is $197,529.
What is the Median Household income in Robertsville?
Median Household Income in Robertsville is $188,068.
What is Income or Wage Gap in Robertsville?
Income or Wage Gap in Robertsville is 51.0%.
Women in Robertsville earn 49.0 cents for every dollar earned by a man.
What is Family Income Deficit in Robertsville?
Family Income Deficit in Robertsville is $13,308.
Families that are below poverty line in Robertsville earn $13,308 less on average than the poverty threshold level.
What is Inequality or Gini Index in Robertsville?
Inequality or Gini Index in Robertsville is 0.42.
What is the Total Population of Robertsville?
Total Population of Robertsville is 12,646.
What is the Total Male Population of Robertsville?
Total Male Population of Robertsville is 5,937.
What is the Total Female Population of Robertsville?
Total Female Population of Robertsville is 6,709.
What is the Ratio of Males per 100 Females in Robertsville?
There are 88.49 Males per 100 Females in Robertsville.
What is the Ratio of Females per 100 Males in Robertsville?
There are 113.00 Females per 100 Males in Robertsville.
What is the Median Population Age in Robertsville?
Median Population Age in Robertsville is 40.2 Years.
What is the Average Family Size in Robertsville
Average Family Size in Robertsville is 3.3 People.
What is the Average Household Size in Robertsville
Average Household Size in Robertsville is 3.1 People.
How Large is the Labor Force in Robertsville?
There are 6,631 People in the Labor Forcein in Robertsville.
What is the Percentage of People in the Labor Force in Robertsville?
66.8% of People are in the Labor Force in Robertsville.
What is the Unemployment Rate in Robertsville?
Unemployment Rate in Robertsville is 4.2%.