Cities with the Most Immigrants from Western Europe in Mississippi
RELATED REPORTS & OPTIONS
Western Europe
Mississippi
Compare Cities
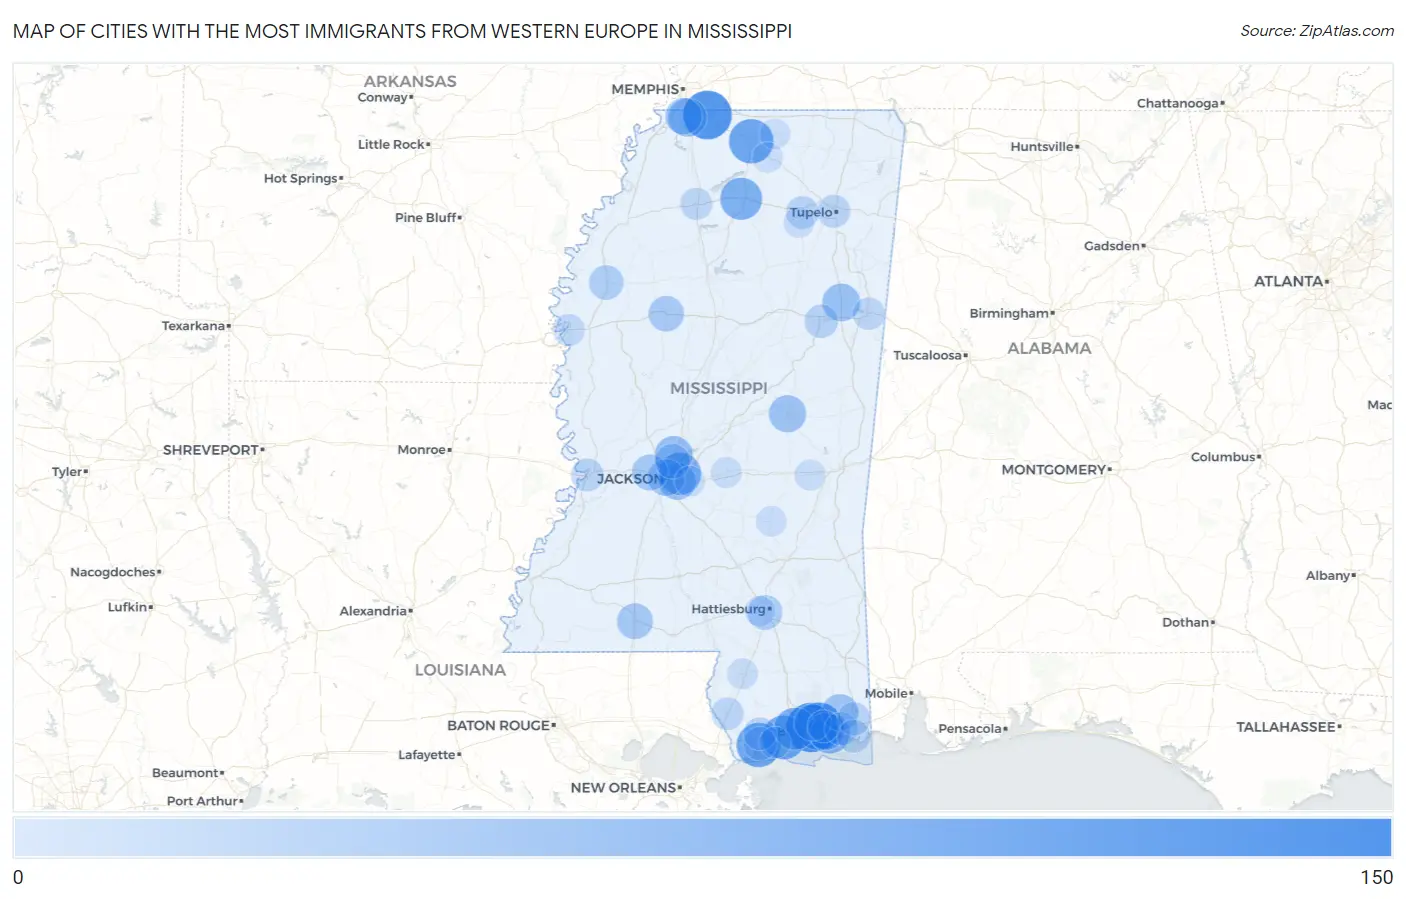
Map of Cities with the Most Immigrants from Western Europe in Mississippi
0
150
Cities with the Most Immigrants from Western Europe in Mississippi
| City | Western Europe | vs State | vs National | |
| 1. | Biloxi | 134 | 2,842(4.71%)#1 | 924,665(0.01%)#1,032 |
| 2. | Olive Branch | 127 | 2,842(4.47%)#2 | 924,665(0.01%)#1,090 |
| 3. | St Martin | 120 | 2,842(4.22%)#3 | 924,665(0.01%)#1,157 |
| 4. | Holly Springs | 98 | 2,842(3.45%)#4 | 924,665(0.01%)#1,430 |
| 5. | Waveland | 97 | 2,842(3.41%)#5 | 924,665(0.01%)#1,440 |
| 6. | Long Beach | 93 | 2,842(3.27%)#6 | 924,665(0.01%)#1,483 |
| 7. | Flowood | 82 | 2,842(2.89%)#7 | 924,665(0.01%)#1,665 |
| 8. | Gulfport | 81 | 2,842(2.85%)#8 | 924,665(0.01%)#1,672 |
| 9. | Oxford | 80 | 2,842(2.81%)#9 | 924,665(0.01%)#1,699 |
| 10. | Gulf Park Estates | 64 | 2,842(2.25%)#10 | 924,665(0.01%)#2,057 |
| 11. | Southaven | 56 | 2,842(1.97%)#11 | 924,665(0.01%)#2,282 |
| 12. | Madison | 53 | 2,842(1.86%)#12 | 924,665(0.01%)#2,390 |
| 13. | West Point | 52 | 2,842(1.83%)#13 | 924,665(0.01%)#2,445 |
| 14. | Ocean Springs | 49 | 2,842(1.72%)#14 | 924,665(0.01%)#2,545 |
| 15. | Pearl | 47 | 2,842(1.65%)#15 | 924,665(0.01%)#2,602 |
| 16. | Philadelphia | 47 | 2,842(1.65%)#16 | 924,665(0.01%)#2,628 |
| 17. | Jackson | 45 | 2,842(1.58%)#17 | 924,665(0.00%)#2,686 |
| 18. | Vancleave | 44 | 2,842(1.55%)#18 | 924,665(0.00%)#2,768 |
| 19. | Horn Lake | 43 | 2,842(1.51%)#19 | 924,665(0.00%)#2,785 |
| 20. | D Iberville | 43 | 2,842(1.51%)#20 | 924,665(0.00%)#2,804 |
| 21. | Clinton | 39 | 2,842(1.37%)#21 | 924,665(0.00%)#2,977 |
| 22. | Mccomb | 38 | 2,842(1.34%)#22 | 924,665(0.00%)#3,050 |
| 23. | Greenwood | 36 | 2,842(1.27%)#23 | 924,665(0.00%)#3,176 |
| 24. | Hattiesburg | 31 | 2,842(1.09%)#24 | 924,665(0.00%)#3,456 |
| 25. | Ridgeland | 31 | 2,842(1.09%)#25 | 924,665(0.00%)#3,465 |
| 26. | Cleveland | 30 | 2,842(1.06%)#26 | 924,665(0.00%)#3,565 |
| 27. | Starkville | 22 | 2,842(0.77%)#27 | 924,665(0.00%)#4,198 |
| 28. | Bay St Louis | 21 | 2,842(0.74%)#28 | 924,665(0.00%)#4,334 |
| 29. | Gautier | 20 | 2,842(0.70%)#29 | 924,665(0.00%)#4,442 |
| 30. | Escatawpa | 20 | 2,842(0.70%)#30 | 924,665(0.00%)#4,514 |
| 31. | Pascagoula | 19 | 2,842(0.67%)#31 | 924,665(0.00%)#4,571 |
| 32. | Tupelo | 18 | 2,842(0.63%)#32 | 924,665(0.00%)#4,677 |
| 33. | Diamondhead | 18 | 2,842(0.63%)#33 | 924,665(0.00%)#4,723 |
| 34. | Vicksburg | 17 | 2,842(0.60%)#34 | 924,665(0.00%)#4,840 |
| 35. | Pontotoc | 17 | 2,842(0.60%)#35 | 924,665(0.00%)#4,888 |
| 36. | Picayune | 15 | 2,842(0.53%)#36 | 924,665(0.00%)#5,122 |
| 37. | Columbus | 14 | 2,842(0.49%)#37 | 924,665(0.00%)#5,267 |
| 38. | Gulf Hills | 13 | 2,842(0.46%)#38 | 924,665(0.00%)#5,475 |
| 39. | Batesville | 13 | 2,842(0.46%)#39 | 924,665(0.00%)#5,478 |
| 40. | Greenville | 11 | 2,842(0.39%)#40 | 924,665(0.00%)#5,796 |
| 41. | Pass Christian | 8 | 2,842(0.28%)#41 | 924,665(0.00%)#6,640 |
| 42. | Morton | 5 | 2,842(0.18%)#42 | 924,665(0.00%)#7,455 |
| 43. | Chunky | 5 | 2,842(0.18%)#43 | 924,665(0.00%)#7,673 |
| 44. | Poplarville | 4 | 2,842(0.14%)#44 | 924,665(0.00%)#7,760 |
| 45. | West Hattiesburg | 3 | 2,842(0.11%)#45 | 924,665(0.00%)#8,084 |
| 46. | Bay Springs | 3 | 2,842(0.11%)#46 | 924,665(0.00%)#8,168 |
| 47. | Brandon | 2 | 2,842(0.07%)#47 | 924,665(0.00%)#8,481 |
| 48. | Algoma | 2 | 2,842(0.07%)#48 | 924,665(0.00%)#8,682 |
| 49. | Snow Lake Shores | 2 | 2,842(0.07%)#49 | 924,665(0.00%)#8,893 |
| 50. | Potts Camp | 2 | 2,842(0.07%)#50 | 924,665(0.00%)#8,915 |
Common Questions
What are the Top 10 Cities with the Most Immigrants from Western Europe in Mississippi?
Top 10 Cities with the Most Immigrants from Western Europe in Mississippi are:
#1
134
#2
127
#3
120
#4
98
#5
97
#6
93
#7
82
#8
81
#9
80
#10
64
What city has the Most Immigrants from Western Europe in Mississippi?
Biloxi has the Most Immigrants from Western Europe in Mississippi with 134.
What is the Total Immigrants from Western Europe in the State of Mississippi?
Total Immigrants from Western Europe in Mississippi is 2,842.
What is the Total Immigrants from Western Europe in the United States?
Total Immigrants from Western Europe in the United States is 924,665.