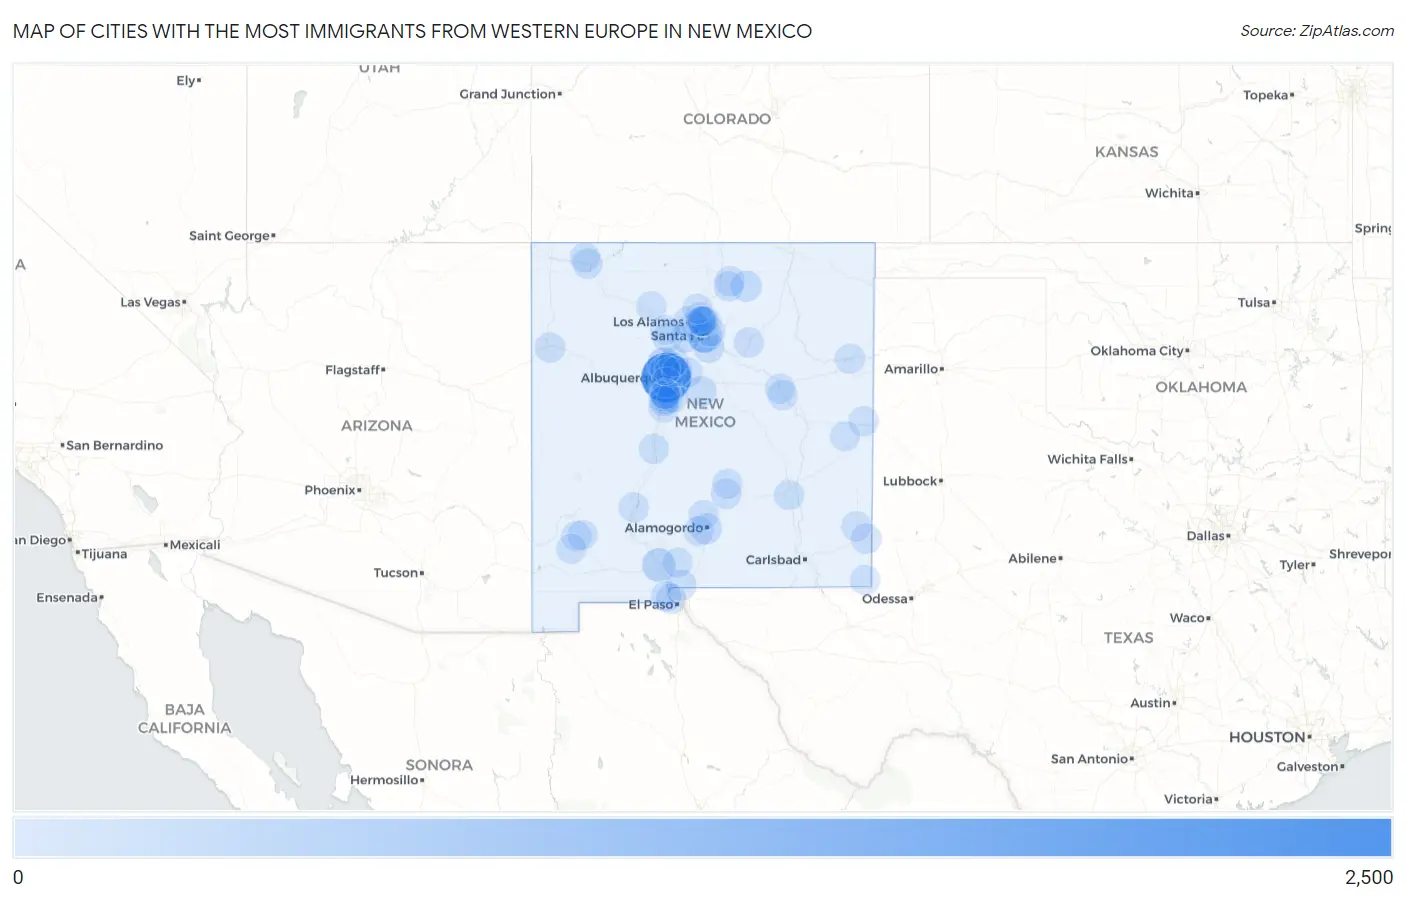
Cities with the Most Immigrants from Western Europe in New Mexico
RELATED REPORTS & OPTIONS
Western Europe
New Mexico
Compare Cities
Map of Cities with the Most Immigrants from Western Europe in New Mexico
0
2,500
Cities with the Most Immigrants from Western Europe in New Mexico
| City | Western Europe | vs State | vs National | |
| 1. | Albuquerque | 2,209 | 5,303(41.66%)#1 | 924,665(0.24%)#23 |
| 2. | Santa Fe | 405 | 5,303(7.64%)#2 | 924,665(0.04%)#262 |
| 3. | Las Cruces | 347 | 5,303(6.54%)#3 | 924,665(0.04%)#316 |
| 4. | Rio Rancho | 271 | 5,303(5.11%)#4 | 924,665(0.03%)#455 |
| 5. | Alamogordo | 128 | 5,303(2.41%)#5 | 924,665(0.01%)#1,082 |
| 6. | Angel Fire | 98 | 5,303(1.85%)#6 | 924,665(0.01%)#1,431 |
| 7. | Eldorado At Santa Fe | 78 | 5,303(1.47%)#7 | 924,665(0.01%)#1,752 |
| 8. | Mcintosh | 63 | 5,303(1.19%)#8 | 924,665(0.01%)#2,093 |
| 9. | White Rock | 62 | 5,303(1.17%)#9 | 924,665(0.01%)#2,123 |
| 10. | Chaparral | 56 | 5,303(1.06%)#10 | 924,665(0.01%)#2,298 |
| 11. | North Valley | 51 | 5,303(0.96%)#11 | 924,665(0.01%)#2,482 |
| 12. | Ruidoso | 47 | 5,303(0.89%)#12 | 924,665(0.01%)#2,626 |
| 13. | Sunland Park | 45 | 5,303(0.85%)#13 | 924,665(0.00%)#2,699 |
| 14. | Los Alamos | 41 | 5,303(0.77%)#14 | 924,665(0.00%)#2,891 |
| 15. | Santa Teresa | 41 | 5,303(0.77%)#15 | 924,665(0.00%)#2,906 |
| 16. | Hobbs | 33 | 5,303(0.62%)#16 | 924,665(0.00%)#3,326 |
| 17. | Agua Fria | 33 | 5,303(0.62%)#17 | 924,665(0.00%)#3,375 |
| 18. | Lee Acres | 32 | 5,303(0.60%)#18 | 924,665(0.00%)#3,432 |
| 19. | El Cerro Mission | 31 | 5,303(0.58%)#19 | 924,665(0.00%)#3,506 |
| 20. | Gallup | 30 | 5,303(0.57%)#20 | 924,665(0.00%)#3,549 |
| 21. | El Cerro | 30 | 5,303(0.57%)#21 | 924,665(0.00%)#3,598 |
| 22. | Placitas Cdp Sandoval County | 29 | 5,303(0.55%)#22 | 924,665(0.00%)#3,670 |
| 23. | Sandia Knolls | 24 | 5,303(0.45%)#23 | 924,665(0.00%)#4,095 |
| 24. | Socorro | 22 | 5,303(0.41%)#24 | 924,665(0.00%)#4,239 |
| 25. | Rio Rancho Estates | 22 | 5,303(0.41%)#25 | 924,665(0.00%)#4,287 |
| 26. | Taos Pueblo | 22 | 5,303(0.41%)#26 | 924,665(0.00%)#4,290 |
| 27. | Cañoncito | 21 | 5,303(0.40%)#27 | 924,665(0.00%)#4,411 |
| 28. | Silver City | 20 | 5,303(0.38%)#28 | 924,665(0.00%)#4,468 |
| 29. | Rio Communities | 20 | 5,303(0.38%)#29 | 924,665(0.00%)#4,498 |
| 30. | Peralta | 20 | 5,303(0.38%)#30 | 924,665(0.00%)#4,511 |
| 31. | Roswell | 19 | 5,303(0.36%)#31 | 924,665(0.00%)#4,556 |
| 32. | Las Vegas | 19 | 5,303(0.36%)#32 | 924,665(0.00%)#4,581 |
| 33. | Espanola | 19 | 5,303(0.36%)#33 | 924,665(0.00%)#4,587 |
| 34. | Barton | 19 | 5,303(0.36%)#34 | 924,665(0.00%)#4,654 |
| 35. | Clovis | 18 | 5,303(0.34%)#35 | 924,665(0.00%)#4,676 |
| 36. | Puerto De Luna | 18 | 5,303(0.34%)#36 | 924,665(0.00%)#4,830 |
| 37. | Corrales | 17 | 5,303(0.32%)#37 | 924,665(0.00%)#4,874 |
| 38. | La Jara | 17 | 5,303(0.32%)#38 | 924,665(0.00%)#4,956 |
| 39. | Taos | 16 | 5,303(0.30%)#39 | 924,665(0.00%)#5,017 |
| 40. | Valencia | 15 | 5,303(0.28%)#40 | 924,665(0.00%)#5,222 |
| 41. | Las Campanas | 15 | 5,303(0.28%)#41 | 924,665(0.00%)#5,232 |
| 42. | White Sands | 15 | 5,303(0.28%)#42 | 924,665(0.00%)#5,237 |
| 43. | Hyde Park | 15 | 5,303(0.28%)#43 | 924,665(0.00%)#5,251 |
| 44. | South Valley | 14 | 5,303(0.26%)#44 | 924,665(0.00%)#5,260 |
| 45. | Lovington | 13 | 5,303(0.25%)#45 | 924,665(0.00%)#5,453 |
| 46. | Center Point | 13 | 5,303(0.25%)#46 | 924,665(0.00%)#5,538 |
| 47. | Meadow Lake | 12 | 5,303(0.23%)#47 | 924,665(0.00%)#5,691 |
| 48. | Bernalillo | 11 | 5,303(0.21%)#48 | 924,665(0.00%)#5,844 |
| 49. | Truth Or Consequences | 11 | 5,303(0.21%)#49 | 924,665(0.00%)#5,882 |
| 50. | Sandia Heights | 11 | 5,303(0.21%)#50 | 924,665(0.00%)#5,922 |
| 51. | Tres Arroyos | 11 | 5,303(0.21%)#51 | 924,665(0.00%)#5,965 |
| 52. | Tome | 11 | 5,303(0.21%)#52 | 924,665(0.00%)#6,004 |
| 53. | Bosque Farms | 10 | 5,303(0.19%)#53 | 924,665(0.00%)#6,149 |
| 54. | Tesuque | 10 | 5,303(0.19%)#54 | 924,665(0.00%)#6,245 |
| 55. | Paa-Ko | 10 | 5,303(0.19%)#55 | 924,665(0.00%)#6,265 |
| 56. | Nambe | 8 | 5,303(0.15%)#56 | 924,665(0.00%)#6,717 |
| 57. | Logan | 8 | 5,303(0.15%)#57 | 924,665(0.00%)#6,790 |
| 58. | Paradise Hills | 7 | 5,303(0.13%)#58 | 924,665(0.00%)#6,920 |
| 59. | Crouch Mesa | 6 | 5,303(0.11%)#59 | 924,665(0.00%)#7,169 |
| 60. | Holloman Afb | 6 | 5,303(0.11%)#60 | 924,665(0.00%)#7,182 |
| 61. | Santa Clara | 6 | 5,303(0.11%)#61 | 924,665(0.00%)#7,265 |
| 62. | Ponderosa | 6 | 5,303(0.11%)#62 | 924,665(0.00%)#7,381 |
| 63. | Santa Rosa | 5 | 5,303(0.09%)#63 | 924,665(0.00%)#7,483 |
| 64. | Tularosa | 5 | 5,303(0.09%)#64 | 924,665(0.00%)#7,493 |
| 65. | La Mesilla | 5 | 5,303(0.09%)#65 | 924,665(0.00%)#7,511 |
| 66. | El Rancho | 5 | 5,303(0.09%)#66 | 924,665(0.00%)#7,568 |
| 67. | Capitan | 5 | 5,303(0.09%)#67 | 924,665(0.00%)#7,576 |
| 68. | Cochiti Lake | 5 | 5,303(0.09%)#68 | 924,665(0.00%)#7,651 |
| 69. | Jal | 4 | 5,303(0.08%)#69 | 924,665(0.00%)#7,792 |
| 70. | Floyd | 4 | 5,303(0.08%)#70 | 924,665(0.00%)#8,058 |
| 71. | Pojoaque | 3 | 5,303(0.06%)#71 | 924,665(0.00%)#8,120 |
| 72. | Jaconita | 3 | 5,303(0.06%)#72 | 924,665(0.00%)#8,414 |
| 73. | White Signal | 3 | 5,303(0.06%)#73 | 924,665(0.00%)#8,463 |
| 74. | Penasco | 2 | 5,303(0.04%)#74 | 924,665(0.00%)#8,737 |
| 75. | Jemez Springs | 2 | 5,303(0.04%)#75 | 924,665(0.00%)#8,896 |
| 76. | Flora Vista | 1 | 5,303(0.02%)#76 | 924,665(0.00%)#9,060 |
| 77. | El Duende | 1 | 5,303(0.02%)#77 | 924,665(0.00%)#9,097 |
| 78. | Jacona | 1 | 5,303(0.02%)#78 | 924,665(0.00%)#9,219 |
Common Questions
What are the Top 10 Cities with the Most Immigrants from Western Europe in New Mexico?
Top 10 Cities with the Most Immigrants from Western Europe in New Mexico are:
#1
2,209
#2
405
#3
347
#4
271
#5
128
#6
98
#7
78
#8
63
#9
62
#10
56
What city has the Most Immigrants from Western Europe in New Mexico?
Albuquerque has the Most Immigrants from Western Europe in New Mexico with 2,209.
What is the Total Immigrants from Western Europe in the State of New Mexico?
Total Immigrants from Western Europe in New Mexico is 5,303.
What is the Total Immigrants from Western Europe in the United States?
Total Immigrants from Western Europe in the United States is 924,665.