Cities with the Most Immigrants from Western Europe in Texas
RELATED REPORTS & OPTIONS
Western Europe
Texas
Compare Cities
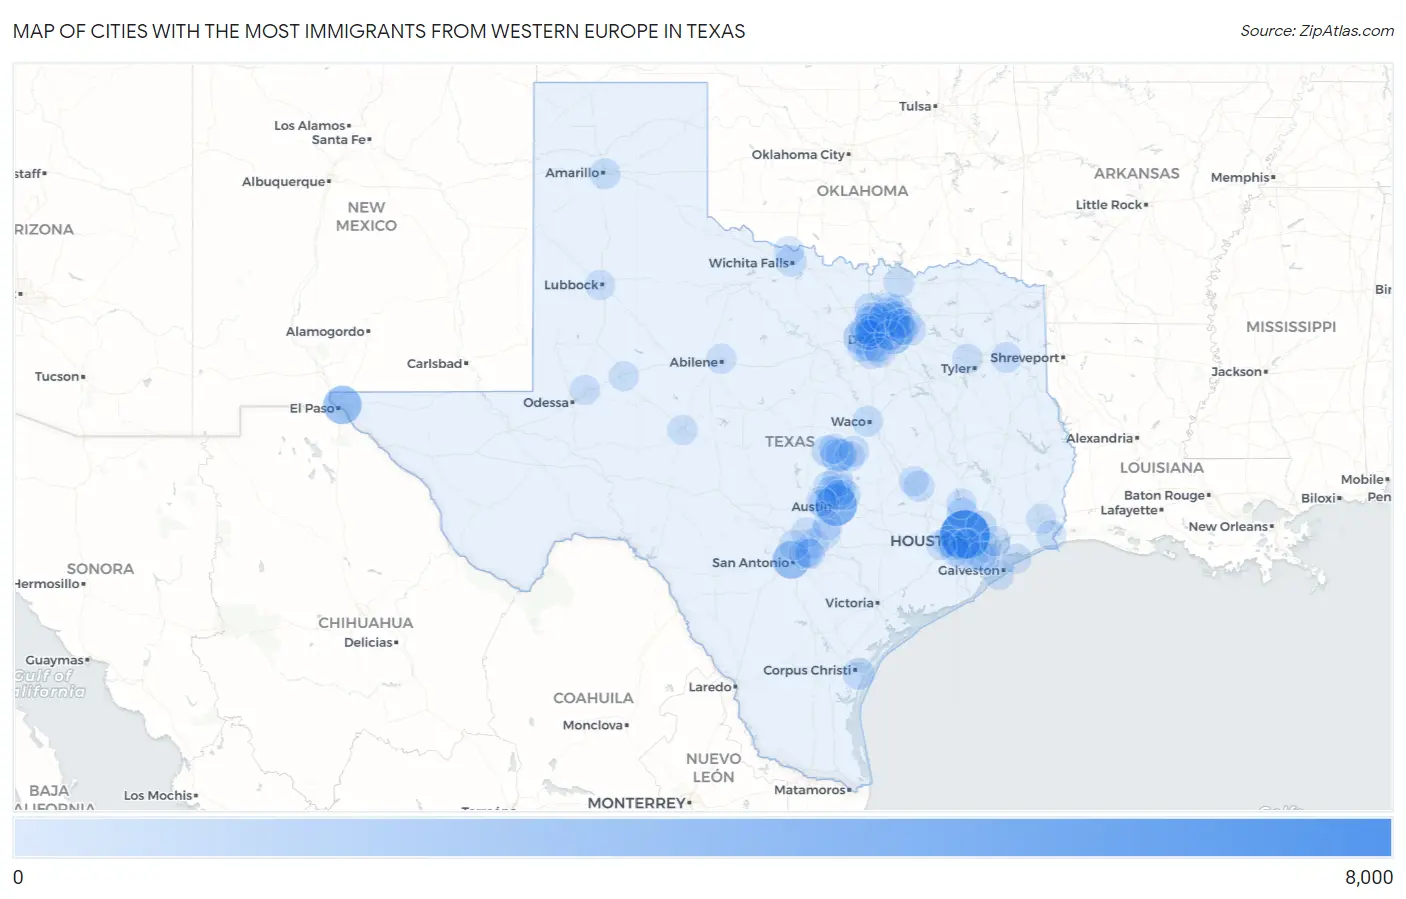
Map of Cities with the Most Immigrants from Western Europe in Texas
0
8,000
Cities with the Most Immigrants from Western Europe in Texas
| City | Western Europe | vs State | vs National | |
| 1. | Houston | 6,622 | 61,150(10.83%)#1 | 924,665(0.72%)#6 |
| 2. | Austin | 3,834 | 61,150(6.27%)#2 | 924,665(0.41%)#11 |
| 3. | El Paso | 2,729 | 61,150(4.46%)#3 | 924,665(0.30%)#17 |
| 4. | San Antonio | 2,584 | 61,150(4.23%)#4 | 924,665(0.28%)#18 |
| 5. | Dallas | 1,985 | 61,150(3.25%)#5 | 924,665(0.21%)#28 |
| 6. | Killeen | 1,303 | 61,150(2.13%)#6 | 924,665(0.14%)#46 |
| 7. | Plano | 1,227 | 61,150(2.01%)#7 | 924,665(0.13%)#54 |
| 8. | Fort Worth | 1,131 | 61,150(1.85%)#8 | 924,665(0.12%)#60 |
| 9. | Arlington | 875 | 61,150(1.43%)#9 | 924,665(0.09%)#90 |
| 10. | Frisco | 641 | 61,150(1.05%)#10 | 924,665(0.07%)#147 |
| 11. | The Woodlands | 589 | 61,150(0.96%)#11 | 924,665(0.06%)#165 |
| 12. | Corpus Christi | 583 | 61,150(0.95%)#12 | 924,665(0.06%)#167 |
| 13. | Copperas Cove | 565 | 61,150(0.92%)#13 | 924,665(0.06%)#174 |
| 14. | Harker Heights | 563 | 61,150(0.92%)#14 | 924,665(0.06%)#175 |
| 15. | Round Rock | 535 | 61,150(0.87%)#15 | 924,665(0.06%)#183 |
| 16. | Georgetown | 479 | 61,150(0.78%)#16 | 924,665(0.05%)#206 |
| 17. | Denton | 417 | 61,150(0.68%)#17 | 924,665(0.05%)#249 |
| 18. | Cinco Ranch | 414 | 61,150(0.68%)#18 | 924,665(0.04%)#254 |
| 19. | Lantana | 373 | 61,150(0.61%)#19 | 924,665(0.04%)#290 |
| 20. | College Station | 367 | 61,150(0.60%)#20 | 924,665(0.04%)#294 |
| 21. | Pflugerville | 354 | 61,150(0.58%)#21 | 924,665(0.04%)#309 |
| 22. | Coppell | 330 | 61,150(0.54%)#22 | 924,665(0.04%)#350 |
| 23. | Waco | 324 | 61,150(0.53%)#23 | 924,665(0.04%)#360 |
| 24. | Wichita Falls | 320 | 61,150(0.52%)#24 | 924,665(0.03%)#371 |
| 25. | Pearland | 307 | 61,150(0.50%)#25 | 924,665(0.03%)#394 |
| 26. | Atascocita | 285 | 61,150(0.47%)#26 | 924,665(0.03%)#428 |
| 27. | Amarillo | 282 | 61,150(0.46%)#27 | 924,665(0.03%)#430 |
| 28. | Mckinney | 273 | 61,150(0.45%)#28 | 924,665(0.03%)#451 |
| 29. | Garland | 264 | 61,150(0.43%)#29 | 924,665(0.03%)#465 |
| 30. | Richardson | 264 | 61,150(0.43%)#30 | 924,665(0.03%)#467 |
| 31. | Carrollton | 262 | 61,150(0.43%)#31 | 924,665(0.03%)#468 |
| 32. | Longview | 257 | 61,150(0.42%)#32 | 924,665(0.03%)#484 |
| 33. | Temple | 247 | 61,150(0.40%)#33 | 924,665(0.03%)#514 |
| 34. | Lewisville | 238 | 61,150(0.39%)#34 | 924,665(0.03%)#536 |
| 35. | League City | 231 | 61,150(0.38%)#35 | 924,665(0.02%)#561 |
| 36. | Sherman | 231 | 61,150(0.38%)#36 | 924,665(0.02%)#562 |
| 37. | Leander | 225 | 61,150(0.37%)#37 | 924,665(0.02%)#577 |
| 38. | Allen | 223 | 61,150(0.36%)#38 | 924,665(0.02%)#581 |
| 39. | Grapevine | 218 | 61,150(0.36%)#39 | 924,665(0.02%)#598 |
| 40. | San Marcos | 217 | 61,150(0.35%)#40 | 924,665(0.02%)#604 |
| 41. | Addison | 211 | 61,150(0.35%)#41 | 924,665(0.02%)#622 |
| 42. | Prosper | 206 | 61,150(0.34%)#42 | 924,665(0.02%)#637 |
| 43. | Wylie | 201 | 61,150(0.33%)#43 | 924,665(0.02%)#654 |
| 44. | Cedar Park | 196 | 61,150(0.32%)#44 | 924,665(0.02%)#674 |
| 45. | Mansfield | 192 | 61,150(0.31%)#45 | 924,665(0.02%)#695 |
| 46. | Pasadena | 190 | 61,150(0.31%)#46 | 924,665(0.02%)#701 |
| 47. | Southlake | 186 | 61,150(0.30%)#47 | 924,665(0.02%)#728 |
| 48. | Irving | 177 | 61,150(0.29%)#48 | 924,665(0.02%)#759 |
| 49. | Euless | 170 | 61,150(0.28%)#49 | 924,665(0.02%)#792 |
| 50. | Lubbock | 162 | 61,150(0.26%)#50 | 924,665(0.02%)#838 |
| 51. | Bryan | 160 | 61,150(0.26%)#51 | 924,665(0.02%)#849 |
| 52. | Sugar Land | 159 | 61,150(0.26%)#52 | 924,665(0.02%)#853 |
| 53. | North Richland Hills | 159 | 61,150(0.26%)#53 | 924,665(0.02%)#855 |
| 54. | Flower Mound | 158 | 61,150(0.26%)#54 | 924,665(0.02%)#859 |
| 55. | Bedford | 152 | 61,150(0.25%)#55 | 924,665(0.02%)#896 |
| 56. | Midland | 149 | 61,150(0.24%)#56 | 924,665(0.02%)#915 |
| 57. | Abilene | 149 | 61,150(0.24%)#57 | 924,665(0.02%)#916 |
| 58. | New Braunfels | 142 | 61,150(0.23%)#58 | 924,665(0.02%)#970 |
| 59. | Beaumont | 141 | 61,150(0.23%)#59 | 924,665(0.02%)#976 |
| 60. | Burkburnett | 131 | 61,150(0.21%)#60 | 924,665(0.01%)#1,066 |
| 61. | Missouri City | 129 | 61,150(0.21%)#61 | 924,665(0.01%)#1,075 |
| 62. | Mission Bend | 127 | 61,150(0.21%)#62 | 924,665(0.01%)#1,092 |
| 63. | Conroe | 126 | 61,150(0.21%)#63 | 924,665(0.01%)#1,097 |
| 64. | Forest Hill | 126 | 61,150(0.21%)#64 | 924,665(0.01%)#1,102 |
| 65. | Rockwall | 121 | 61,150(0.20%)#65 | 924,665(0.01%)#1,138 |
| 66. | Hurst | 121 | 61,150(0.20%)#66 | 924,665(0.01%)#1,139 |
| 67. | Universal City | 120 | 61,150(0.20%)#67 | 924,665(0.01%)#1,152 |
| 68. | Bee Cave | 120 | 61,150(0.20%)#68 | 924,665(0.01%)#1,156 |
| 69. | Schertz | 119 | 61,150(0.19%)#69 | 924,665(0.01%)#1,162 |
| 70. | Grand Prairie | 116 | 61,150(0.19%)#70 | 924,665(0.01%)#1,202 |
| 71. | Canyon Lake | 115 | 61,150(0.19%)#71 | 924,665(0.01%)#1,212 |
| 72. | Highland Park | 109 | 61,150(0.18%)#72 | 924,665(0.01%)#1,288 |
| 73. | Timberwood Park | 102 | 61,150(0.17%)#73 | 924,665(0.01%)#1,369 |
| 74. | Belton | 102 | 61,150(0.17%)#74 | 924,665(0.01%)#1,372 |
| 75. | Keller | 95 | 61,150(0.16%)#75 | 924,665(0.01%)#1,449 |
| 76. | Wells Branch | 95 | 61,150(0.16%)#76 | 924,665(0.01%)#1,458 |
| 77. | Cibolo | 93 | 61,150(0.15%)#77 | 924,665(0.01%)#1,480 |
| 78. | Galveston | 92 | 61,150(0.15%)#78 | 924,665(0.01%)#1,492 |
| 79. | Friendswood | 91 | 61,150(0.15%)#79 | 924,665(0.01%)#1,501 |
| 80. | University Park | 91 | 61,150(0.15%)#80 | 924,665(0.01%)#1,509 |
| 81. | Fort Hood | 88 | 61,150(0.14%)#81 | 924,665(0.01%)#1,550 |
| 82. | West University Place | 88 | 61,150(0.14%)#82 | 924,665(0.01%)#1,555 |
| 83. | Baytown | 86 | 61,150(0.14%)#83 | 924,665(0.01%)#1,580 |
| 84. | Cedar Hill | 86 | 61,150(0.14%)#84 | 924,665(0.01%)#1,582 |
| 85. | Colleyville | 86 | 61,150(0.14%)#85 | 924,665(0.01%)#1,585 |
| 86. | Lakeway | 86 | 61,150(0.14%)#86 | 924,665(0.01%)#1,587 |
| 87. | Lindale | 86 | 61,150(0.14%)#87 | 924,665(0.01%)#1,593 |
| 88. | San Angelo | 85 | 61,150(0.14%)#88 | 924,665(0.01%)#1,597 |
| 89. | Highland Village | 81 | 61,150(0.13%)#89 | 924,665(0.01%)#1,684 |
| 90. | Port Arthur | 80 | 61,150(0.13%)#90 | 924,665(0.01%)#1,694 |
| 91. | Belterra | 77 | 61,150(0.13%)#91 | 924,665(0.01%)#1,771 |
| 92. | Steiner Ranch | 75 | 61,150(0.12%)#92 | 924,665(0.01%)#1,793 |
| 93. | The Colony | 74 | 61,150(0.12%)#93 | 924,665(0.01%)#1,804 |
| 94. | Bellaire | 74 | 61,150(0.12%)#94 | 924,665(0.01%)#1,810 |
| 95. | Bolivar Peninsula | 73 | 61,150(0.12%)#95 | 924,665(0.01%)#1,844 |
| 96. | Murphy | 70 | 61,150(0.11%)#96 | 924,665(0.01%)#1,901 |
| 97. | Big Spring | 69 | 61,150(0.11%)#97 | 924,665(0.01%)#1,926 |
| 98. | Rowlett | 66 | 61,150(0.11%)#98 | 924,665(0.01%)#1,988 |
| 99. | Fulshear | 65 | 61,150(0.11%)#99 | 924,665(0.01%)#2,021 |
| 100. | Kyle | 63 | 61,150(0.10%)#100 | 924,665(0.01%)#2,062 |
Common Questions
What are the Top 10 Cities with the Most Immigrants from Western Europe in Texas?
Top 10 Cities with the Most Immigrants from Western Europe in Texas are:
#1
6,622
#2
3,834
#3
2,729
#4
2,584
#5
1,985
#6
1,303
#7
1,227
#8
1,131
#9
875
#10
641
What city has the Most Immigrants from Western Europe in Texas?
Houston has the Most Immigrants from Western Europe in Texas with 6,622.
What is the Total Immigrants from Western Europe in the State of Texas?
Total Immigrants from Western Europe in Texas is 61,150.
What is the Total Immigrants from Western Europe in the United States?
Total Immigrants from Western Europe in the United States is 924,665.