Cities with the Most Immigrants from Western Europe in Illinois
RELATED REPORTS & OPTIONS
Western Europe
Illinois
Compare Cities
Map of Cities with the Most Immigrants from Western Europe in Illinois
0
10,000
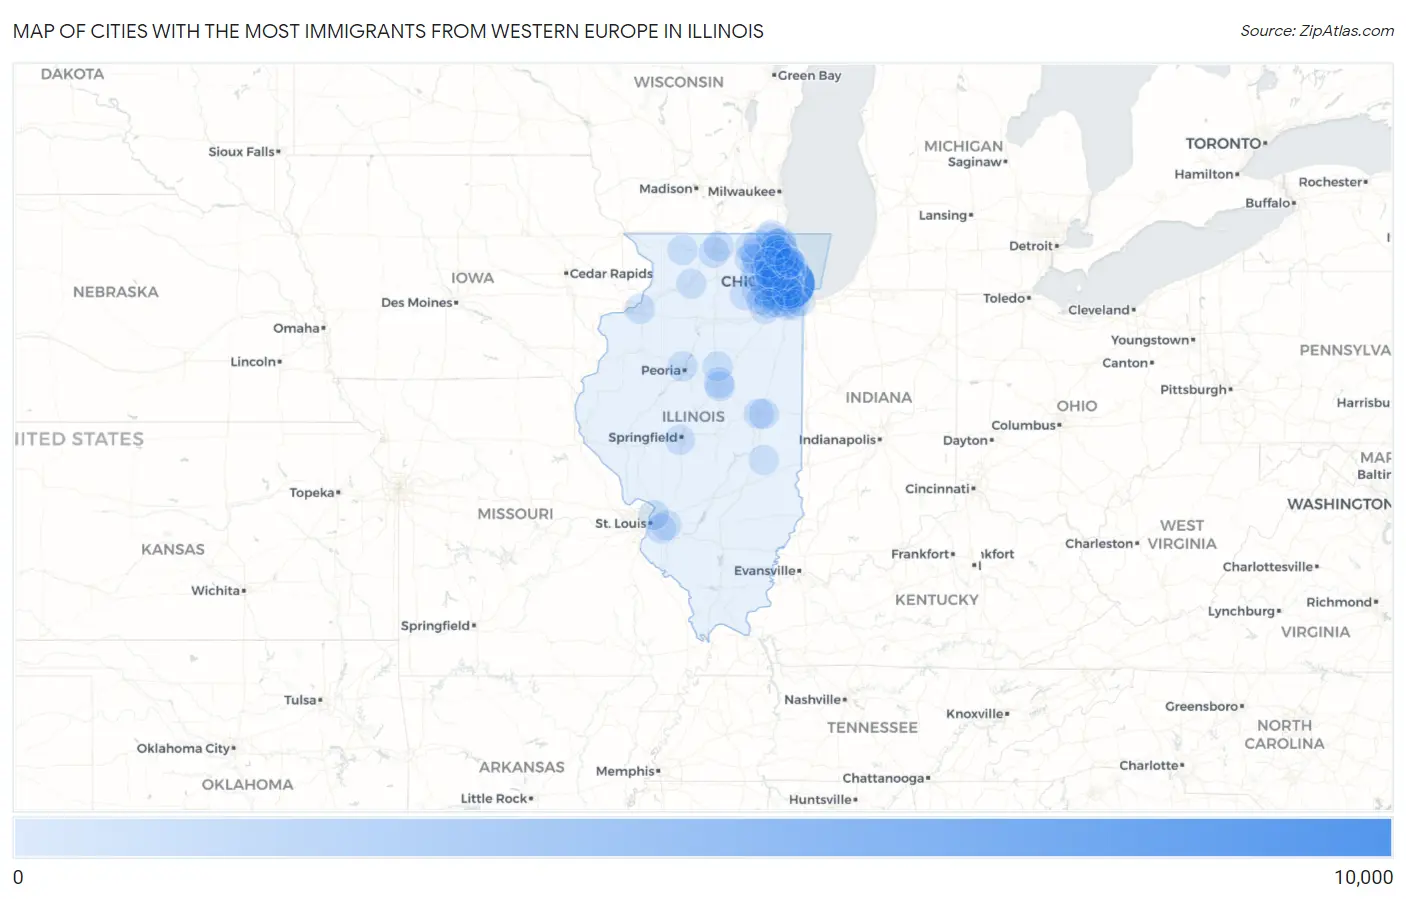
Cities with the Most Immigrants from Western Europe in Illinois
| City | Western Europe | vs State | vs National | |
| 1. | Chicago | 8,649 | 30,750(28.13%)#1 | 924,665(0.94%)#4 |
| 2. | Evanston | 730 | 30,750(2.37%)#2 | 924,665(0.08%)#120 |
| 3. | Naperville | 541 | 30,750(1.76%)#3 | 924,665(0.06%)#181 |
| 4. | Des Plaines | 343 | 30,750(1.12%)#4 | 924,665(0.04%)#329 |
| 5. | Skokie | 329 | 30,750(1.07%)#5 | 924,665(0.04%)#353 |
| 6. | Oak Park | 298 | 30,750(0.97%)#6 | 924,665(0.03%)#404 |
| 7. | Arlington Heights | 294 | 30,750(0.96%)#7 | 924,665(0.03%)#412 |
| 8. | Wilmette | 278 | 30,750(0.90%)#8 | 924,665(0.03%)#442 |
| 9. | Aurora | 266 | 30,750(0.87%)#9 | 924,665(0.03%)#463 |
| 10. | Schaumburg | 250 | 30,750(0.81%)#10 | 924,665(0.03%)#506 |
| 11. | Palatine | 226 | 30,750(0.73%)#11 | 924,665(0.02%)#571 |
| 12. | Rockford | 217 | 30,750(0.71%)#12 | 924,665(0.02%)#601 |
| 13. | Highland Park | 206 | 30,750(0.67%)#13 | 924,665(0.02%)#638 |
| 14. | Niles | 202 | 30,750(0.66%)#14 | 924,665(0.02%)#650 |
| 15. | Wheaton | 196 | 30,750(0.64%)#15 | 924,665(0.02%)#677 |
| 16. | Lake Zurich | 195 | 30,750(0.63%)#16 | 924,665(0.02%)#680 |
| 17. | Joliet | 189 | 30,750(0.61%)#17 | 924,665(0.02%)#710 |
| 18. | Park Ridge | 189 | 30,750(0.61%)#18 | 924,665(0.02%)#713 |
| 19. | Champaign | 185 | 30,750(0.60%)#19 | 924,665(0.02%)#732 |
| 20. | Downers Grove | 181 | 30,750(0.59%)#20 | 924,665(0.02%)#747 |
| 21. | Plano | 177 | 30,750(0.58%)#21 | 924,665(0.02%)#764 |
| 22. | Elmhurst | 175 | 30,750(0.57%)#22 | 924,665(0.02%)#771 |
| 23. | Northbrook | 175 | 30,750(0.57%)#23 | 924,665(0.02%)#773 |
| 24. | Peoria | 172 | 30,750(0.56%)#24 | 924,665(0.02%)#781 |
| 25. | Glenview | 167 | 30,750(0.54%)#25 | 924,665(0.02%)#813 |
| 26. | Normal | 161 | 30,750(0.52%)#26 | 924,665(0.02%)#844 |
| 27. | North Chicago | 161 | 30,750(0.52%)#27 | 924,665(0.02%)#846 |
| 28. | Elgin | 157 | 30,750(0.51%)#28 | 924,665(0.02%)#865 |
| 29. | Urbana | 157 | 30,750(0.51%)#29 | 924,665(0.02%)#868 |
| 30. | Gurnee | 157 | 30,750(0.51%)#30 | 924,665(0.02%)#869 |
| 31. | Carol Stream | 154 | 30,750(0.50%)#31 | 924,665(0.02%)#887 |
| 32. | Woodridge | 153 | 30,750(0.50%)#32 | 924,665(0.02%)#893 |
| 33. | Lake Forest | 149 | 30,750(0.48%)#33 | 924,665(0.02%)#920 |
| 34. | St Charles | 146 | 30,750(0.47%)#34 | 924,665(0.02%)#944 |
| 35. | Lake Villa | 140 | 30,750(0.46%)#35 | 924,665(0.02%)#992 |
| 36. | Buffalo Grove | 139 | 30,750(0.45%)#36 | 924,665(0.02%)#998 |
| 37. | Crystal Lake | 139 | 30,750(0.45%)#37 | 924,665(0.02%)#999 |
| 38. | Wheeling | 137 | 30,750(0.45%)#38 | 924,665(0.01%)#1,011 |
| 39. | Lombard | 131 | 30,750(0.43%)#39 | 924,665(0.01%)#1,060 |
| 40. | Rolling Meadows | 131 | 30,750(0.43%)#40 | 924,665(0.01%)#1,062 |
| 41. | Round Lake Park | 131 | 30,750(0.43%)#41 | 924,665(0.01%)#1,067 |
| 42. | Huntley | 126 | 30,750(0.41%)#42 | 924,665(0.01%)#1,099 |
| 43. | Springfield | 124 | 30,750(0.40%)#43 | 924,665(0.01%)#1,114 |
| 44. | Mundelein | 124 | 30,750(0.40%)#44 | 924,665(0.01%)#1,118 |
| 45. | Vernon Hills | 124 | 30,750(0.40%)#45 | 924,665(0.01%)#1,120 |
| 46. | Lincolnwood | 121 | 30,750(0.39%)#46 | 924,665(0.01%)#1,146 |
| 47. | Palos Heights | 121 | 30,750(0.39%)#47 | 924,665(0.01%)#1,147 |
| 48. | Westmont | 119 | 30,750(0.39%)#48 | 924,665(0.01%)#1,168 |
| 49. | East Moline | 119 | 30,750(0.39%)#49 | 924,665(0.01%)#1,169 |
| 50. | Orland Park | 118 | 30,750(0.38%)#50 | 924,665(0.01%)#1,175 |
| 51. | Mount Prospect | 118 | 30,750(0.38%)#51 | 924,665(0.01%)#1,176 |
| 52. | Willow Springs | 118 | 30,750(0.38%)#52 | 924,665(0.01%)#1,189 |
| 53. | Burr Ridge | 116 | 30,750(0.38%)#53 | 924,665(0.01%)#1,208 |
| 54. | Hoffman Estates | 113 | 30,750(0.37%)#54 | 924,665(0.01%)#1,234 |
| 55. | Streamwood | 112 | 30,750(0.36%)#55 | 924,665(0.01%)#1,247 |
| 56. | O Fallon | 109 | 30,750(0.35%)#56 | 924,665(0.01%)#1,280 |
| 57. | Swansea | 108 | 30,750(0.35%)#57 | 924,665(0.01%)#1,302 |
| 58. | Wood Dale | 107 | 30,750(0.35%)#58 | 924,665(0.01%)#1,312 |
| 59. | Granite City | 105 | 30,750(0.34%)#59 | 924,665(0.01%)#1,336 |
| 60. | Villa Park | 104 | 30,750(0.34%)#60 | 924,665(0.01%)#1,345 |
| 61. | Crestwood | 102 | 30,750(0.33%)#61 | 924,665(0.01%)#1,378 |
| 62. | Glencoe | 102 | 30,750(0.33%)#62 | 924,665(0.01%)#1,380 |
| 63. | Bolingbrook | 100 | 30,750(0.33%)#63 | 924,665(0.01%)#1,399 |
| 64. | Loves Park | 96 | 30,750(0.31%)#64 | 924,665(0.01%)#1,444 |
| 65. | Berwyn | 94 | 30,750(0.31%)#65 | 924,665(0.01%)#1,468 |
| 66. | La Grange | 94 | 30,750(0.31%)#66 | 924,665(0.01%)#1,475 |
| 67. | Tinley Park | 92 | 30,750(0.30%)#67 | 924,665(0.01%)#1,491 |
| 68. | Lemont | 91 | 30,750(0.30%)#68 | 924,665(0.01%)#1,513 |
| 69. | Cicero | 87 | 30,750(0.28%)#69 | 924,665(0.01%)#1,565 |
| 70. | Homer Glen | 87 | 30,750(0.28%)#70 | 924,665(0.01%)#1,568 |
| 71. | Waukegan | 85 | 30,750(0.28%)#71 | 924,665(0.01%)#1,598 |
| 72. | Bloomington | 84 | 30,750(0.27%)#72 | 924,665(0.01%)#1,618 |
| 73. | Plainfield | 84 | 30,750(0.27%)#73 | 924,665(0.01%)#1,619 |
| 74. | Bloomingdale | 83 | 30,750(0.27%)#74 | 924,665(0.01%)#1,641 |
| 75. | Forest Park | 83 | 30,750(0.27%)#75 | 924,665(0.01%)#1,646 |
| 76. | Algonquin | 82 | 30,750(0.27%)#76 | 924,665(0.01%)#1,655 |
| 77. | El Paso | 80 | 30,750(0.26%)#77 | 924,665(0.01%)#1,707 |
| 78. | Oak Lawn | 78 | 30,750(0.25%)#78 | 924,665(0.01%)#1,735 |
| 79. | Norridge | 78 | 30,750(0.25%)#79 | 924,665(0.01%)#1,745 |
| 80. | Mchenry | 75 | 30,750(0.24%)#80 | 924,665(0.01%)#1,791 |
| 81. | Woodstock | 75 | 30,750(0.24%)#81 | 924,665(0.01%)#1,792 |
| 82. | Warrenville | 75 | 30,750(0.24%)#82 | 924,665(0.01%)#1,794 |
| 83. | Freeport | 74 | 30,750(0.24%)#83 | 924,665(0.01%)#1,806 |
| 84. | Homewood | 74 | 30,750(0.24%)#84 | 924,665(0.01%)#1,809 |
| 85. | Addison | 73 | 30,750(0.24%)#85 | 924,665(0.01%)#1,823 |
| 86. | Glen Ellyn | 73 | 30,750(0.24%)#86 | 924,665(0.01%)#1,826 |
| 87. | Dixon | 71 | 30,750(0.23%)#87 | 924,665(0.01%)#1,881 |
| 88. | Calumet City | 70 | 30,750(0.23%)#88 | 924,665(0.01%)#1,896 |
| 89. | Roselle | 69 | 30,750(0.22%)#89 | 924,665(0.01%)#1,929 |
| 90. | Deerfield | 69 | 30,750(0.22%)#90 | 924,665(0.01%)#1,931 |
| 91. | Charleston | 66 | 30,750(0.21%)#91 | 924,665(0.01%)#1,999 |
| 92. | Gages Lake | 65 | 30,750(0.21%)#92 | 924,665(0.01%)#2,026 |
| 93. | Northfield | 63 | 30,750(0.20%)#93 | 924,665(0.01%)#2,087 |
| 94. | Crest Hill | 62 | 30,750(0.20%)#94 | 924,665(0.01%)#2,108 |
| 95. | Antioch | 62 | 30,750(0.20%)#95 | 924,665(0.01%)#2,112 |
| 96. | Lincolnshire | 62 | 30,750(0.20%)#96 | 924,665(0.01%)#2,120 |
| 97. | Burbank | 61 | 30,750(0.20%)#97 | 924,665(0.01%)#2,143 |
| 98. | Libertyville | 60 | 30,750(0.20%)#98 | 924,665(0.01%)#2,174 |
| 99. | Inverness | 60 | 30,750(0.20%)#99 | 924,665(0.01%)#2,184 |
| 100. | Winnetka | 59 | 30,750(0.19%)#100 | 924,665(0.01%)#2,208 |
Common Questions
What are the Top 10 Cities with the Most Immigrants from Western Europe in Illinois?
Top 10 Cities with the Most Immigrants from Western Europe in Illinois are:
#1
8,649
#2
730
#3
541
#4
343
#5
329
#6
298
#7
294
#8
278
#9
266
#10
250
What city has the Most Immigrants from Western Europe in Illinois?
Chicago has the Most Immigrants from Western Europe in Illinois with 8,649.
What is the Total Immigrants from Western Europe in the State of Illinois?
Total Immigrants from Western Europe in Illinois is 30,750.
What is the Total Immigrants from Western Europe in the United States?
Total Immigrants from Western Europe in the United States is 924,665.