Cities with the Most Immigrants from Western Europe in Michigan
RELATED REPORTS & OPTIONS
Western Europe
Michigan
Compare Cities
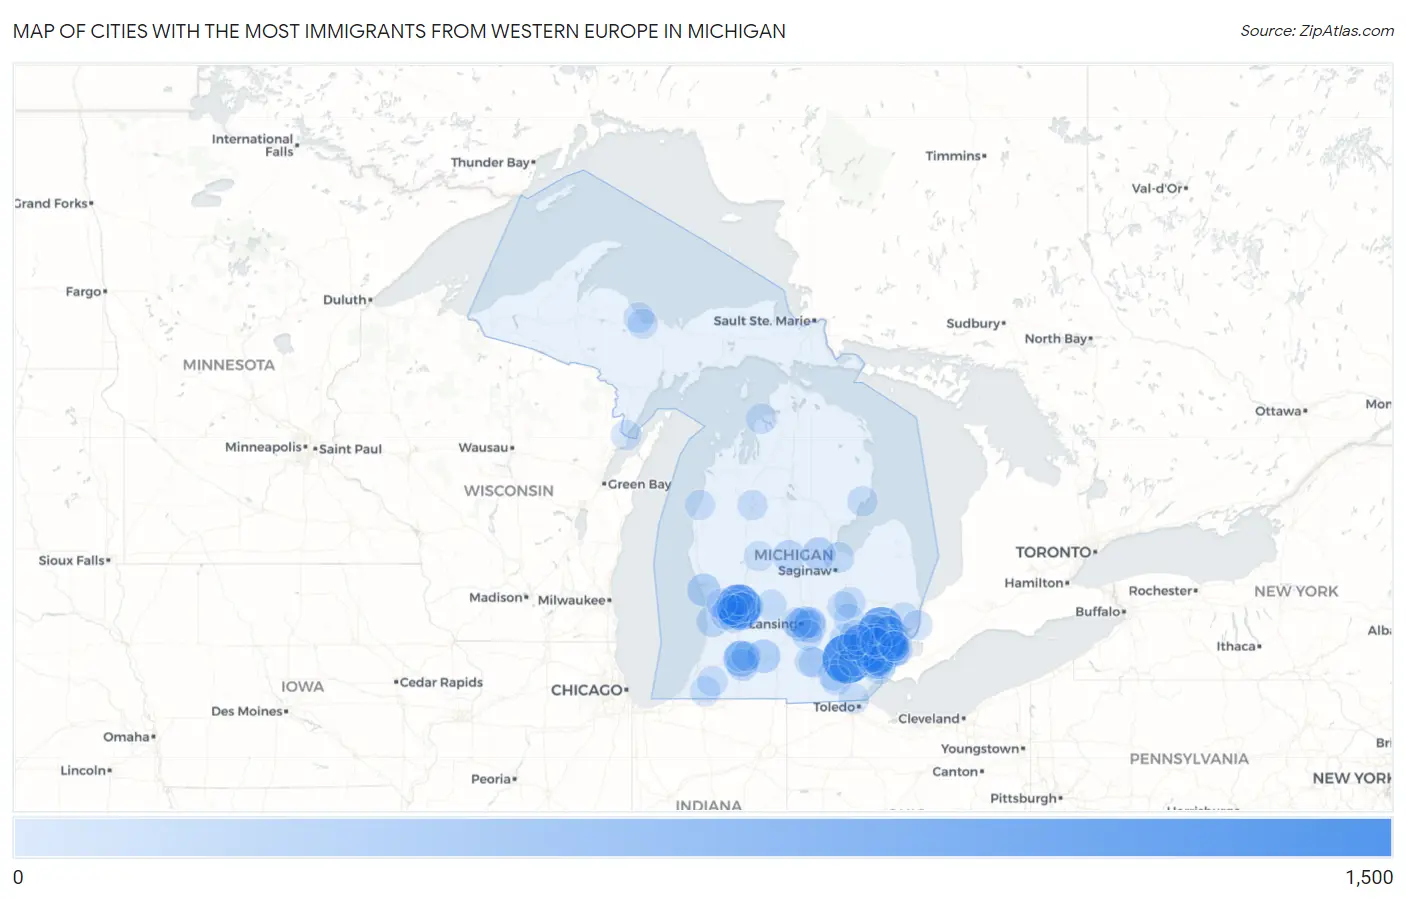
Map of Cities with the Most Immigrants from Western Europe in Michigan
0
1,500
Cities with the Most Immigrants from Western Europe in Michigan
| City | Western Europe | vs State | vs National | |
| 1. | Ann Arbor | 1,069 | 24,658(4.34%)#1 | 924,665(0.12%)#70 |
| 2. | Grand Rapids | 772 | 24,658(3.13%)#2 | 924,665(0.08%)#107 |
| 3. | Rochester Hills | 741 | 24,658(3.01%)#3 | 924,665(0.08%)#118 |
| 4. | Sterling Heights | 473 | 24,658(1.92%)#4 | 924,665(0.05%)#209 |
| 5. | Novi | 427 | 24,658(1.73%)#5 | 924,665(0.05%)#242 |
| 6. | Kentwood | 421 | 24,658(1.71%)#6 | 924,665(0.05%)#246 |
| 7. | Troy | 382 | 24,658(1.55%)#7 | 924,665(0.04%)#281 |
| 8. | Detroit | 377 | 24,658(1.53%)#8 | 924,665(0.04%)#284 |
| 9. | Farmington Hills | 335 | 24,658(1.36%)#9 | 924,665(0.04%)#341 |
| 10. | Kalamazoo | 321 | 24,658(1.30%)#10 | 924,665(0.03%)#368 |
| 11. | Warren | 306 | 24,658(1.24%)#11 | 924,665(0.03%)#396 |
| 12. | Dearborn | 274 | 24,658(1.11%)#12 | 924,665(0.03%)#448 |
| 13. | Royal Oak | 236 | 24,658(0.96%)#13 | 924,665(0.03%)#547 |
| 14. | Livonia | 221 | 24,658(0.90%)#14 | 924,665(0.02%)#585 |
| 15. | Battle Creek | 198 | 24,658(0.80%)#15 | 924,665(0.02%)#662 |
| 16. | Wyoming | 184 | 24,658(0.75%)#16 | 924,665(0.02%)#735 |
| 17. | Lansing | 176 | 24,658(0.71%)#17 | 924,665(0.02%)#766 |
| 18. | Norton Shores | 171 | 24,658(0.69%)#18 | 924,665(0.02%)#789 |
| 19. | Okemos | 168 | 24,658(0.68%)#19 | 924,665(0.02%)#808 |
| 20. | Midland | 164 | 24,658(0.67%)#20 | 924,665(0.02%)#830 |
| 21. | Westland | 151 | 24,658(0.61%)#21 | 924,665(0.02%)#899 |
| 22. | St Clair Shores | 146 | 24,658(0.59%)#22 | 924,665(0.02%)#939 |
| 23. | Roseville | 141 | 24,658(0.57%)#23 | 924,665(0.02%)#980 |
| 24. | Birmingham | 141 | 24,658(0.57%)#24 | 924,665(0.02%)#982 |
| 25. | East Lansing | 139 | 24,658(0.56%)#25 | 924,665(0.02%)#996 |
| 26. | Mount Pleasant | 129 | 24,658(0.52%)#26 | 924,665(0.01%)#1,077 |
| 27. | Bingham Farms | 125 | 24,658(0.51%)#27 | 924,665(0.01%)#1,113 |
| 28. | Holland | 121 | 24,658(0.49%)#28 | 924,665(0.01%)#1,142 |
| 29. | Beverly Hills | 111 | 24,658(0.45%)#29 | 924,665(0.01%)#1,260 |
| 30. | Portage | 107 | 24,658(0.43%)#30 | 924,665(0.01%)#1,310 |
| 31. | Hudsonville | 99 | 24,658(0.40%)#31 | 924,665(0.01%)#1,416 |
| 32. | Southfield | 93 | 24,658(0.38%)#32 | 924,665(0.01%)#1,478 |
| 33. | Forest Hills | 91 | 24,658(0.37%)#33 | 924,665(0.01%)#1,508 |
| 34. | Taylor | 81 | 24,658(0.33%)#34 | 924,665(0.01%)#1,673 |
| 35. | Jenison | 81 | 24,658(0.33%)#35 | 924,665(0.01%)#1,682 |
| 36. | Trenton | 79 | 24,658(0.32%)#36 | 924,665(0.01%)#1,721 |
| 37. | Garden City | 77 | 24,658(0.31%)#37 | 924,665(0.01%)#1,760 |
| 38. | Westwood | 74 | 24,658(0.30%)#38 | 924,665(0.01%)#1,814 |
| 39. | Allen Park | 73 | 24,658(0.30%)#39 | 924,665(0.01%)#1,825 |
| 40. | Dearborn Heights | 72 | 24,658(0.29%)#40 | 924,665(0.01%)#1,848 |
| 41. | Haslett | 72 | 24,658(0.29%)#41 | 924,665(0.01%)#1,855 |
| 42. | Clinton | 67 | 24,658(0.27%)#42 | 924,665(0.01%)#1,984 |
| 43. | Saline | 65 | 24,658(0.26%)#43 | 924,665(0.01%)#2,029 |
| 44. | Bay City | 63 | 24,658(0.26%)#44 | 924,665(0.01%)#2,065 |
| 45. | Grosse Pointe | 63 | 24,658(0.26%)#45 | 924,665(0.01%)#2,088 |
| 46. | Grosse Pointe Park | 62 | 24,658(0.25%)#46 | 924,665(0.01%)#2,116 |
| 47. | Wyandotte | 60 | 24,658(0.24%)#47 | 924,665(0.01%)#2,170 |
| 48. | Brighton | 60 | 24,658(0.24%)#48 | 924,665(0.01%)#2,185 |
| 49. | Tecumseh | 59 | 24,658(0.24%)#49 | 924,665(0.01%)#2,211 |
| 50. | Southgate | 57 | 24,658(0.23%)#50 | 924,665(0.01%)#2,252 |
| 51. | Ferndale | 57 | 24,658(0.23%)#51 | 924,665(0.01%)#2,257 |
| 52. | Flint | 54 | 24,658(0.22%)#52 | 924,665(0.01%)#2,350 |
| 53. | Ionia | 52 | 24,658(0.21%)#53 | 924,665(0.01%)#2,442 |
| 54. | Grosse Pointe Farms | 52 | 24,658(0.21%)#54 | 924,665(0.01%)#2,446 |
| 55. | Madison Heights | 51 | 24,658(0.21%)#55 | 924,665(0.01%)#2,473 |
| 56. | Mason | 51 | 24,658(0.21%)#56 | 924,665(0.01%)#2,485 |
| 57. | Plymouth | 50 | 24,658(0.20%)#57 | 924,665(0.01%)#2,518 |
| 58. | Northville | 50 | 24,658(0.20%)#58 | 924,665(0.01%)#2,521 |
| 59. | Byron Center | 47 | 24,658(0.19%)#59 | 924,665(0.01%)#2,630 |
| 60. | Jackson | 46 | 24,658(0.19%)#60 | 924,665(0.00%)#2,644 |
| 61. | Ypsilanti | 46 | 24,658(0.19%)#61 | 924,665(0.00%)#2,648 |
| 62. | Huntington Woods | 45 | 24,658(0.18%)#62 | 924,665(0.00%)#2,716 |
| 63. | Walker | 44 | 24,658(0.18%)#63 | 924,665(0.00%)#2,744 |
| 64. | Rochester | 44 | 24,658(0.18%)#64 | 924,665(0.00%)#2,754 |
| 65. | Lincoln Park | 43 | 24,658(0.17%)#65 | 924,665(0.00%)#2,781 |
| 66. | Inkster | 43 | 24,658(0.17%)#66 | 924,665(0.00%)#2,787 |
| 67. | Lambertville | 42 | 24,658(0.17%)#67 | 924,665(0.00%)#2,850 |
| 68. | Michigan Center | 42 | 24,658(0.17%)#68 | 924,665(0.00%)#2,859 |
| 69. | Northview | 41 | 24,658(0.17%)#69 | 924,665(0.00%)#2,888 |
| 70. | Comstock Park | 40 | 24,658(0.16%)#70 | 924,665(0.00%)#2,948 |
| 71. | Menominee | 39 | 24,658(0.16%)#71 | 924,665(0.00%)#3,006 |
| 72. | Richmond | 38 | 24,658(0.15%)#72 | 924,665(0.00%)#3,080 |
| 73. | Eastpointe | 36 | 24,658(0.15%)#73 | 924,665(0.00%)#3,158 |
| 74. | Niles | 36 | 24,658(0.15%)#74 | 924,665(0.00%)#3,179 |
| 75. | Charlevoix | 36 | 24,658(0.15%)#75 | 924,665(0.00%)#3,207 |
| 76. | South Lyon | 35 | 24,658(0.14%)#76 | 924,665(0.00%)#3,238 |
| 77. | East Tawas | 35 | 24,658(0.14%)#77 | 924,665(0.00%)#3,259 |
| 78. | Franklin | 35 | 24,658(0.14%)#78 | 924,665(0.00%)#3,260 |
| 79. | Marquette | 34 | 24,658(0.14%)#79 | 924,665(0.00%)#3,279 |
| 80. | Auburn Hills | 33 | 24,658(0.13%)#80 | 924,665(0.00%)#3,330 |
| 81. | Fenton | 33 | 24,658(0.13%)#81 | 924,665(0.00%)#3,340 |
| 82. | Pontiac | 32 | 24,658(0.13%)#82 | 924,665(0.00%)#3,380 |
| 83. | Waverly | 32 | 24,658(0.13%)#83 | 924,665(0.00%)#3,393 |
| 84. | Dowagiac | 31 | 24,658(0.13%)#84 | 924,665(0.00%)#3,502 |
| 85. | East Grand Rapids | 30 | 24,658(0.12%)#85 | 924,665(0.00%)#3,563 |
| 86. | Milford | 30 | 24,658(0.12%)#86 | 924,665(0.00%)#3,582 |
| 87. | Allendale | 29 | 24,658(0.12%)#87 | 924,665(0.00%)#3,617 |
| 88. | Grandville | 29 | 24,658(0.12%)#88 | 924,665(0.00%)#3,629 |
| 89. | Harper Woods | 29 | 24,658(0.12%)#89 | 924,665(0.00%)#3,631 |
| 90. | Utica | 29 | 24,658(0.12%)#90 | 924,665(0.00%)#3,666 |
| 91. | Marine City | 29 | 24,658(0.12%)#91 | 924,665(0.00%)#3,669 |
| 92. | Harvey | 29 | 24,658(0.12%)#92 | 924,665(0.00%)#3,675 |
| 93. | Wixom | 28 | 24,658(0.11%)#93 | 924,665(0.00%)#3,707 |
| 94. | Grosse Pointe Woods | 27 | 24,658(0.11%)#94 | 924,665(0.00%)#3,780 |
| 95. | Cadillac | 27 | 24,658(0.11%)#95 | 924,665(0.00%)#3,796 |
| 96. | Swartz Creek | 27 | 24,658(0.11%)#96 | 924,665(0.00%)#3,815 |
| 97. | Comstock Northwest | 26 | 24,658(0.11%)#97 | 924,665(0.00%)#3,892 |
| 98. | Lathrup Village | 26 | 24,658(0.11%)#98 | 924,665(0.00%)#3,901 |
| 99. | Manistee | 25 | 24,658(0.10%)#99 | 924,665(0.00%)#3,969 |
| 100. | Canadian Lakes | 25 | 24,658(0.10%)#100 | 924,665(0.00%)#3,985 |
Common Questions
What are the Top 10 Cities with the Most Immigrants from Western Europe in Michigan?
Top 10 Cities with the Most Immigrants from Western Europe in Michigan are:
#1
1,069
#2
772
#3
741
#4
473
#5
427
#6
421
#7
382
#8
377
#9
335
#10
321
What city has the Most Immigrants from Western Europe in Michigan?
Ann Arbor has the Most Immigrants from Western Europe in Michigan with 1,069.
What is the Total Immigrants from Western Europe in the State of Michigan?
Total Immigrants from Western Europe in Michigan is 24,658.
What is the Total Immigrants from Western Europe in the United States?
Total Immigrants from Western Europe in the United States is 924,665.