Cities with the Most Immigrants from Western Europe in Georgia
RELATED REPORTS & OPTIONS
Western Europe
Georgia
Compare Cities
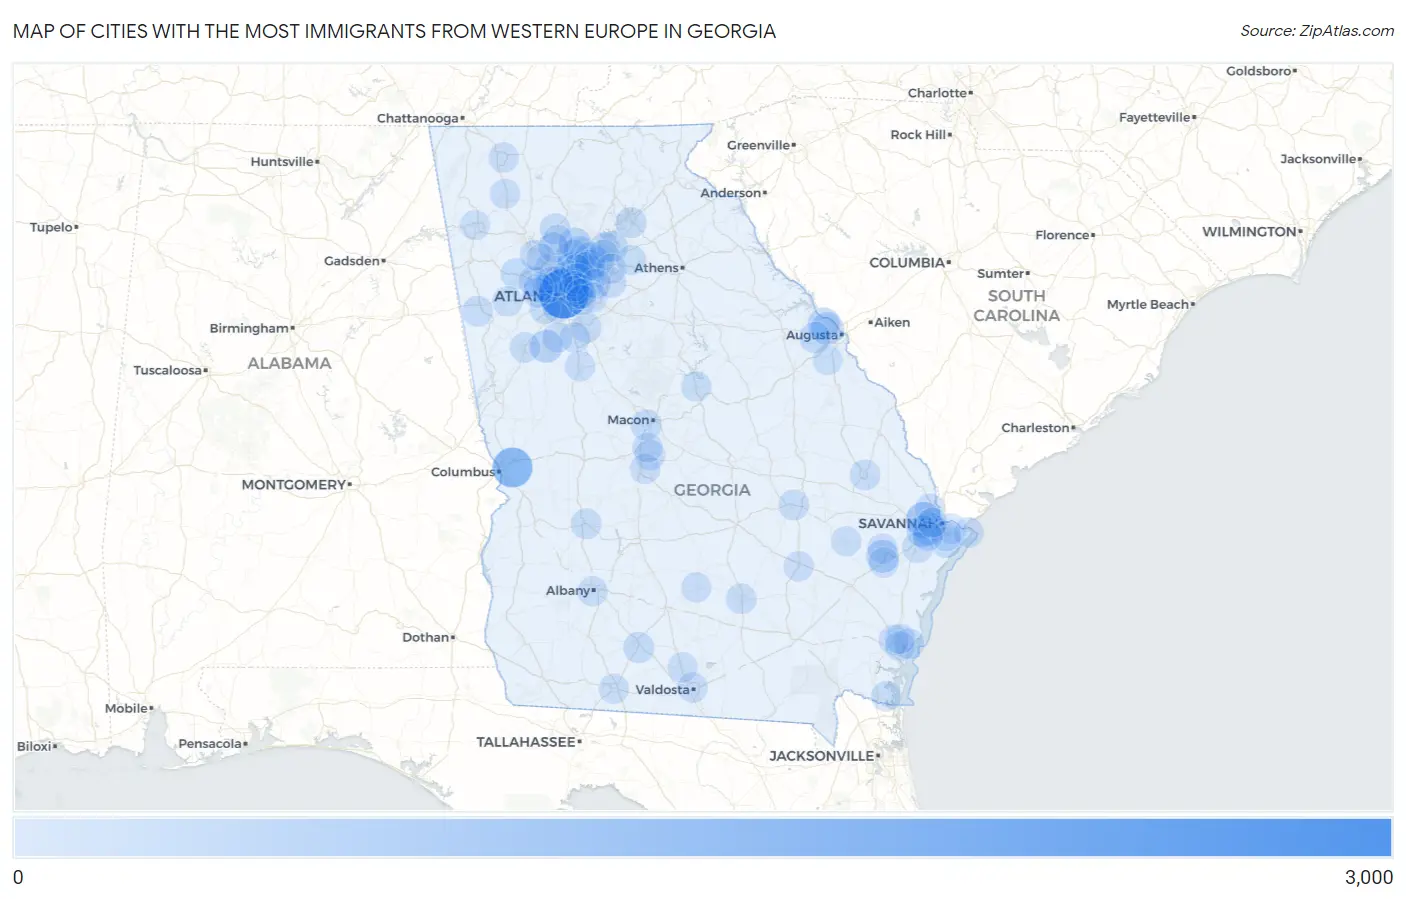
Map of Cities with the Most Immigrants from Western Europe in Georgia
0
3,000
Cities with the Most Immigrants from Western Europe in Georgia
| City | Western Europe | vs State | vs National | |
| 1. | Atlanta | 2,518 | 26,669(9.44%)#1 | 924,665(0.27%)#19 |
| 2. | Columbus | 1,245 | 26,669(4.67%)#2 | 924,665(0.13%)#52 |
| 3. | Pooler | 729 | 26,669(2.73%)#3 | 924,665(0.08%)#121 |
| 4. | Sandy Springs | 594 | 26,669(2.23%)#4 | 924,665(0.06%)#163 |
| 5. | Augusta-Richmond County Consolidated Government (Balance) | 520 | 26,669(1.95%)#5 | 924,665(0.06%)#189 |
| 6. | Savannah | 366 | 26,669(1.37%)#6 | 924,665(0.04%)#295 |
| 7. | Athens-Clarke County Unified Government (Balance) | 347 | 26,669(1.30%)#7 | 924,665(0.04%)#315 |
| 8. | Martinez | 347 | 26,669(1.30%)#8 | 924,665(0.04%)#320 |
| 9. | Hinesville | 346 | 26,669(1.30%)#9 | 924,665(0.04%)#324 |
| 10. | Peachtree City | 342 | 26,669(1.28%)#10 | 924,665(0.04%)#332 |
| 11. | Roswell | 339 | 26,669(1.27%)#11 | 924,665(0.04%)#336 |
| 12. | Brookhaven | 323 | 26,669(1.21%)#12 | 924,665(0.03%)#362 |
| 13. | Alpharetta | 311 | 26,669(1.17%)#13 | 924,665(0.03%)#388 |
| 14. | Evans | 275 | 26,669(1.03%)#14 | 924,665(0.03%)#447 |
| 15. | Milton | 273 | 26,669(1.02%)#15 | 924,665(0.03%)#452 |
| 16. | Henderson | 238 | 26,669(0.89%)#16 | 924,665(0.03%)#543 |
| 17. | Smyrna | 216 | 26,669(0.81%)#17 | 924,665(0.02%)#609 |
| 18. | Duluth | 167 | 26,669(0.63%)#18 | 924,665(0.02%)#815 |
| 19. | Decatur | 157 | 26,669(0.59%)#19 | 924,665(0.02%)#870 |
| 20. | Dunwoody | 155 | 26,669(0.58%)#20 | 924,665(0.02%)#880 |
| 21. | Grovetown | 154 | 26,669(0.58%)#21 | 924,665(0.02%)#889 |
| 22. | Dallas | 144 | 26,669(0.54%)#22 | 924,665(0.02%)#959 |
| 23. | Tucker | 136 | 26,669(0.51%)#23 | 924,665(0.01%)#1,018 |
| 24. | Johns Creek | 135 | 26,669(0.51%)#24 | 924,665(0.01%)#1,025 |
| 25. | Macon Bibb County | 134 | 26,669(0.50%)#25 | 924,665(0.01%)#1,030 |
| 26. | Norcross | 131 | 26,669(0.49%)#26 | 924,665(0.01%)#1,064 |
| 27. | Moultrie | 131 | 26,669(0.49%)#27 | 924,665(0.01%)#1,065 |
| 28. | Buford | 117 | 26,669(0.44%)#28 | 924,665(0.01%)#1,197 |
| 29. | Skidaway Island | 106 | 26,669(0.40%)#29 | 924,665(0.01%)#1,327 |
| 30. | Peachtree Corners | 104 | 26,669(0.39%)#30 | 924,665(0.01%)#1,340 |
| 31. | Canton | 101 | 26,669(0.38%)#31 | 924,665(0.01%)#1,389 |
| 32. | Chamblee | 98 | 26,669(0.37%)#32 | 924,665(0.01%)#1,422 |
| 33. | Marietta | 97 | 26,669(0.36%)#33 | 924,665(0.01%)#1,432 |
| 34. | Richmond Hill | 97 | 26,669(0.36%)#34 | 924,665(0.01%)#1,437 |
| 35. | North Decatur | 95 | 26,669(0.36%)#35 | 924,665(0.01%)#1,454 |
| 36. | Vidalia | 93 | 26,669(0.35%)#36 | 924,665(0.01%)#1,484 |
| 37. | Gainesville | 92 | 26,669(0.34%)#37 | 924,665(0.01%)#1,494 |
| 38. | Statesboro | 91 | 26,669(0.34%)#38 | 924,665(0.01%)#1,506 |
| 39. | Americus | 91 | 26,669(0.34%)#39 | 924,665(0.01%)#1,514 |
| 40. | Newnan | 87 | 26,669(0.33%)#40 | 924,665(0.01%)#1,566 |
| 41. | Stockbridge | 80 | 26,669(0.30%)#41 | 924,665(0.01%)#1,698 |
| 42. | Powder Springs | 80 | 26,669(0.30%)#42 | 924,665(0.01%)#1,702 |
| 43. | Mount Zion | 80 | 26,669(0.30%)#43 | 924,665(0.01%)#1,708 |
| 44. | Berkeley Lake | 79 | 26,669(0.30%)#44 | 924,665(0.01%)#1,733 |
| 45. | Warner Robins | 77 | 26,669(0.29%)#45 | 924,665(0.01%)#1,755 |
| 46. | Douglas | 72 | 26,669(0.27%)#46 | 924,665(0.01%)#1,860 |
| 47. | St Simons | 71 | 26,669(0.27%)#47 | 924,665(0.01%)#1,879 |
| 48. | Druid Hills | 71 | 26,669(0.27%)#48 | 924,665(0.01%)#1,888 |
| 49. | South Fulton | 69 | 26,669(0.26%)#49 | 924,665(0.01%)#1,917 |
| 50. | Acworth | 63 | 26,669(0.24%)#50 | 924,665(0.01%)#2,070 |
| 51. | Mableton | 61 | 26,669(0.23%)#51 | 924,665(0.01%)#2,140 |
| 52. | Woodstock | 61 | 26,669(0.23%)#52 | 924,665(0.01%)#2,141 |
| 53. | Cusseta Chattahoochee County Unified Government | 57 | 26,669(0.21%)#53 | 924,665(0.01%)#2,268 |
| 54. | Perry | 51 | 26,669(0.19%)#54 | 924,665(0.01%)#2,476 |
| 55. | Whitemarsh Island | 51 | 26,669(0.19%)#55 | 924,665(0.01%)#2,489 |
| 56. | Baxley | 50 | 26,669(0.19%)#56 | 924,665(0.01%)#2,523 |
| 57. | Griffin | 49 | 26,669(0.18%)#57 | 924,665(0.01%)#2,542 |
| 58. | Valdosta | 47 | 26,669(0.18%)#58 | 924,665(0.01%)#2,597 |
| 59. | North Druid Hills | 46 | 26,669(0.17%)#59 | 924,665(0.00%)#2,651 |
| 60. | Lovejoy | 46 | 26,669(0.17%)#60 | 924,665(0.00%)#2,666 |
| 61. | East Point | 45 | 26,669(0.17%)#61 | 924,665(0.00%)#2,689 |
| 62. | Milledgeville | 45 | 26,669(0.17%)#62 | 924,665(0.00%)#2,698 |
| 63. | Lithia Springs | 45 | 26,669(0.17%)#63 | 924,665(0.00%)#2,700 |
| 64. | Snellville | 44 | 26,669(0.16%)#64 | 924,665(0.00%)#2,746 |
| 65. | Port Wentworth | 44 | 26,669(0.16%)#65 | 924,665(0.00%)#2,757 |
| 66. | Fort Stewart | 42 | 26,669(0.16%)#66 | 924,665(0.00%)#2,852 |
| 67. | Allenhurst | 42 | 26,669(0.16%)#67 | 924,665(0.00%)#2,872 |
| 68. | Fayetteville | 41 | 26,669(0.15%)#68 | 924,665(0.00%)#2,885 |
| 69. | Albany | 40 | 26,669(0.15%)#69 | 924,665(0.00%)#2,921 |
| 70. | Sugar Hill | 39 | 26,669(0.15%)#70 | 924,665(0.00%)#2,979 |
| 71. | Suwanee | 37 | 26,669(0.14%)#71 | 924,665(0.00%)#3,100 |
| 72. | Dalton | 36 | 26,669(0.13%)#72 | 924,665(0.00%)#3,157 |
| 73. | Vinings | 36 | 26,669(0.13%)#73 | 924,665(0.00%)#3,178 |
| 74. | Holly Springs | 35 | 26,669(0.13%)#74 | 924,665(0.00%)#3,230 |
| 75. | Centerville | 32 | 26,669(0.12%)#75 | 924,665(0.00%)#3,418 |
| 76. | Hahira | 31 | 26,669(0.12%)#76 | 924,665(0.00%)#3,514 |
| 77. | Austell | 30 | 26,669(0.11%)#77 | 924,665(0.00%)#3,576 |
| 78. | Antioch | 30 | 26,669(0.11%)#78 | 924,665(0.00%)#3,607 |
| 79. | Lawrenceville | 29 | 26,669(0.11%)#79 | 924,665(0.00%)#3,613 |
| 80. | Dock Junction | 29 | 26,669(0.11%)#80 | 924,665(0.00%)#3,650 |
| 81. | Glennville | 29 | 26,669(0.11%)#81 | 924,665(0.00%)#3,665 |
| 82. | Ocilla | 29 | 26,669(0.11%)#82 | 924,665(0.00%)#3,674 |
| 83. | Calhoun | 28 | 26,669(0.10%)#83 | 924,665(0.00%)#3,706 |
| 84. | Mountain Park | 28 | 26,669(0.10%)#84 | 924,665(0.00%)#3,713 |
| 85. | Tybee Island | 28 | 26,669(0.10%)#85 | 924,665(0.00%)#3,753 |
| 86. | Brunswick | 26 | 26,669(0.10%)#86 | 924,665(0.00%)#3,866 |
| 87. | Hephzibah | 25 | 26,669(0.09%)#87 | 924,665(0.00%)#3,979 |
| 88. | St Marys | 24 | 26,669(0.09%)#88 | 924,665(0.00%)#4,026 |
| 89. | Villa Rica | 24 | 26,669(0.09%)#89 | 924,665(0.00%)#4,030 |
| 90. | Country Club Estates | 24 | 26,669(0.09%)#90 | 924,665(0.00%)#4,047 |
| 91. | Auburn | 24 | 26,669(0.09%)#91 | 924,665(0.00%)#4,051 |
| 92. | Redan | 23 | 26,669(0.09%)#92 | 924,665(0.00%)#4,108 |
| 93. | Candler Mcafee | 23 | 26,669(0.09%)#93 | 924,665(0.00%)#4,118 |
| 94. | Thomasville | 23 | 26,669(0.09%)#94 | 924,665(0.00%)#4,120 |
| 95. | Isle Of Hope | 23 | 26,669(0.09%)#95 | 924,665(0.00%)#4,175 |
| 96. | Georgetown | 22 | 26,669(0.08%)#96 | 924,665(0.00%)#4,221 |
| 97. | Garden City | 22 | 26,669(0.08%)#97 | 924,665(0.00%)#4,230 |
| 98. | Avondale Estates | 22 | 26,669(0.08%)#98 | 924,665(0.00%)#4,269 |
| 99. | Rome | 20 | 26,669(0.07%)#99 | 924,665(0.00%)#4,425 |
| 100. | Kennesaw | 20 | 26,669(0.07%)#100 | 924,665(0.00%)#4,428 |
Common Questions
What are the Top 10 Cities with the Most Immigrants from Western Europe in Georgia?
Top 10 Cities with the Most Immigrants from Western Europe in Georgia are:
#1
2,518
#2
1,245
#3
729
#4
594
#5
366
#6
347
#7
346
#8
342
#9
339
#10
323
What city has the Most Immigrants from Western Europe in Georgia?
Atlanta has the Most Immigrants from Western Europe in Georgia with 2,518.
What is the Total Immigrants from Western Europe in the State of Georgia?
Total Immigrants from Western Europe in Georgia is 26,669.
What is the Total Immigrants from Western Europe in the United States?
Total Immigrants from Western Europe in the United States is 924,665.