Cities with the Most Immigrants from Western Europe in Ohio
RELATED REPORTS & OPTIONS
Western Europe
Ohio
Compare Cities
Map of Cities with the Most Immigrants from Western Europe in Ohio
0
2,000
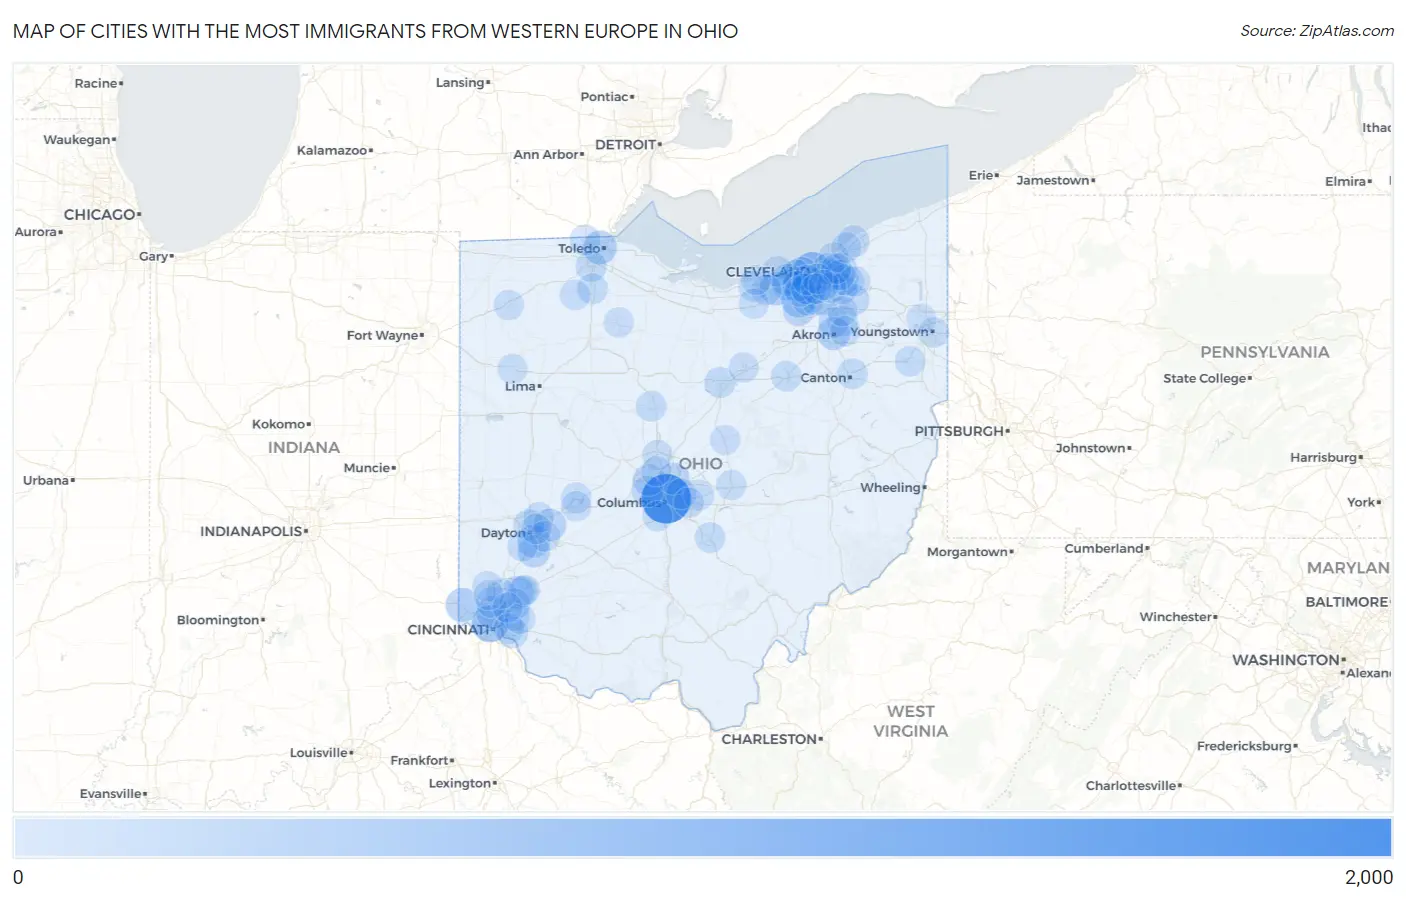
Cities with the Most Immigrants from Western Europe in Ohio
| City | Western Europe | vs State | vs National | |
| 1. | Columbus | 1,610 | 20,340(7.92%)#1 | 924,665(0.17%)#35 |
| 2. | Cleveland | 687 | 20,340(3.38%)#2 | 924,665(0.07%)#138 |
| 3. | Cincinnati | 555 | 20,340(2.73%)#3 | 924,665(0.06%)#179 |
| 4. | Strongsville | 384 | 20,340(1.89%)#4 | 924,665(0.04%)#278 |
| 5. | Parma | 364 | 20,340(1.79%)#5 | 924,665(0.04%)#299 |
| 6. | Harrison | 333 | 20,340(1.64%)#6 | 924,665(0.04%)#344 |
| 7. | Toledo | 312 | 20,340(1.53%)#7 | 924,665(0.03%)#386 |
| 8. | Lakewood | 291 | 20,340(1.43%)#8 | 924,665(0.03%)#420 |
| 9. | North Ridgeville | 286 | 20,340(1.41%)#9 | 924,665(0.03%)#426 |
| 10. | Kettering | 245 | 20,340(1.20%)#10 | 924,665(0.03%)#519 |
| 11. | Mason | 239 | 20,340(1.18%)#11 | 924,665(0.03%)#532 |
| 12. | Akron | 234 | 20,340(1.15%)#12 | 924,665(0.03%)#554 |
| 13. | Finneytown | 230 | 20,340(1.13%)#13 | 924,665(0.02%)#565 |
| 14. | Fairborn | 213 | 20,340(1.05%)#14 | 924,665(0.02%)#617 |
| 15. | Centerville | 206 | 20,340(1.01%)#15 | 924,665(0.02%)#639 |
| 16. | Westlake | 186 | 20,340(0.91%)#16 | 924,665(0.02%)#727 |
| 17. | Dublin | 174 | 20,340(0.86%)#17 | 924,665(0.02%)#775 |
| 18. | Westerville | 172 | 20,340(0.85%)#18 | 924,665(0.02%)#784 |
| 19. | Shaker Heights | 165 | 20,340(0.81%)#19 | 924,665(0.02%)#826 |
| 20. | Brunswick | 148 | 20,340(0.73%)#20 | 924,665(0.02%)#928 |
| 21. | Mayfield Heights | 145 | 20,340(0.71%)#21 | 924,665(0.02%)#955 |
| 22. | Beachwood | 144 | 20,340(0.71%)#22 | 924,665(0.02%)#960 |
| 23. | Cleveland Heights | 141 | 20,340(0.69%)#23 | 924,665(0.02%)#981 |
| 24. | North Olmsted | 137 | 20,340(0.67%)#24 | 924,665(0.01%)#1,012 |
| 25. | Mentor | 133 | 20,340(0.65%)#25 | 924,665(0.01%)#1,039 |
| 26. | Hilliard | 128 | 20,340(0.63%)#26 | 924,665(0.01%)#1,081 |
| 27. | Aurora | 128 | 20,340(0.63%)#27 | 924,665(0.01%)#1,084 |
| 28. | The Village Of Indian Hill | 120 | 20,340(0.59%)#28 | 924,665(0.01%)#1,159 |
| 29. | North Royalton | 119 | 20,340(0.59%)#29 | 924,665(0.01%)#1,164 |
| 30. | Forestville | 119 | 20,340(0.59%)#30 | 924,665(0.01%)#1,172 |
| 31. | Mansfield | 113 | 20,340(0.56%)#31 | 924,665(0.01%)#1,236 |
| 32. | Perrysburg | 112 | 20,340(0.55%)#32 | 924,665(0.01%)#1,248 |
| 33. | Dayton | 102 | 20,340(0.50%)#33 | 924,665(0.01%)#1,365 |
| 34. | Brecksville | 100 | 20,340(0.49%)#34 | 924,665(0.01%)#1,407 |
| 35. | Kings Mills | 93 | 20,340(0.46%)#35 | 924,665(0.01%)#1,488 |
| 36. | Rocky River | 90 | 20,340(0.44%)#36 | 924,665(0.01%)#1,526 |
| 37. | Broadview Heights | 88 | 20,340(0.43%)#37 | 924,665(0.01%)#1,551 |
| 38. | Bowling Green | 86 | 20,340(0.42%)#38 | 924,665(0.01%)#1,584 |
| 39. | Pataskala | 85 | 20,340(0.42%)#39 | 924,665(0.01%)#1,608 |
| 40. | Sylvania | 84 | 20,340(0.41%)#40 | 924,665(0.01%)#1,628 |
| 41. | Stow | 82 | 20,340(0.40%)#41 | 924,665(0.01%)#1,654 |
| 42. | Brook Park | 79 | 20,340(0.39%)#42 | 924,665(0.01%)#1,720 |
| 43. | Amherst | 79 | 20,340(0.39%)#43 | 924,665(0.01%)#1,724 |
| 44. | Marion | 78 | 20,340(0.38%)#44 | 924,665(0.01%)#1,737 |
| 45. | Gahanna | 78 | 20,340(0.38%)#45 | 924,665(0.01%)#1,738 |
| 46. | Chagrin Falls | 75 | 20,340(0.37%)#46 | 924,665(0.01%)#1,799 |
| 47. | Cuyahoga Falls | 74 | 20,340(0.36%)#47 | 924,665(0.01%)#1,802 |
| 48. | Sixteen Mile Stand | 74 | 20,340(0.36%)#48 | 924,665(0.01%)#1,818 |
| 49. | Avon Lake | 73 | 20,340(0.36%)#49 | 924,665(0.01%)#1,829 |
| 50. | Canton | 72 | 20,340(0.35%)#50 | 924,665(0.01%)#1,847 |
| 51. | Lancaster | 71 | 20,340(0.35%)#51 | 924,665(0.01%)#1,872 |
| 52. | Middleburg Heights | 70 | 20,340(0.34%)#52 | 924,665(0.01%)#1,903 |
| 53. | Moreland Hills | 70 | 20,340(0.34%)#53 | 924,665(0.01%)#1,914 |
| 54. | Huber Heights | 69 | 20,340(0.34%)#54 | 924,665(0.01%)#1,922 |
| 55. | Wooster | 69 | 20,340(0.34%)#55 | 924,665(0.01%)#1,925 |
| 56. | Salem | 69 | 20,340(0.34%)#56 | 924,665(0.01%)#1,938 |
| 57. | Parma Heights | 68 | 20,340(0.33%)#57 | 924,665(0.01%)#1,954 |
| 58. | Beavercreek | 66 | 20,340(0.32%)#58 | 924,665(0.01%)#1,990 |
| 59. | Forest Park | 66 | 20,340(0.32%)#59 | 924,665(0.01%)#1,996 |
| 60. | Elyria | 65 | 20,340(0.32%)#60 | 924,665(0.01%)#2,014 |
| 61. | Weston | 65 | 20,340(0.32%)#61 | 924,665(0.01%)#2,035 |
| 62. | Euclid | 64 | 20,340(0.31%)#62 | 924,665(0.01%)#2,037 |
| 63. | Solon | 63 | 20,340(0.31%)#63 | 924,665(0.01%)#2,069 |
| 64. | Riverside | 59 | 20,340(0.29%)#64 | 924,665(0.01%)#2,200 |
| 65. | Tallmadge | 59 | 20,340(0.29%)#65 | 924,665(0.01%)#2,203 |
| 66. | Turpin Hills | 59 | 20,340(0.29%)#66 | 924,665(0.01%)#2,215 |
| 67. | Youngstown | 58 | 20,340(0.29%)#67 | 924,665(0.01%)#2,224 |
| 68. | Beckett Ridge | 58 | 20,340(0.29%)#68 | 924,665(0.01%)#2,241 |
| 69. | South Russell | 57 | 20,340(0.28%)#69 | 924,665(0.01%)#2,275 |
| 70. | Brooklyn | 56 | 20,340(0.28%)#70 | 924,665(0.01%)#2,300 |
| 71. | Northridge | 56 | 20,340(0.28%)#71 | 924,665(0.01%)#2,310 |
| 72. | Hamilton | 55 | 20,340(0.27%)#72 | 924,665(0.01%)#2,323 |
| 73. | Pepper Pike | 55 | 20,340(0.27%)#73 | 924,665(0.01%)#2,342 |
| 74. | Bedford | 54 | 20,340(0.27%)#74 | 924,665(0.01%)#2,371 |
| 75. | Newark | 52 | 20,340(0.26%)#75 | 924,665(0.01%)#2,424 |
| 76. | Bass Lake | 52 | 20,340(0.26%)#76 | 924,665(0.01%)#2,464 |
| 77. | Lyndhurst | 51 | 20,340(0.25%)#77 | 924,665(0.01%)#2,480 |
| 78. | Milford | 51 | 20,340(0.25%)#78 | 924,665(0.01%)#2,490 |
| 79. | Newburgh Heights | 49 | 20,340(0.24%)#79 | 924,665(0.01%)#2,562 |
| 80. | Delaware | 48 | 20,340(0.24%)#80 | 924,665(0.01%)#2,564 |
| 81. | Grove City | 48 | 20,340(0.24%)#81 | 924,665(0.01%)#2,565 |
| 82. | Defiance | 47 | 20,340(0.23%)#82 | 924,665(0.01%)#2,611 |
| 83. | Oberlin | 47 | 20,340(0.23%)#83 | 924,665(0.01%)#2,625 |
| 84. | Springfield | 46 | 20,340(0.23%)#84 | 924,665(0.00%)#2,642 |
| 85. | Seven Hills | 46 | 20,340(0.23%)#85 | 924,665(0.00%)#2,664 |
| 86. | Willoughby | 45 | 20,340(0.22%)#86 | 924,665(0.00%)#2,695 |
| 87. | Ashland | 45 | 20,340(0.22%)#87 | 924,665(0.00%)#2,697 |
| 88. | Reynoldsburg | 44 | 20,340(0.22%)#88 | 924,665(0.00%)#2,732 |
| 89. | West Carrollton | 44 | 20,340(0.22%)#89 | 924,665(0.00%)#2,752 |
| 90. | South Lebanon | 41 | 20,340(0.20%)#90 | 924,665(0.00%)#2,907 |
| 91. | Lorain | 40 | 20,340(0.20%)#91 | 924,665(0.00%)#2,922 |
| 92. | Fairfield | 40 | 20,340(0.20%)#92 | 924,665(0.00%)#2,925 |
| 93. | Delphos | 40 | 20,340(0.20%)#93 | 924,665(0.00%)#2,960 |
| 94. | Hudson | 39 | 20,340(0.19%)#94 | 924,665(0.00%)#2,981 |
| 95. | Mount Vernon | 39 | 20,340(0.19%)#95 | 924,665(0.00%)#2,987 |
| 96. | Powell | 39 | 20,340(0.19%)#96 | 924,665(0.00%)#2,994 |
| 97. | Fostoria | 39 | 20,340(0.19%)#97 | 924,665(0.00%)#2,996 |
| 98. | Blue Ash | 38 | 20,340(0.19%)#98 | 924,665(0.00%)#3,047 |
| 99. | Garfield Heights | 36 | 20,340(0.18%)#99 | 924,665(0.00%)#3,159 |
| 100. | Niles | 36 | 20,340(0.18%)#100 | 924,665(0.00%)#3,169 |
Common Questions
What are the Top 10 Cities with the Most Immigrants from Western Europe in Ohio?
Top 10 Cities with the Most Immigrants from Western Europe in Ohio are:
#1
1,610
#2
687
#3
555
#4
384
#5
364
#6
333
#7
312
#8
291
#9
286
#10
245
What city has the Most Immigrants from Western Europe in Ohio?
Columbus has the Most Immigrants from Western Europe in Ohio with 1,610.
What is the Total Immigrants from Western Europe in the State of Ohio?
Total Immigrants from Western Europe in Ohio is 20,340.
What is the Total Immigrants from Western Europe in the United States?
Total Immigrants from Western Europe in the United States is 924,665.