Cities with the Most Immigrants from Vietnam in Ohio
RELATED REPORTS & OPTIONS
Vietnam
Ohio
Compare Cities
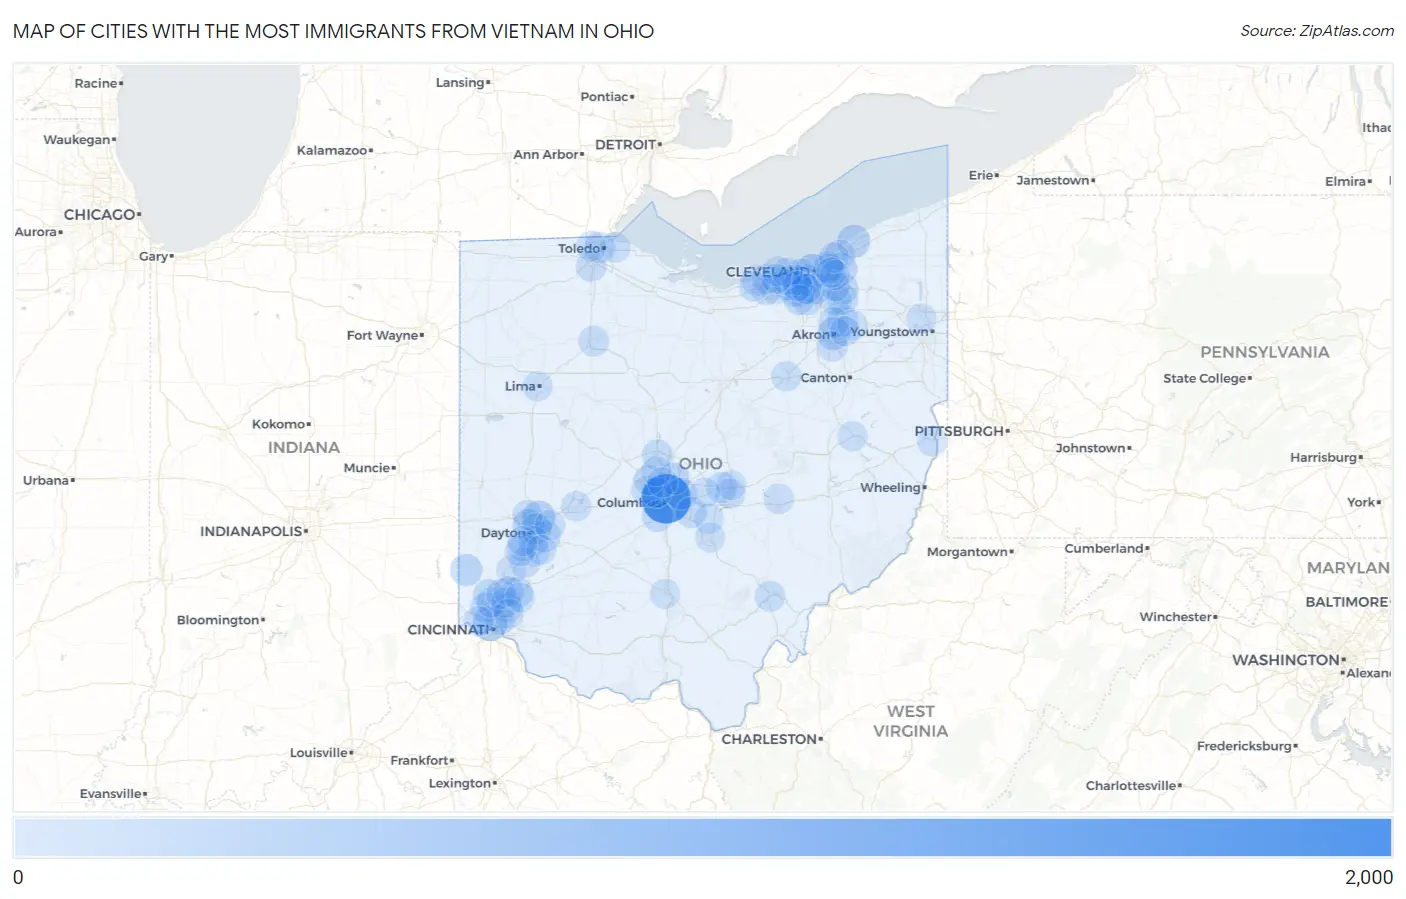
Map of Cities with the Most Immigrants from Vietnam in Ohio
0
2,000
Cities with the Most Immigrants from Vietnam in Ohio
| City | Vietnam | vs State | vs National | |
| 1. | Columbus | 1,706 | 10,960(15.57%)#1 | 1,349,684(0.13%)#100 |
| 2. | Cleveland | 393 | 10,960(3.59%)#2 | 1,349,684(0.03%)#445 |
| 3. | Cincinnati | 390 | 10,960(3.56%)#3 | 1,349,684(0.03%)#446 |
| 4. | Huber Heights | 288 | 10,960(2.63%)#4 | 1,349,684(0.02%)#593 |
| 5. | Mentor | 266 | 10,960(2.43%)#5 | 1,349,684(0.02%)#636 |
| 6. | Akron | 215 | 10,960(1.96%)#6 | 1,349,684(0.02%)#745 |
| 7. | Parma | 204 | 10,960(1.86%)#7 | 1,349,684(0.02%)#776 |
| 8. | Dayton | 197 | 10,960(1.80%)#8 | 1,349,684(0.01%)#796 |
| 9. | Oxford | 184 | 10,960(1.68%)#9 | 1,349,684(0.01%)#845 |
| 10. | Westerville | 182 | 10,960(1.66%)#10 | 1,349,684(0.01%)#852 |
| 11. | Mayfield Heights | 171 | 10,960(1.56%)#11 | 1,349,684(0.01%)#893 |
| 12. | Solon | 153 | 10,960(1.40%)#12 | 1,349,684(0.01%)#960 |
| 13. | Gahanna | 152 | 10,960(1.39%)#13 | 1,349,684(0.01%)#968 |
| 14. | Brooklyn | 141 | 10,960(1.29%)#14 | 1,349,684(0.01%)#1,032 |
| 15. | Fairfield | 134 | 10,960(1.22%)#15 | 1,349,684(0.01%)#1,067 |
| 16. | Beavercreek | 123 | 10,960(1.12%)#16 | 1,349,684(0.01%)#1,136 |
| 17. | Hilliard | 109 | 10,960(0.99%)#17 | 1,349,684(0.01%)#1,249 |
| 18. | Stow | 106 | 10,960(0.97%)#18 | 1,349,684(0.01%)#1,275 |
| 19. | Grove City | 101 | 10,960(0.92%)#19 | 1,349,684(0.01%)#1,314 |
| 20. | Twinsburg | 98 | 10,960(0.89%)#20 | 1,349,684(0.01%)#1,341 |
| 21. | Macedonia | 97 | 10,960(0.89%)#21 | 1,349,684(0.01%)#1,352 |
| 22. | Granville | 96 | 10,960(0.88%)#22 | 1,349,684(0.01%)#1,364 |
| 23. | Pickerington | 94 | 10,960(0.86%)#23 | 1,349,684(0.01%)#1,372 |
| 24. | Seven Hills | 91 | 10,960(0.83%)#24 | 1,349,684(0.01%)#1,398 |
| 25. | Middleburg Heights | 87 | 10,960(0.79%)#25 | 1,349,684(0.01%)#1,431 |
| 26. | Delaware | 84 | 10,960(0.77%)#26 | 1,349,684(0.01%)#1,465 |
| 27. | Riverside | 84 | 10,960(0.77%)#27 | 1,349,684(0.01%)#1,469 |
| 28. | Mason | 81 | 10,960(0.74%)#28 | 1,349,684(0.01%)#1,503 |
| 29. | North Royalton | 72 | 10,960(0.66%)#29 | 1,349,684(0.01%)#1,597 |
| 30. | Findlay | 71 | 10,960(0.65%)#30 | 1,349,684(0.01%)#1,612 |
| 31. | Lorain | 67 | 10,960(0.61%)#31 | 1,349,684(0.00%)#1,668 |
| 32. | Centerville | 66 | 10,960(0.60%)#32 | 1,349,684(0.00%)#1,686 |
| 33. | Toledo | 64 | 10,960(0.58%)#33 | 1,349,684(0.00%)#1,710 |
| 34. | Athens | 63 | 10,960(0.57%)#34 | 1,349,684(0.00%)#1,729 |
| 35. | North Ridgeville | 62 | 10,960(0.57%)#35 | 1,349,684(0.00%)#1,739 |
| 36. | Perrysburg | 58 | 10,960(0.53%)#36 | 1,349,684(0.00%)#1,804 |
| 37. | Berea | 52 | 10,960(0.47%)#37 | 1,349,684(0.00%)#1,900 |
| 38. | Cuyahoga Falls | 50 | 10,960(0.46%)#38 | 1,349,684(0.00%)#1,929 |
| 39. | Upper Arlington | 47 | 10,960(0.43%)#39 | 1,349,684(0.00%)#1,989 |
| 40. | Portage Lakes | 46 | 10,960(0.42%)#40 | 1,349,684(0.00%)#2,021 |
| 41. | Dublin | 45 | 10,960(0.41%)#41 | 1,349,684(0.00%)#2,030 |
| 42. | Wickliffe | 45 | 10,960(0.41%)#42 | 1,349,684(0.00%)#2,051 |
| 43. | East Cleveland | 42 | 10,960(0.38%)#43 | 1,349,684(0.00%)#2,117 |
| 44. | Steubenville | 41 | 10,960(0.37%)#44 | 1,349,684(0.00%)#2,136 |
| 45. | Sheffield | 38 | 10,960(0.35%)#45 | 1,349,684(0.00%)#2,224 |
| 46. | Niles | 37 | 10,960(0.34%)#46 | 1,349,684(0.00%)#2,240 |
| 47. | North Zanesville | 37 | 10,960(0.34%)#47 | 1,349,684(0.00%)#2,261 |
| 48. | North Olmsted | 34 | 10,960(0.31%)#48 | 1,349,684(0.00%)#2,330 |
| 49. | Sharon Center | 33 | 10,960(0.30%)#49 | 1,349,684(0.00%)#2,388 |
| 50. | Lakewood | 32 | 10,960(0.29%)#50 | 1,349,684(0.00%)#2,395 |
| 51. | Blue Ash | 32 | 10,960(0.29%)#51 | 1,349,684(0.00%)#2,408 |
| 52. | Westlake | 31 | 10,960(0.28%)#52 | 1,349,684(0.00%)#2,436 |
| 53. | Springfield | 30 | 10,960(0.27%)#53 | 1,349,684(0.00%)#2,462 |
| 54. | Oregon | 30 | 10,960(0.27%)#54 | 1,349,684(0.00%)#2,472 |
| 55. | Fairview Park | 30 | 10,960(0.27%)#55 | 1,349,684(0.00%)#2,475 |
| 56. | Northbrook | 29 | 10,960(0.26%)#56 | 1,349,684(0.00%)#2,509 |
| 57. | Sharonville | 28 | 10,960(0.26%)#57 | 1,349,684(0.00%)#2,540 |
| 58. | Kettering | 27 | 10,960(0.25%)#58 | 1,349,684(0.00%)#2,562 |
| 59. | Lima | 27 | 10,960(0.25%)#59 | 1,349,684(0.00%)#2,568 |
| 60. | Norwood | 26 | 10,960(0.24%)#60 | 1,349,684(0.00%)#2,610 |
| 61. | Vandalia | 26 | 10,960(0.24%)#61 | 1,349,684(0.00%)#2,616 |
| 62. | Heath | 26 | 10,960(0.24%)#62 | 1,349,684(0.00%)#2,623 |
| 63. | Baltimore | 26 | 10,960(0.24%)#63 | 1,349,684(0.00%)#2,638 |
| 64. | Springboro | 25 | 10,960(0.23%)#64 | 1,349,684(0.00%)#2,657 |
| 65. | Elyria | 24 | 10,960(0.22%)#65 | 1,349,684(0.00%)#2,691 |
| 66. | Strongsville | 23 | 10,960(0.21%)#66 | 1,349,684(0.00%)#2,730 |
| 67. | Forest Park | 23 | 10,960(0.21%)#67 | 1,349,684(0.00%)#2,738 |
| 68. | Bedford Heights | 23 | 10,960(0.21%)#68 | 1,349,684(0.00%)#2,744 |
| 69. | Middletown | 21 | 10,960(0.19%)#69 | 1,349,684(0.00%)#2,818 |
| 70. | Wooster | 21 | 10,960(0.19%)#70 | 1,349,684(0.00%)#2,826 |
| 71. | Bridgetown | 21 | 10,960(0.19%)#71 | 1,349,684(0.00%)#2,841 |
| 72. | Amherst | 21 | 10,960(0.19%)#72 | 1,349,684(0.00%)#2,842 |
| 73. | Beckett Ridge | 21 | 10,960(0.19%)#73 | 1,349,684(0.00%)#2,845 |
| 74. | Uhrichsville | 20 | 10,960(0.18%)#74 | 1,349,684(0.00%)#2,911 |
| 75. | Ottawa Hills | 20 | 10,960(0.18%)#75 | 1,349,684(0.00%)#2,915 |
| 76. | Wetherington | 19 | 10,960(0.17%)#76 | 1,349,684(0.00%)#2,969 |
| 77. | Cleveland Heights | 18 | 10,960(0.16%)#77 | 1,349,684(0.00%)#2,976 |
| 78. | West Carrollton | 18 | 10,960(0.16%)#78 | 1,349,684(0.00%)#2,996 |
| 79. | Euclid | 17 | 10,960(0.16%)#79 | 1,349,684(0.00%)#3,036 |
| 80. | Fairborn | 17 | 10,960(0.16%)#80 | 1,349,684(0.00%)#3,038 |
| 81. | Avon Lake | 16 | 10,960(0.15%)#81 | 1,349,684(0.00%)#3,100 |
| 82. | Newark | 15 | 10,960(0.14%)#82 | 1,349,684(0.00%)#3,163 |
| 83. | Miamisburg | 15 | 10,960(0.14%)#83 | 1,349,684(0.00%)#3,173 |
| 84. | Beachwood | 15 | 10,960(0.14%)#84 | 1,349,684(0.00%)#3,177 |
| 85. | Parma Heights | 14 | 10,960(0.13%)#85 | 1,349,684(0.00%)#3,240 |
| 86. | Bay Village | 14 | 10,960(0.13%)#86 | 1,349,684(0.00%)#3,247 |
| 87. | Powell | 14 | 10,960(0.13%)#87 | 1,349,684(0.00%)#3,255 |
| 88. | Moraine | 14 | 10,960(0.13%)#88 | 1,349,684(0.00%)#3,270 |
| 89. | Kenwood | 13 | 10,960(0.12%)#89 | 1,349,684(0.00%)#3,325 |
| 90. | Landen | 12 | 10,960(0.11%)#90 | 1,349,684(0.00%)#3,395 |
| 91. | Kent | 11 | 10,960(0.10%)#91 | 1,349,684(0.00%)#3,433 |
| 92. | Brook Park | 11 | 10,960(0.10%)#92 | 1,349,684(0.00%)#3,439 |
| 93. | Beechwood Trails | 11 | 10,960(0.10%)#93 | 1,349,684(0.00%)#3,492 |
| 94. | Worthington | 10 | 10,960(0.09%)#94 | 1,349,684(0.00%)#3,542 |
| 95. | Avon | 9 | 10,960(0.08%)#95 | 1,349,684(0.00%)#3,623 |
| 96. | Chillicothe | 9 | 10,960(0.08%)#96 | 1,349,684(0.00%)#3,626 |
| 97. | Lancaster | 8 | 10,960(0.07%)#97 | 1,349,684(0.00%)#3,713 |
| 98. | Tallmadge | 8 | 10,960(0.07%)#98 | 1,349,684(0.00%)#3,725 |
| 99. | University Heights | 8 | 10,960(0.07%)#99 | 1,349,684(0.00%)#3,732 |
| 100. | Bellbrook | 8 | 10,960(0.07%)#100 | 1,349,684(0.00%)#3,756 |
Common Questions
What are the Top 10 Cities with the Most Immigrants from Vietnam in Ohio?
Top 10 Cities with the Most Immigrants from Vietnam in Ohio are:
#1
1,706
#2
393
#3
390
#4
288
#5
266
#6
215
#7
204
#8
197
#9
184
#10
182
What city has the Most Immigrants from Vietnam in Ohio?
Columbus has the Most Immigrants from Vietnam in Ohio with 1,706.
What is the Total Immigrants from Vietnam in the State of Ohio?
Total Immigrants from Vietnam in Ohio is 10,960.
What is the Total Immigrants from Vietnam in the United States?
Total Immigrants from Vietnam in the United States is 1,349,684.