Cities with the Most Immigrants from England in Tennessee
RELATED REPORTS & OPTIONS
England
Tennessee
Compare Cities
Map of Cities with the Most Immigrants from England in Tennessee
0
500
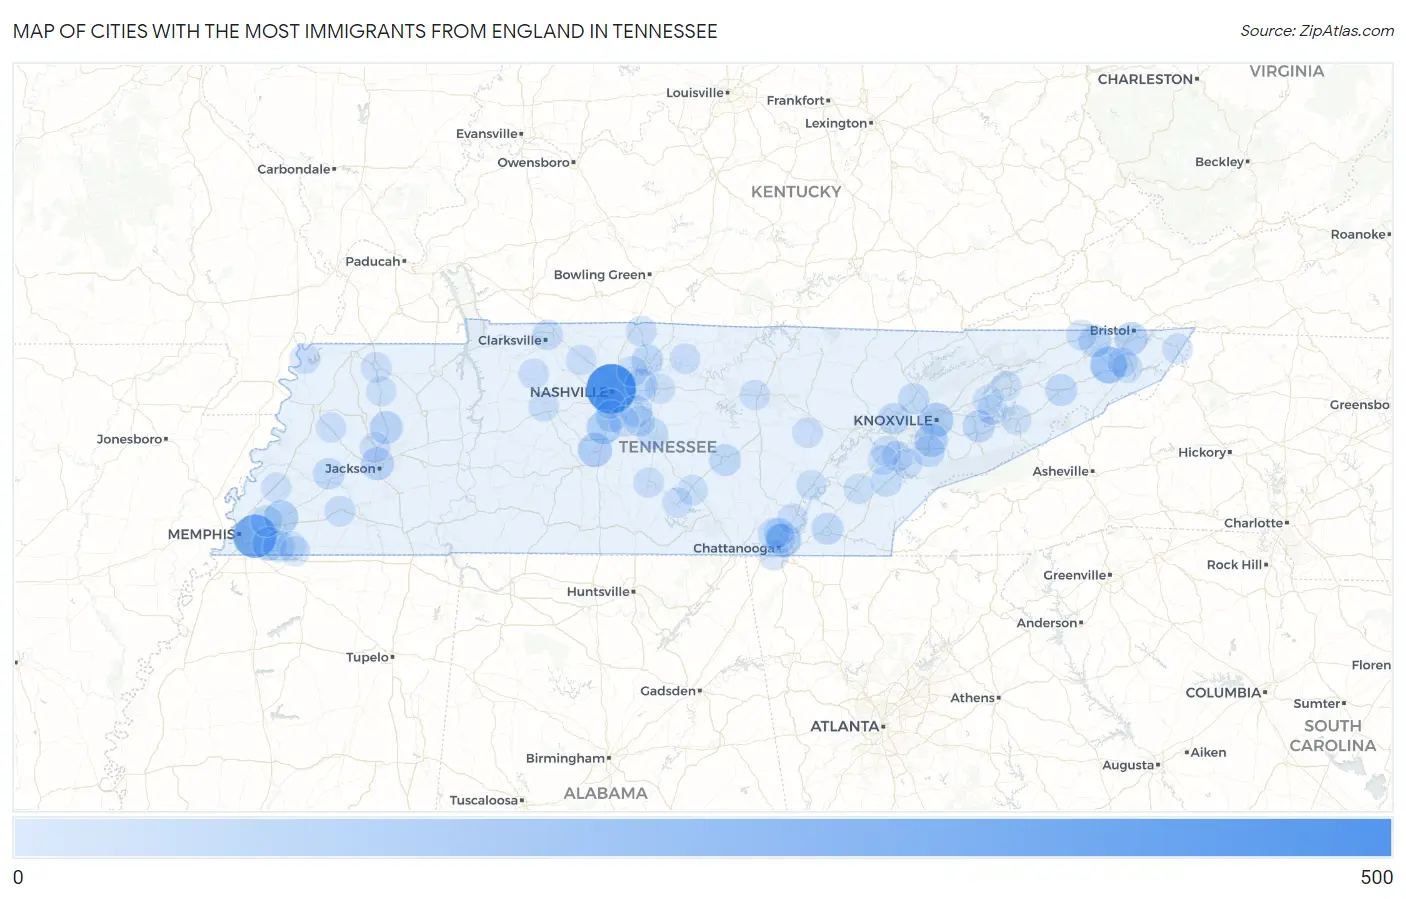
Cities with the Most Immigrants from England in Tennessee
| City | England | vs State | vs National | |
| 1. | Nashville | 470 | 4,587(10.25%)#1 | 318,896(0.15%)#52 |
| 2. | Memphis | 319 | 4,587(6.95%)#2 | 318,896(0.10%)#95 |
| 3. | Johnson City | 160 | 4,587(3.49%)#3 | 318,896(0.05%)#258 |
| 4. | Chattanooga | 100 | 4,587(2.18%)#4 | 318,896(0.03%)#501 |
| 5. | Knoxville | 99 | 4,587(2.16%)#5 | 318,896(0.03%)#510 |
| 6. | Spring Hill | 96 | 4,587(2.09%)#6 | 318,896(0.03%)#526 |
| 7. | Arlington | 92 | 4,587(2.01%)#7 | 318,896(0.03%)#545 |
| 8. | Franklin | 90 | 4,587(1.96%)#8 | 318,896(0.03%)#560 |
| 9. | Germantown | 85 | 4,587(1.85%)#9 | 318,896(0.03%)#600 |
| 10. | Alcoa | 81 | 4,587(1.77%)#10 | 318,896(0.03%)#636 |
| 11. | Bristol | 71 | 4,587(1.55%)#11 | 318,896(0.02%)#747 |
| 12. | Jackson | 66 | 4,587(1.44%)#12 | 318,896(0.02%)#792 |
| 13. | Milan | 66 | 4,587(1.44%)#13 | 318,896(0.02%)#800 |
| 14. | Mount Juliet | 58 | 4,587(1.26%)#14 | 318,896(0.02%)#912 |
| 15. | Kingsport | 53 | 4,587(1.16%)#15 | 318,896(0.02%)#1,000 |
| 16. | Sevierville | 48 | 4,587(1.05%)#16 | 318,896(0.02%)#1,125 |
| 17. | Collierville | 43 | 4,587(0.94%)#17 | 318,896(0.01%)#1,249 |
| 18. | Greeneville | 43 | 4,587(0.94%)#18 | 318,896(0.01%)#1,261 |
| 19. | Oak Ridge | 40 | 4,587(0.87%)#19 | 318,896(0.01%)#1,335 |
| 20. | Maryville | 39 | 4,587(0.85%)#20 | 318,896(0.01%)#1,355 |
| 21. | Mcminnville | 39 | 4,587(0.85%)#21 | 318,896(0.01%)#1,362 |
| 22. | Cleveland | 38 | 4,587(0.83%)#22 | 318,896(0.01%)#1,382 |
| 23. | Brentwood | 38 | 4,587(0.83%)#23 | 318,896(0.01%)#1,384 |
| 24. | La Vergne | 37 | 4,587(0.81%)#24 | 318,896(0.01%)#1,412 |
| 25. | Gallatin | 36 | 4,587(0.78%)#25 | 318,896(0.01%)#1,441 |
| 26. | Lynchburg | 36 | 4,587(0.78%)#26 | 318,896(0.01%)#1,457 |
| 27. | Bartlett | 32 | 4,587(0.70%)#27 | 318,896(0.01%)#1,589 |
| 28. | Signal Mountain | 31 | 4,587(0.68%)#28 | 318,896(0.01%)#1,656 |
| 29. | Brownsville | 30 | 4,587(0.65%)#29 | 318,896(0.01%)#1,695 |
| 30. | Clinton | 29 | 4,587(0.63%)#30 | 318,896(0.01%)#1,734 |
| 31. | Murfreesboro | 28 | 4,587(0.61%)#31 | 318,896(0.01%)#1,763 |
| 32. | Smyrna | 20 | 4,587(0.44%)#32 | 318,896(0.01%)#2,247 |
| 33. | Madisonville | 20 | 4,587(0.44%)#33 | 318,896(0.01%)#2,301 |
| 34. | Hendersonville | 19 | 4,587(0.41%)#34 | 318,896(0.01%)#2,317 |
| 35. | Tellico Village | 17 | 4,587(0.37%)#35 | 318,896(0.01%)#2,580 |
| 36. | Portland | 14 | 4,587(0.31%)#36 | 318,896(0.00%)#2,847 |
| 37. | Whiteville | 14 | 4,587(0.31%)#37 | 318,896(0.00%)#2,886 |
| 38. | Lookout Mountain | 14 | 4,587(0.31%)#38 | 318,896(0.00%)#2,909 |
| 39. | Clarksville | 13 | 4,587(0.28%)#39 | 318,896(0.00%)#2,927 |
| 40. | Walnut Grove Cdp Sumner County | 13 | 4,587(0.28%)#40 | 318,896(0.00%)#3,022 |
| 41. | Soddy Daisy | 11 | 4,587(0.24%)#41 | 318,896(0.00%)#3,216 |
| 42. | Manchester | 11 | 4,587(0.24%)#42 | 318,896(0.00%)#3,223 |
| 43. | Three Way | 11 | 4,587(0.24%)#43 | 318,896(0.00%)#3,316 |
| 44. | Shelbyville | 10 | 4,587(0.22%)#44 | 318,896(0.00%)#3,365 |
| 45. | Hartsville Trousdale County | 10 | 4,587(0.22%)#45 | 318,896(0.00%)#3,397 |
| 46. | Martin | 10 | 4,587(0.22%)#46 | 318,896(0.00%)#3,400 |
| 47. | Lake Tansi | 10 | 4,587(0.22%)#47 | 318,896(0.00%)#3,441 |
| 48. | Nolensville | 8 | 4,587(0.17%)#48 | 318,896(0.00%)#3,724 |
| 49. | Pleasant View | 8 | 4,587(0.17%)#49 | 318,896(0.00%)#3,767 |
| 50. | Mountain City | 8 | 4,587(0.17%)#50 | 318,896(0.00%)#3,804 |
| 51. | Red Bank | 7 | 4,587(0.15%)#51 | 318,896(0.00%)#3,885 |
| 52. | Loudon | 7 | 4,587(0.15%)#52 | 318,896(0.00%)#3,925 |
| 53. | Oak Hill | 7 | 4,587(0.15%)#53 | 318,896(0.00%)#3,935 |
| 54. | Dandridge | 7 | 4,587(0.15%)#54 | 318,896(0.00%)#3,950 |
| 55. | Slayden | 7 | 4,587(0.15%)#55 | 318,896(0.00%)#4,013 |
| 56. | Dickson | 6 | 4,587(0.13%)#56 | 318,896(0.00%)#4,052 |
| 57. | Elizabethton | 6 | 4,587(0.13%)#57 | 318,896(0.00%)#4,056 |
| 58. | Athens | 6 | 4,587(0.13%)#58 | 318,896(0.00%)#4,057 |
| 59. | Mount Carmel | 6 | 4,587(0.13%)#59 | 318,896(0.00%)#4,090 |
| 60. | Tiptonville | 5 | 4,587(0.11%)#60 | 318,896(0.00%)#4,252 |
| 61. | Greenfield | 5 | 4,587(0.11%)#61 | 318,896(0.00%)#4,287 |
| 62. | Walden | 5 | 4,587(0.11%)#62 | 318,896(0.00%)#4,301 |
| 63. | Cookeville | 4 | 4,587(0.09%)#63 | 318,896(0.00%)#4,365 |
| 64. | Tullahoma | 4 | 4,587(0.09%)#64 | 318,896(0.00%)#4,376 |
| 65. | Dayton | 4 | 4,587(0.09%)#65 | 318,896(0.00%)#4,393 |
| 66. | Rocky Top | 4 | 4,587(0.09%)#66 | 318,896(0.00%)#4,445 |
| 67. | Friendship | 4 | 4,587(0.09%)#67 | 318,896(0.00%)#4,497 |
| 68. | Jefferson City | 3 | 4,587(0.07%)#68 | 318,896(0.00%)#4,549 |
| 69. | Brighton | 3 | 4,587(0.07%)#69 | 318,896(0.00%)#4,571 |
| 70. | Greenback | 3 | 4,587(0.07%)#70 | 318,896(0.00%)#4,623 |
| 71. | Lebanon | 2 | 4,587(0.04%)#71 | 318,896(0.00%)#4,729 |
| 72. | Piperton | 2 | 4,587(0.04%)#72 | 318,896(0.00%)#4,766 |
| 73. | Rossville | 2 | 4,587(0.04%)#73 | 318,896(0.00%)#4,820 |
| 74. | Philadelphia | 2 | 4,587(0.04%)#74 | 318,896(0.00%)#4,844 |
| 75. | Watauga | 2 | 4,587(0.04%)#75 | 318,896(0.00%)#4,869 |
| 76. | Morristown | 1 | 4,587(0.02%)#76 | 318,896(0.00%)#4,967 |
| 77. | Newport | 1 | 4,587(0.02%)#77 | 318,896(0.00%)#4,982 |
Common Questions
What are the Top 10 Cities with the Most Immigrants from England in Tennessee?
Top 10 Cities with the Most Immigrants from England in Tennessee are:
#1
470
#2
319
#3
160
#4
100
#5
99
#6
96
#7
92
#8
90
#9
85
#10
81
What city has the Most Immigrants from England in Tennessee?
Nashville has the Most Immigrants from England in Tennessee with 470.
What is the Total Immigrants from England in the State of Tennessee?
Total Immigrants from England in Tennessee is 4,587.
What is the Total Immigrants from England in the United States?
Total Immigrants from England in the United States is 318,896.