Cities with the Most Immigrants from England in Pennsylvania
RELATED REPORTS & OPTIONS
England
Pennsylvania
Compare Cities
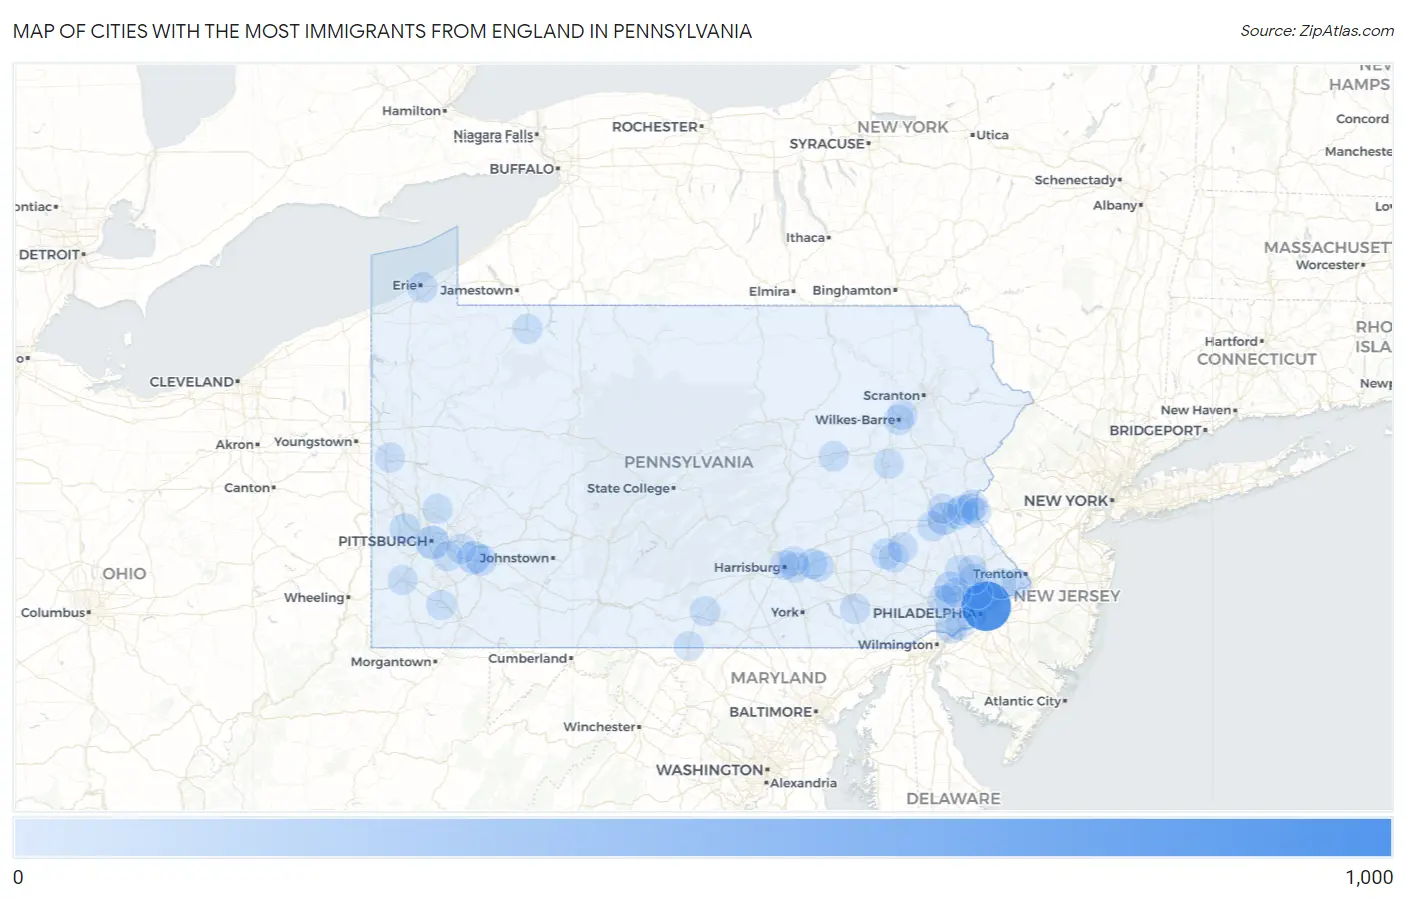
Map of Cities with the Most Immigrants from England in Pennsylvania
0
1,000
Cities with the Most Immigrants from England in Pennsylvania
| City | England | vs State | vs National | |
| 1. | Philadelphia | 835 | 9,205(9.07%)#1 | 318,896(0.26%)#15 |
| 2. | Economy Borough | 157 | 9,205(1.71%)#2 | 318,896(0.05%)#266 |
| 3. | Pittsburgh | 153 | 9,205(1.66%)#3 | 318,896(0.05%)#275 |
| 4. | Jeannette | 126 | 9,205(1.37%)#4 | 318,896(0.04%)#364 |
| 5. | Allentown | 106 | 9,205(1.15%)#5 | 318,896(0.03%)#462 |
| 6. | Tarentum Borough | 90 | 9,205(0.98%)#6 | 318,896(0.03%)#565 |
| 7. | Audubon | 87 | 9,205(0.95%)#7 | 318,896(0.03%)#584 |
| 8. | Village Green Green Ridge | 82 | 9,205(0.89%)#8 | 318,896(0.03%)#620 |
| 9. | Bethlehem | 61 | 9,205(0.66%)#9 | 318,896(0.02%)#862 |
| 10. | Rosemont | 59 | 9,205(0.64%)#10 | 318,896(0.02%)#905 |
| 11. | Greensburg | 58 | 9,205(0.63%)#11 | 318,896(0.02%)#916 |
| 12. | Lititz Borough | 58 | 9,205(0.63%)#12 | 318,896(0.02%)#917 |
| 13. | Lansdale Borough | 50 | 9,205(0.54%)#13 | 318,896(0.02%)#1,074 |
| 14. | Carnot Moon | 50 | 9,205(0.54%)#14 | 318,896(0.02%)#1,076 |
| 15. | State College Borough | 46 | 9,205(0.50%)#15 | 318,896(0.01%)#1,168 |
| 16. | Conshohocken Borough | 44 | 9,205(0.48%)#16 | 318,896(0.01%)#1,239 |
| 17. | Spring Ridge | 43 | 9,205(0.47%)#17 | 318,896(0.01%)#1,269 |
| 18. | Easton | 39 | 9,205(0.42%)#18 | 318,896(0.01%)#1,356 |
| 19. | Doylestown Borough | 37 | 9,205(0.40%)#19 | 318,896(0.01%)#1,423 |
| 20. | Campbelltown | 37 | 9,205(0.40%)#20 | 318,896(0.01%)#1,428 |
| 21. | Devon | 35 | 9,205(0.38%)#21 | 318,896(0.01%)#1,499 |
| 22. | Darby Borough | 34 | 9,205(0.37%)#22 | 318,896(0.01%)#1,533 |
| 23. | Middletown | 34 | 9,205(0.37%)#23 | 318,896(0.01%)#1,537 |
| 24. | Trevose | 33 | 9,205(0.36%)#24 | 318,896(0.01%)#1,578 |
| 25. | Erie | 32 | 9,205(0.35%)#25 | 318,896(0.01%)#1,584 |
| 26. | Old Orchard | 32 | 9,205(0.35%)#26 | 318,896(0.01%)#1,626 |
| 27. | Pottstown Borough | 31 | 9,205(0.34%)#27 | 318,896(0.01%)#1,640 |
| 28. | Churchill Borough | 30 | 9,205(0.33%)#28 | 318,896(0.01%)#1,705 |
| 29. | Lawnton | 29 | 9,205(0.32%)#29 | 318,896(0.01%)#1,747 |
| 30. | Denver Borough | 29 | 9,205(0.32%)#30 | 318,896(0.01%)#1,752 |
| 31. | Willow Street | 27 | 9,205(0.29%)#31 | 318,896(0.01%)#1,836 |
| 32. | Wyndmoor | 26 | 9,205(0.28%)#32 | 318,896(0.01%)#1,890 |
| 33. | Somerset Borough | 25 | 9,205(0.27%)#33 | 318,896(0.01%)#1,943 |
| 34. | Hershey | 24 | 9,205(0.26%)#34 | 318,896(0.01%)#1,989 |
| 35. | Gettysburg Borough | 24 | 9,205(0.26%)#35 | 318,896(0.01%)#1,999 |
| 36. | Ancient Oaks | 24 | 9,205(0.26%)#36 | 318,896(0.01%)#2,001 |
| 37. | Forest Hills Borough | 24 | 9,205(0.26%)#37 | 318,896(0.01%)#2,003 |
| 38. | Merion Station | 24 | 9,205(0.26%)#38 | 318,896(0.01%)#2,007 |
| 39. | Chalfont Borough | 24 | 9,205(0.26%)#39 | 318,896(0.01%)#2,010 |
| 40. | Mount Pocono Borough | 23 | 9,205(0.25%)#40 | 318,896(0.01%)#2,082 |
| 41. | New Hope Borough | 23 | 9,205(0.25%)#41 | 318,896(0.01%)#2,084 |
| 42. | West Mifflin Borough | 22 | 9,205(0.24%)#42 | 318,896(0.01%)#2,112 |
| 43. | Wayne | 22 | 9,205(0.24%)#43 | 318,896(0.01%)#2,138 |
| 44. | Manchester Borough | 22 | 9,205(0.24%)#44 | 318,896(0.01%)#2,157 |
| 45. | Wilkes Barre | 21 | 9,205(0.23%)#45 | 318,896(0.01%)#2,175 |
| 46. | Bloomsburg | 21 | 9,205(0.23%)#46 | 318,896(0.01%)#2,199 |
| 47. | Norwood Borough | 21 | 9,205(0.23%)#47 | 318,896(0.01%)#2,222 |
| 48. | Palmerton Borough | 21 | 9,205(0.23%)#48 | 318,896(0.01%)#2,224 |
| 49. | Eagleville Cdp Centre County | 21 | 9,205(0.23%)#49 | 318,896(0.01%)#2,239 |
| 50. | Woodlyn | 20 | 9,205(0.22%)#50 | 318,896(0.01%)#2,287 |
| 51. | Blakely Borough | 20 | 9,205(0.22%)#51 | 318,896(0.01%)#2,297 |
| 52. | Scotland | 20 | 9,205(0.22%)#52 | 318,896(0.01%)#2,313 |
| 53. | Lansdowne Borough | 19 | 9,205(0.21%)#53 | 318,896(0.01%)#2,368 |
| 54. | Ridley Park Borough | 19 | 9,205(0.21%)#54 | 318,896(0.01%)#2,381 |
| 55. | Swarthmore Borough | 19 | 9,205(0.21%)#55 | 318,896(0.01%)#2,384 |
| 56. | Brookhaven Borough | 18 | 9,205(0.20%)#56 | 318,896(0.01%)#2,473 |
| 57. | New Cumberland Borough | 18 | 9,205(0.20%)#57 | 318,896(0.01%)#2,476 |
| 58. | Stroudsburg Borough | 18 | 9,205(0.20%)#58 | 318,896(0.01%)#2,483 |
| 59. | New Freedom Borough | 18 | 9,205(0.20%)#59 | 318,896(0.01%)#2,488 |
| 60. | Harveys Lake Borough | 18 | 9,205(0.20%)#60 | 318,896(0.01%)#2,504 |
| 61. | Georgetown Cdp Luzerne County | 18 | 9,205(0.20%)#61 | 318,896(0.01%)#2,509 |
| 62. | Eagle | 18 | 9,205(0.20%)#62 | 318,896(0.01%)#2,518 |
| 63. | Reading | 17 | 9,205(0.18%)#63 | 318,896(0.01%)#2,523 |
| 64. | Mckeesport | 17 | 9,205(0.18%)#64 | 318,896(0.01%)#2,547 |
| 65. | Canonsburg Borough | 17 | 9,205(0.18%)#65 | 318,896(0.01%)#2,566 |
| 66. | Chestnut Hill | 17 | 9,205(0.18%)#66 | 318,896(0.01%)#2,579 |
| 67. | Swoyersville Borough | 17 | 9,205(0.18%)#67 | 318,896(0.01%)#2,584 |
| 68. | Hazleton | 16 | 9,205(0.17%)#68 | 318,896(0.01%)#2,619 |
| 69. | Pleasant Hills Borough | 16 | 9,205(0.17%)#69 | 318,896(0.01%)#2,647 |
| 70. | Paoli | 16 | 9,205(0.17%)#70 | 318,896(0.01%)#2,657 |
| 71. | Colonial Park | 15 | 9,205(0.16%)#71 | 318,896(0.00%)#2,737 |
| 72. | Alsace Manor | 15 | 9,205(0.16%)#72 | 318,896(0.00%)#2,805 |
| 73. | Levittown | 14 | 9,205(0.15%)#73 | 318,896(0.00%)#2,809 |
| 74. | Chambersburg Borough | 14 | 9,205(0.15%)#74 | 318,896(0.00%)#2,828 |
| 75. | Phoenixville Borough | 14 | 9,205(0.15%)#75 | 318,896(0.00%)#2,833 |
| 76. | Ephrata Borough | 14 | 9,205(0.15%)#76 | 318,896(0.00%)#2,843 |
| 77. | Middletown Borough | 14 | 9,205(0.15%)#77 | 318,896(0.00%)#2,855 |
| 78. | Warren | 14 | 9,205(0.15%)#78 | 318,896(0.00%)#2,856 |
| 79. | Kulpsville | 14 | 9,205(0.15%)#79 | 318,896(0.00%)#2,858 |
| 80. | Bellevue Borough | 14 | 9,205(0.15%)#80 | 318,896(0.00%)#2,862 |
| 81. | Shrewsbury Borough | 14 | 9,205(0.15%)#81 | 318,896(0.00%)#2,893 |
| 82. | Chadds Ford | 14 | 9,205(0.15%)#82 | 318,896(0.00%)#2,918 |
| 83. | Washington | 13 | 9,205(0.14%)#83 | 318,896(0.00%)#2,954 |
| 84. | Spring House | 13 | 9,205(0.14%)#84 | 318,896(0.00%)#2,988 |
| 85. | Plains | 13 | 9,205(0.14%)#85 | 318,896(0.00%)#2,992 |
| 86. | Level Green | 13 | 9,205(0.14%)#86 | 318,896(0.00%)#2,993 |
| 87. | Freeport Borough | 13 | 9,205(0.14%)#87 | 318,896(0.00%)#3,006 |
| 88. | Ferndale Borough | 13 | 9,205(0.14%)#88 | 318,896(0.00%)#3,008 |
| 89. | King Of Prussia | 12 | 9,205(0.13%)#89 | 318,896(0.00%)#3,043 |
| 90. | New Castle | 12 | 9,205(0.13%)#90 | 318,896(0.00%)#3,047 |
| 91. | Folcroft Borough | 12 | 9,205(0.13%)#91 | 318,896(0.00%)#3,098 |
| 92. | Birdsboro Borough | 12 | 9,205(0.13%)#92 | 318,896(0.00%)#3,106 |
| 93. | State Line | 12 | 9,205(0.13%)#93 | 318,896(0.00%)#3,119 |
| 94. | Hokendauqua | 12 | 9,205(0.13%)#94 | 318,896(0.00%)#3,123 |
| 95. | Bakerstown | 12 | 9,205(0.13%)#95 | 318,896(0.00%)#3,126 |
| 96. | Robesonia Borough | 12 | 9,205(0.13%)#96 | 318,896(0.00%)#3,137 |
| 97. | Raubsville | 12 | 9,205(0.13%)#97 | 318,896(0.00%)#3,148 |
| 98. | Hiller | 12 | 9,205(0.13%)#98 | 318,896(0.00%)#3,151 |
| 99. | Harrisburg | 11 | 9,205(0.12%)#99 | 318,896(0.00%)#3,170 |
| 100. | Montgomeryville | 11 | 9,205(0.12%)#100 | 318,896(0.00%)#3,217 |
Common Questions
What are the Top 10 Cities with the Most Immigrants from England in Pennsylvania?
Top 10 Cities with the Most Immigrants from England in Pennsylvania are:
#1
835
#2
153
#3
126
#4
106
#5
87
#6
82
#7
61
#8
58
#9
50
#10
43
What city has the Most Immigrants from England in Pennsylvania?
Philadelphia has the Most Immigrants from England in Pennsylvania with 835.
What is the Total Immigrants from England in the State of Pennsylvania?
Total Immigrants from England in Pennsylvania is 9,205.
What is the Total Immigrants from England in the United States?
Total Immigrants from England in the United States is 318,896.