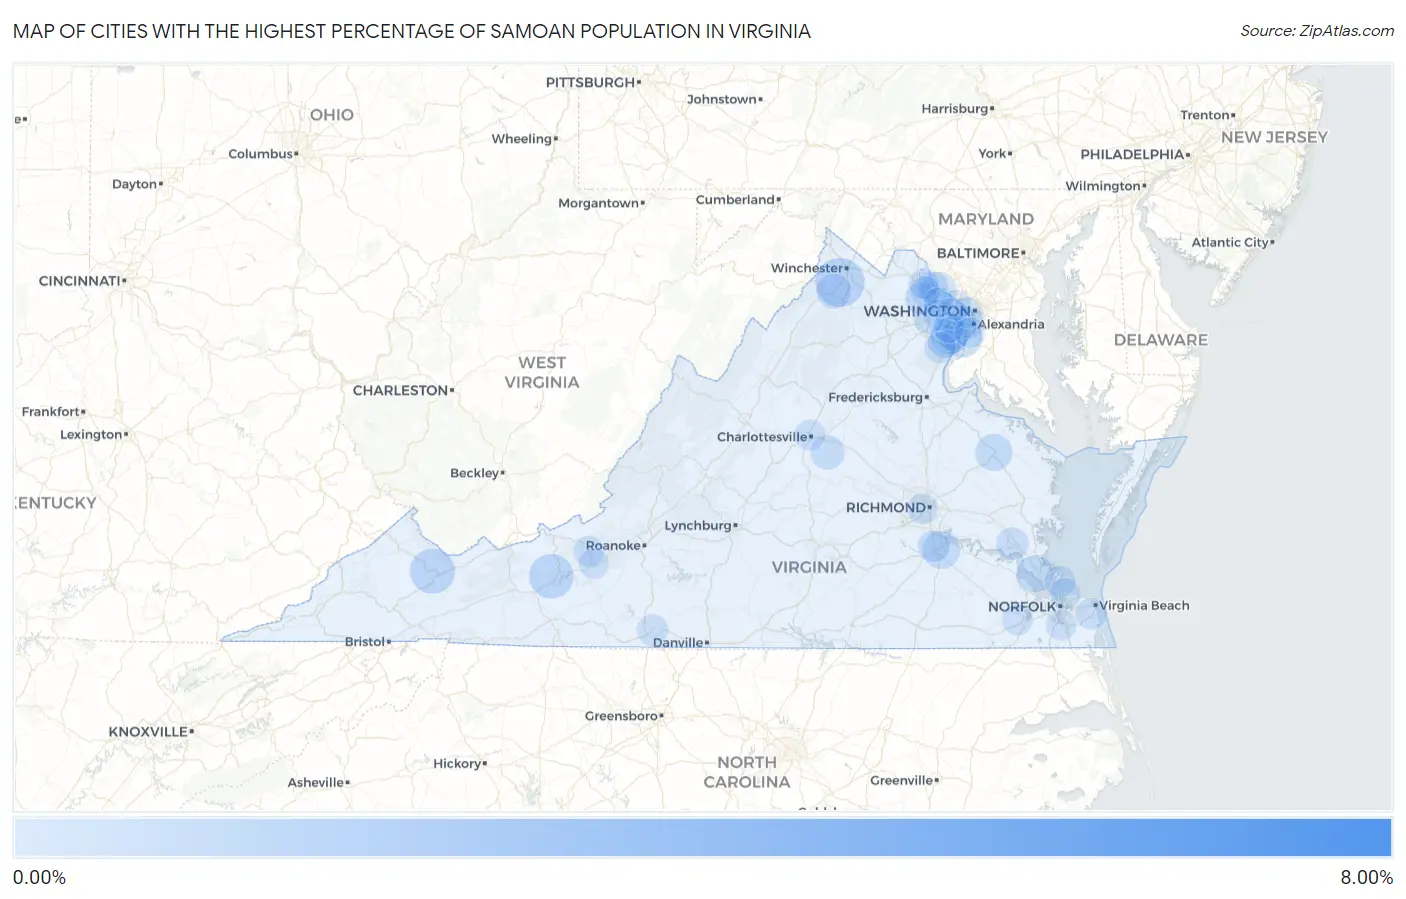
Cities with the Highest Percentage of Samoan Population in Virginia
RELATED REPORTS & OPTIONS
Samoan
Virginia
Compare Cities
Map of Cities with the Highest Percentage of Samoan Population in Virginia
0.00%
8.00%
Cities with the Highest Percentage of Samoan Population in Virginia
| City | Samoan | vs State | vs National | |
| 1. | Brandy Station | 7.78% | 0.032%(+7.75)#1 | 0.069%(+7.71)#22 |
| 2. | Stephens City | 1.00% | 0.032%(+0.965)#2 | 0.069%(+0.928)#288 |
| 3. | Rio | 0.83% | 0.032%(+0.793)#3 | 0.069%(+0.757)#344 |
| 4. | Richlands | 0.78% | 0.032%(+0.746)#4 | 0.069%(+0.710)#363 |
| 5. | Pulaski | 0.75% | 0.032%(+0.714)#5 | 0.069%(+0.677)#378 |
| 6. | Fort Belvoir | 0.50% | 0.032%(+0.467)#6 | 0.069%(+0.430)#518 |
| 7. | Fort Lee | 0.40% | 0.032%(+0.364)#7 | 0.069%(+0.327)#613 |
| 8. | Newport News | 0.37% | 0.032%(+0.335)#8 | 0.069%(+0.298)#649 |
| 9. | Tappahannock | 0.36% | 0.032%(+0.333)#9 | 0.069%(+0.296)#654 |
| 10. | Crosspointe | 0.36% | 0.032%(+0.326)#10 | 0.069%(+0.289)#659 |
| 11. | Lowes Island | 0.30% | 0.032%(+0.270)#11 | 0.069%(+0.233)#732 |
| 12. | Middletown | 0.26% | 0.032%(+0.225)#12 | 0.069%(+0.188)#808 |
| 13. | Lake Monticello | 0.21% | 0.032%(+0.180)#13 | 0.069%(+0.143)#894 |
| 14. | Newington Forest | 0.19% | 0.032%(+0.158)#14 | 0.069%(+0.121)#942 |
| 15. | Lake Ridge | 0.16% | 0.032%(+0.131)#15 | 0.069%(+0.094)#1,017 |
| 16. | Williamsburg | 0.13% | 0.032%(+0.097)#16 | 0.069%(+0.060)#1,126 |
| 17. | Loudoun Valley Estates | 0.11% | 0.032%(+0.082)#17 | 0.069%(+0.045)#1,201 |
| 18. | Leesylvania | 0.10% | 0.032%(+0.072)#18 | 0.069%(+0.035)#1,244 |
| 19. | Countryside | 0.10% | 0.032%(+0.072)#19 | 0.069%(+0.035)#1,248 |
| 20. | Colonial Heights | 0.088% | 0.032%(+0.056)#20 | 0.069%(+0.019)#1,313 |
| 21. | Merrifield | 0.075% | 0.032%(+0.043)#21 | 0.069%(+0.006)#1,376 |
| 22. | Dale City | 0.072% | 0.032%(+0.040)#22 | 0.069%(+0.003)#1,401 |
| 23. | Martinsville | 0.066% | 0.032%(+0.034)#23 | 0.069%(-0.003)#1,433 |
| 24. | Virginia Beach | 0.064% | 0.032%(+0.032)#24 | 0.069%(-0.005)#1,449 |
| 25. | Alexandria | 0.063% | 0.032%(+0.031)#25 | 0.069%(-0.006)#1,456 |
| 26. | Hampton | 0.060% | 0.032%(+0.028)#26 | 0.069%(-0.009)#1,475 |
| 27. | Norfolk | 0.052% | 0.032%(+0.020)#27 | 0.069%(-0.017)#1,532 |
| 28. | Rose Hill Cdp Fairfax County | 0.052% | 0.032%(+0.020)#28 | 0.069%(-0.017)#1,533 |
| 29. | Fair Oaks | 0.046% | 0.032%(+0.013)#29 | 0.069%(-0.023)#1,591 |
| 30. | Charlottesville | 0.041% | 0.032%(+0.009)#30 | 0.069%(-0.028)#1,615 |
| 31. | Burke | 0.032% | 0.032%(-0.001)#31 | 0.069%(-0.037)#1,694 |
| 32. | Suffolk | 0.027% | 0.032%(-0.005)#32 | 0.069%(-0.042)#1,728 |
| 33. | Blacksburg | 0.027% | 0.032%(-0.006)#33 | 0.069%(-0.042)#1,739 |
| 34. | Richmond | 0.023% | 0.032%(-0.009)#34 | 0.069%(-0.046)#1,771 |
| 35. | Arlington | 0.022% | 0.032%(-0.010)#35 | 0.069%(-0.047)#1,773 |
| 36. | Chesapeake | 0.022% | 0.032%(-0.011)#36 | 0.069%(-0.047)#1,783 |
| 37. | Centreville | 0.021% | 0.032%(-0.012)#37 | 0.069%(-0.048)#1,796 |
| 38. | Mclean | 0.018% | 0.032%(-0.014)#38 | 0.069%(-0.051)#1,815 |
| 39. | Hybla Valley | 0.017% | 0.032%(-0.016)#39 | 0.069%(-0.052)#1,839 |
| 40. | Lansdowne | 0.016% | 0.032%(-0.017)#40 | 0.069%(-0.053)#1,853 |
| 41. | Ashburn | 0.015% | 0.032%(-0.017)#41 | 0.069%(-0.054)#1,856 |
| 42. | Christiansburg | 0.0087% | 0.032%(-0.023)#42 | 0.069%(-0.060)#1,917 |
| 43. | Reston | 0.0032% | 0.032%(-0.029)#43 | 0.069%(-0.066)#1,970 |
1
2Common Questions
What are the Top 10 Cities with the Highest Percentage of Samoan Population in Virginia?
Top 10 Cities with the Highest Percentage of Samoan Population in Virginia are:
#1
1.00%
#2
0.78%
#3
0.75%
#4
0.50%
#5
0.40%
#6
0.37%
#7
0.36%
#8
0.36%
#9
0.30%
#10
0.26%
What city has the Highest Percentage of Samoan Population in Virginia?
Stephens City has the Highest Percentage of Samoan Population in Virginia with 1.00%.
What is the Percentage of Samoan Population in the State of Virginia?
Percentage of Samoan Population in Virginia is 0.032%.
What is the Percentage of Samoan Population in the United States?
Percentage of Samoan Population in the United States is 0.069%.