Cities with the Highest Percentage of Samoan Population in Missouri
RELATED REPORTS & OPTIONS
Samoan
Missouri
Compare Cities
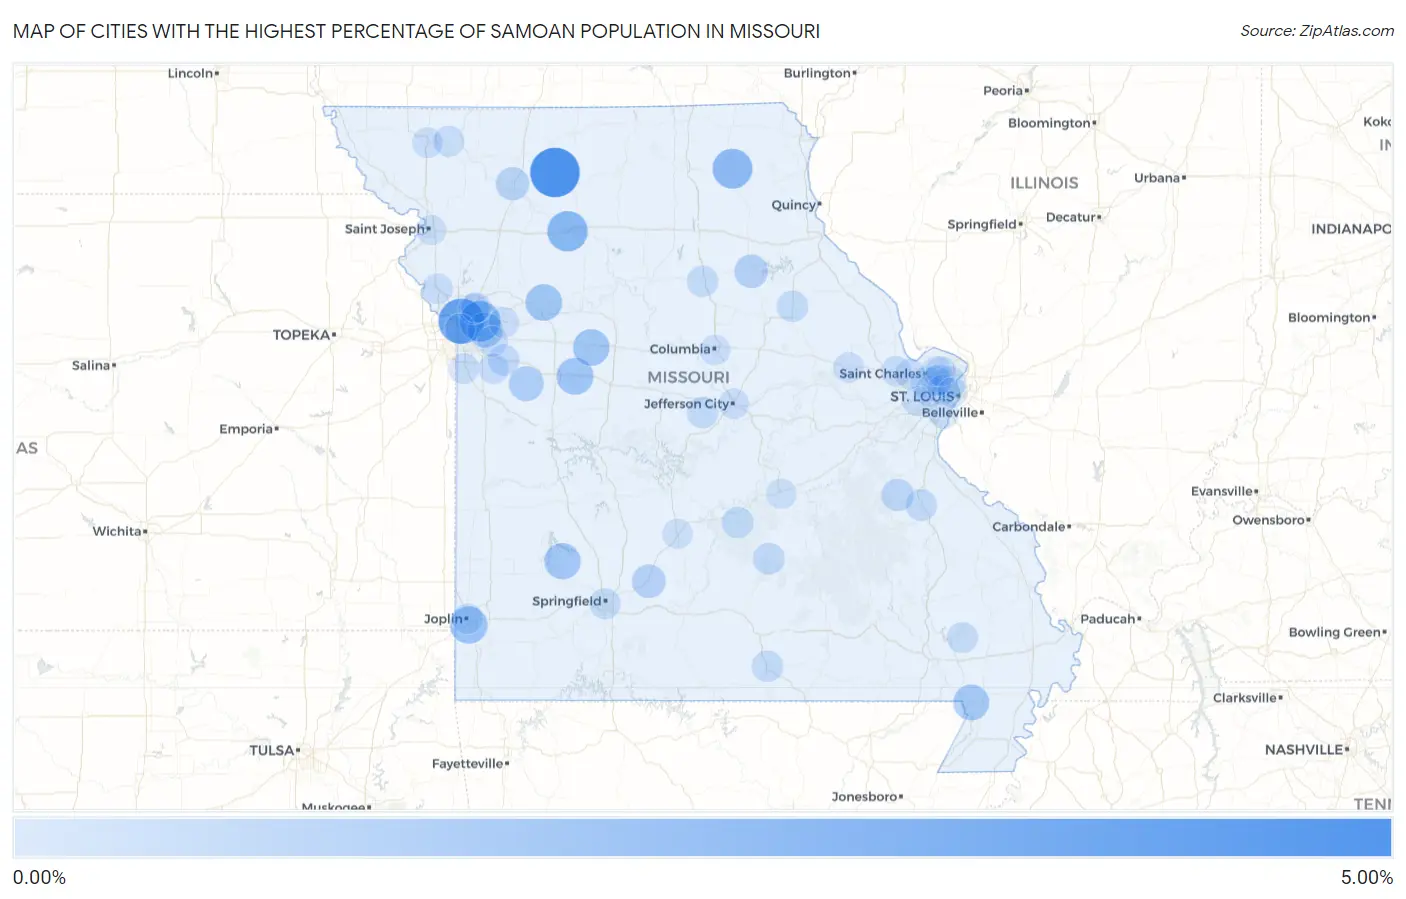
Map of Cities with the Highest Percentage of Samoan Population in Missouri
0.00%
5.00%
Cities with the Highest Percentage of Samoan Population in Missouri
| City | Samoan | vs State | vs National | |
| 1. | Brimson | 4.76% | 0.069%(+4.69)#1 | 0.069%(+4.69)#53 |
| 2. | North Kansas City | 3.73% | 0.069%(+3.66)#2 | 0.069%(+3.66)#70 |
| 3. | Sugar Creek | 2.56% | 0.069%(+2.49)#3 | 0.069%(+2.49)#105 |
| 4. | Utica | 2.48% | 0.069%(+2.41)#4 | 0.069%(+2.41)#107 |
| 5. | Edina | 2.32% | 0.069%(+2.25)#5 | 0.069%(+2.25)#117 |
| 6. | Leawood | 1.73% | 0.069%(+1.66)#6 | 0.069%(+1.67)#164 |
| 7. | Knob Noster | 1.61% | 0.069%(+1.54)#7 | 0.069%(+1.54)#176 |
| 8. | Hardin | 1.52% | 0.069%(+1.45)#8 | 0.069%(+1.45)#187 |
| 9. | Sweet Springs | 1.51% | 0.069%(+1.44)#9 | 0.069%(+1.44)#190 |
| 10. | Dadeville | 1.45% | 0.069%(+1.38)#10 | 0.069%(+1.38)#194 |
| 11. | Campbell | 1.34% | 0.069%(+1.27)#11 | 0.069%(+1.27)#215 |
| 12. | Independence | 1.17% | 0.069%(+1.10)#12 | 0.069%(+1.10)#243 |
| 13. | Holden | 1.09% | 0.069%(+1.02)#13 | 0.069%(+1.02)#268 |
| 14. | Marshfield | 0.81% | 0.069%(+0.744)#14 | 0.069%(+0.744)#347 |
| 15. | Paris | 0.79% | 0.069%(+0.725)#15 | 0.069%(+0.725)#357 |
| 16. | Pattonsburg | 0.72% | 0.069%(+0.655)#16 | 0.069%(+0.656)#387 |
| 17. | Mineral Point | 0.51% | 0.069%(+0.438)#17 | 0.069%(+0.439)#510 |
| 18. | Jennings | 0.44% | 0.069%(+0.369)#18 | 0.069%(+0.370)#575 |
| 19. | Licking | 0.40% | 0.069%(+0.326)#19 | 0.069%(+0.326)#614 |
| 20. | Russellville | 0.34% | 0.069%(+0.273)#20 | 0.069%(+0.273)#682 |
| 21. | Desloge | 0.31% | 0.069%(+0.238)#21 | 0.069%(+0.239)#722 |
| 22. | West Plains | 0.30% | 0.069%(+0.233)#22 | 0.069%(+0.233)#731 |
| 23. | Lone Jack | 0.30% | 0.069%(+0.232)#23 | 0.069%(+0.232)#733 |
| 24. | Fort Leonard Wood | 0.30% | 0.069%(+0.232)#24 | 0.069%(+0.232)#734 |
| 25. | Laddonia | 0.30% | 0.069%(+0.229)#25 | 0.069%(+0.229)#739 |
| 26. | Moberly | 0.27% | 0.069%(+0.201)#26 | 0.069%(+0.201)#789 |
| 27. | Maryland Heights | 0.26% | 0.069%(+0.187)#27 | 0.069%(+0.187)#809 |
| 28. | Springfield | 0.21% | 0.069%(+0.145)#28 | 0.069%(+0.145)#888 |
| 29. | Puxico | 0.20% | 0.069%(+0.130)#29 | 0.069%(+0.131)#922 |
| 30. | Ravenwood | 0.19% | 0.069%(+0.119)#30 | 0.069%(+0.120)#944 |
| 31. | Glenaire | 0.18% | 0.069%(+0.113)#31 | 0.069%(+0.114)#953 |
| 32. | Belton | 0.14% | 0.069%(+0.067)#32 | 0.069%(+0.067)#1,104 |
| 33. | Platte City | 0.13% | 0.069%(+0.056)#33 | 0.069%(+0.057)#1,145 |
| 34. | Creve Coeur | 0.12% | 0.069%(+0.048)#34 | 0.069%(+0.049)#1,179 |
| 35. | Warrenton | 0.12% | 0.069%(+0.046)#35 | 0.069%(+0.047)#1,194 |
| 36. | Blue Springs | 0.11% | 0.069%(+0.043)#36 | 0.069%(+0.043)#1,211 |
| 37. | Joplin | 0.095% | 0.069%(+0.025)#37 | 0.069%(+0.026)#1,282 |
| 38. | Maryville | 0.094% | 0.069%(+0.024)#38 | 0.069%(+0.025)#1,291 |
| 39. | Edmundson | 0.082% | 0.069%(+0.012)#39 | 0.069%(+0.013)#1,340 |
| 40. | O Fallon | 0.079% | 0.069%(+0.010)#40 | 0.069%(+0.011)#1,357 |
| 41. | Kansas City | 0.076% | 0.069%(+0.007)#41 | 0.069%(+0.008)#1,372 |
| 42. | Pleasant Hill | 0.068% | 0.069%(-0.001)#42 | 0.069%(-0.001)#1,425 |
| 43. | Jefferson City | 0.068% | 0.069%(-0.001)#43 | 0.069%(-0.001)#1,426 |
| 44. | Buckner | 0.068% | 0.069%(-0.001)#44 | 0.069%(-0.001)#1,427 |
| 45. | Columbia | 0.064% | 0.069%(-0.005)#45 | 0.069%(-0.005)#1,445 |
| 46. | Ballwin | 0.052% | 0.069%(-0.018)#46 | 0.069%(-0.017)#1,534 |
| 47. | Lebanon | 0.047% | 0.069%(-0.023)#47 | 0.069%(-0.022)#1,585 |
| 48. | Rolla | 0.045% | 0.069%(-0.024)#48 | 0.069%(-0.024)#1,597 |
| 49. | St Ann | 0.039% | 0.069%(-0.031)#49 | 0.069%(-0.030)#1,631 |
| 50. | University City | 0.034% | 0.069%(-0.035)#50 | 0.069%(-0.035)#1,671 |
| 51. | Hazelwood | 0.028% | 0.069%(-0.042)#51 | 0.069%(-0.041)#1,726 |
| 52. | St Peters | 0.024% | 0.069%(-0.045)#52 | 0.069%(-0.045)#1,755 |
| 53. | Mehlville | 0.024% | 0.069%(-0.045)#53 | 0.069%(-0.045)#1,760 |
| 54. | Florissant | 0.021% | 0.069%(-0.048)#54 | 0.069%(-0.048)#1,788 |
| 55. | Liberty | 0.020% | 0.069%(-0.050)#55 | 0.069%(-0.049)#1,803 |
| 56. | St Louis | 0.015% | 0.069%(-0.055)#56 | 0.069%(-0.054)#1,864 |
| 57. | St Joseph | 0.014% | 0.069%(-0.056)#57 | 0.069%(-0.055)#1,870 |
1
2Common Questions
What are the Top 10 Cities with the Highest Percentage of Samoan Population in Missouri?
Top 10 Cities with the Highest Percentage of Samoan Population in Missouri are:
#1
4.76%
#2
3.73%
#3
2.56%
#4
2.48%
#5
2.32%
#6
1.73%
#7
1.61%
#8
1.52%
#9
1.51%
#10
1.45%
What city has the Highest Percentage of Samoan Population in Missouri?
Brimson has the Highest Percentage of Samoan Population in Missouri with 4.76%.
What is the Percentage of Samoan Population in the State of Missouri?
Percentage of Samoan Population in Missouri is 0.069%.
What is the Percentage of Samoan Population in the United States?
Percentage of Samoan Population in the United States is 0.069%.