Cities with the Highest Percentage of Immigrants from Malaysia in Ohio
RELATED REPORTS & OPTIONS
Malaysia
Ohio
Compare Cities
Map of Cities with the Highest Percentage of Immigrants from Malaysia in Ohio
0.00%
1.50%
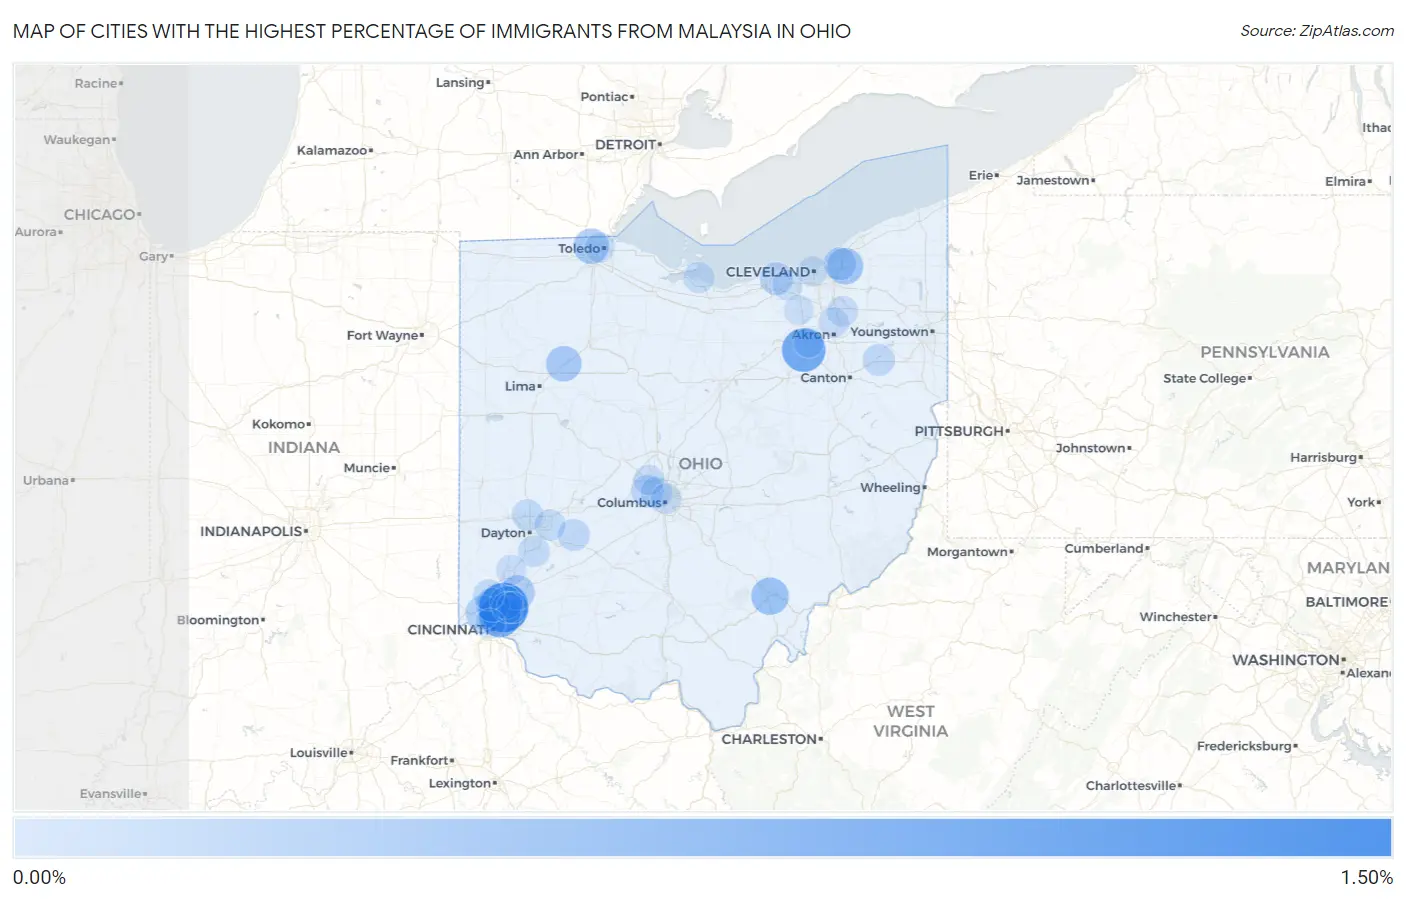
Cities with the Highest Percentage of Immigrants from Malaysia in Ohio
| City | Malaysia | vs State | vs National | |
| 1. | Evendale | 1.46% | 0.012%(+1.45)#-1 | 0.025%(+1.44)#0 |
| 2. | Rittman | 1.01% | 0.012%(+0.995)#0 | 0.025%(+0.982)#1 |
| 3. | Golf Manor | 0.87% | 0.012%(+0.860)#1 | 0.025%(+0.847)#2 |
| 4. | Athens | 0.54% | 0.012%(+0.526)#2 | 0.025%(+0.513)#3 |
| 5. | Gates Mills | 0.46% | 0.012%(+0.452)#3 | 0.025%(+0.438)#4 |
| 6. | Ottawa Hills | 0.40% | 0.012%(+0.386)#4 | 0.025%(+0.372)#5 |
| 7. | Bluffton | 0.40% | 0.012%(+0.384)#5 | 0.025%(+0.371)#6 |
| 8. | Mason | 0.32% | 0.012%(+0.308)#6 | 0.025%(+0.294)#7 |
| 9. | White Oak | 0.28% | 0.012%(+0.266)#7 | 0.025%(+0.253)#8 |
| 10. | Greenhills | 0.27% | 0.012%(+0.258)#8 | 0.025%(+0.245)#9 |
| 11. | Avon | 0.20% | 0.012%(+0.190)#9 | 0.025%(+0.176)#10 |
| 12. | Highland Heights | 0.20% | 0.012%(+0.185)#10 | 0.025%(+0.172)#11 |
| 13. | Sharonville | 0.19% | 0.012%(+0.174)#11 | 0.025%(+0.160)#12 |
| 14. | Hilliard | 0.18% | 0.012%(+0.168)#13 | 0.025%(+0.155)#767 |
| 15. | Cedarville | 0.13% | 0.012%(+0.116)#14 | 0.025%(+0.103)#768 |
| 16. | Alliance | 0.12% | 0.012%(+0.113)#15 | 0.025%(+0.100)#769 |
| 17. | Upper Arlington | 0.11% | 0.012%(+0.095)#16 | 0.025%(+0.082)#770 |
| 18. | Vandalia | 0.092% | 0.012%(+0.081)#17 | 0.025%(+0.068)#771 |
| 19. | Centerville | 0.090% | 0.012%(+0.078)#18 | 0.025%(+0.065)#772 |
| 20. | Blue Ash | 0.083% | 0.012%(+0.071)#19 | 0.025%(+0.058)#773 |
| 21. | Sandusky | 0.076% | 0.012%(+0.064)#20 | 0.025%(+0.051)#774 |
| 22. | Fairborn | 0.075% | 0.012%(+0.064)#21 | 0.025%(+0.050)#775 |
| 23. | Montgomery | 0.074% | 0.012%(+0.062)#22 | 0.025%(+0.049)#776 |
| 24. | Fairfield | 0.070% | 0.012%(+0.058)#23 | 0.025%(+0.045)#777 |
| 25. | Hudson | 0.057% | 0.012%(+0.045)#24 | 0.025%(+0.032)#778 |
| 26. | Dublin | 0.051% | 0.012%(+0.039)#25 | 0.025%(+0.026)#779 |
| 27. | North Olmsted | 0.028% | 0.012%(+0.016)#26 | 0.025%(+0.003)#780 |
| 28. | Middletown | 0.028% | 0.012%(+0.016)#27 | 0.025%(+0.003)#781 |
| 29. | Columbus | 0.026% | 0.012%(+0.015)#28 | 0.025%(+0.002)#842 |
| 30. | Cuyahoga Falls | 0.016% | 0.012%(+0.004)#29 | 0.025%(-0.009)#1,129 |
| 31. | Cleveland | 0.016% | 0.012%(+0.004)#30 | 0.025%(-0.009)#1,459 |
| 32. | Wadsworth | 0.0083% | 0.012%(-0.003)#31 | 0.025%(-0.017)#1,460 |
| 33. | Cincinnati | 0.0071% | 0.012%(-0.005)#32 | 0.025%(-0.018)#1,468 |
| 34. | Toledo | 0.0070% | 0.012%(-0.005)#33 | 0.025%(-0.018)#1,569 |
| 35. | Brunswick | 0.0057% | 0.012%(-0.006)#34 | 0.025%(-0.019)#1,570 |
Common Questions
What are the Top 10 Cities with the Highest Percentage of Immigrants from Malaysia in Ohio?
Top 10 Cities with the Highest Percentage of Immigrants from Malaysia in Ohio are:
#1
1.46%
#2
1.01%
#3
0.87%
#4
0.54%
#5
0.46%
#6
0.40%
#7
0.40%
#8
0.32%
#9
0.28%
#10
0.27%
What city has the Highest Percentage of Immigrants from Malaysia in Ohio?
Evendale has the Highest Percentage of Immigrants from Malaysia in Ohio with 1.46%.
What is the Percentage of Immigrants from Malaysia in the State of Ohio?
Percentage of Immigrants from Malaysia in Ohio is 0.012%.
What is the Percentage of Immigrants from Malaysia in the United States?
Percentage of Immigrants from Malaysia in the United States is 0.025%.