West Whittier Los Nietos, CA Map & Demographics
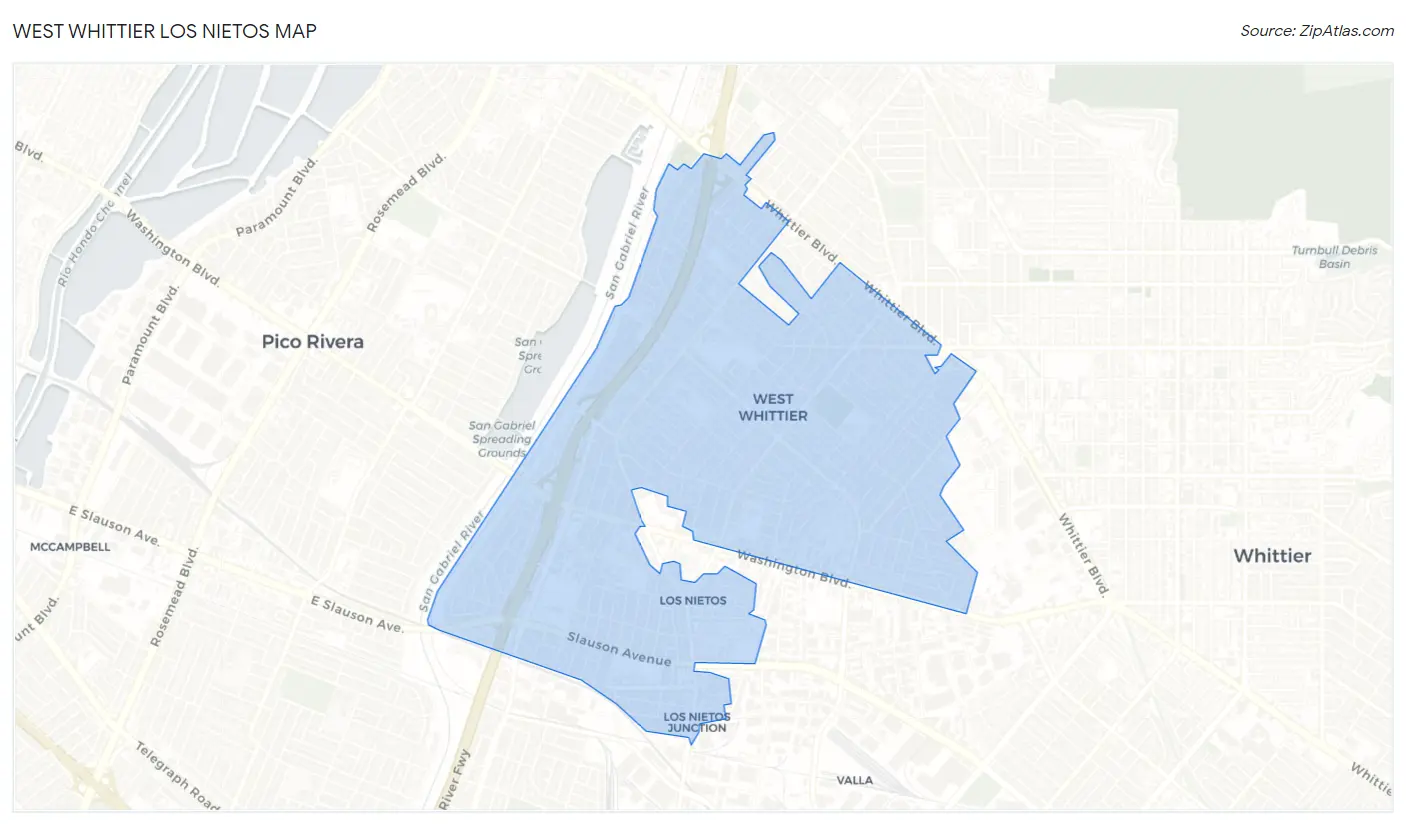
West Whittier Los Nietos Map
West Whittier Los Nietos Overview
$29,037
PER CAPITA INCOME
$94,278
AVG FAMILY INCOME
$88,064
AVG HOUSEHOLD INCOME
16.8%
WAGE / INCOME GAP [ % ]
83.2¢/ $1
WAGE / INCOME GAP [ $ ]
$11,618
FAMILY INCOME DEFICIT
0.40
INEQUALITY / GINI INDEX
25,442
TOTAL POPULATION
12,540
MALE POPULATION
12,902
FEMALE POPULATION
97.19
MALES / 100 FEMALES
102.89
FEMALES / 100 MALES
37.2
MEDIAN AGE
4.0
AVG FAMILY SIZE
3.7
AVG HOUSEHOLD SIZE
11,951
LABOR FORCE [ PEOPLE ]
57.9%
PERCENT IN LABOR FORCE
3.9%
UNEMPLOYMENT RATE
Income in West Whittier Los Nietos
Income Overview in West Whittier Los Nietos
Per Capita Income in West Whittier Los Nietos is $29,037, while median incomes of families and households are $94,278 and $88,064 respectively.
| Characteristic | Number | Measure |
| Per Capita Income | 25,442 | $29,037 |
| Median Family Income | 5,641 | $94,278 |
| Mean Family Income | 5,641 | $110,721 |
| Median Household Income | 6,779 | $88,064 |
| Mean Household Income | 6,779 | $104,238 |
| Income Deficit | 5,641 | $11,618 |
| Wage / Income Gap (%) | 25,442 | 16.80% |
| Wage / Income Gap ($) | 25,442 | 83.20¢ per $1 |
| Gini / Inequality Index | 25,442 | 0.40 |
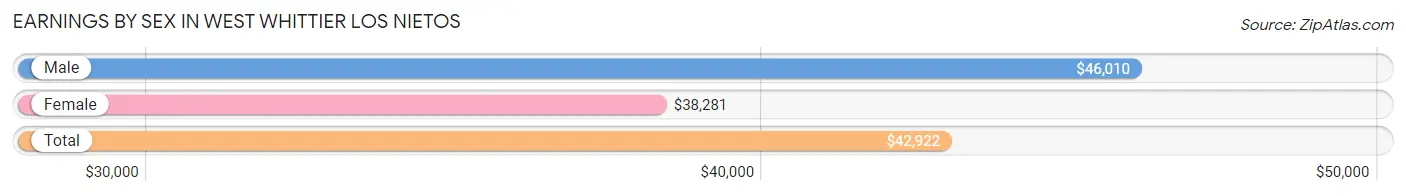
Earnings by Sex in West Whittier Los Nietos
Average Earnings in West Whittier Los Nietos are $42,922, $46,010 for men and $38,281 for women, a difference of 16.8%.
| Sex | Number | Average Earnings |
| Male | 6,727 (55.3%) | $46,010 |
| Female | 5,443 (44.7%) | $38,281 |
| Total | 12,170 (100.0%) | $42,922 |
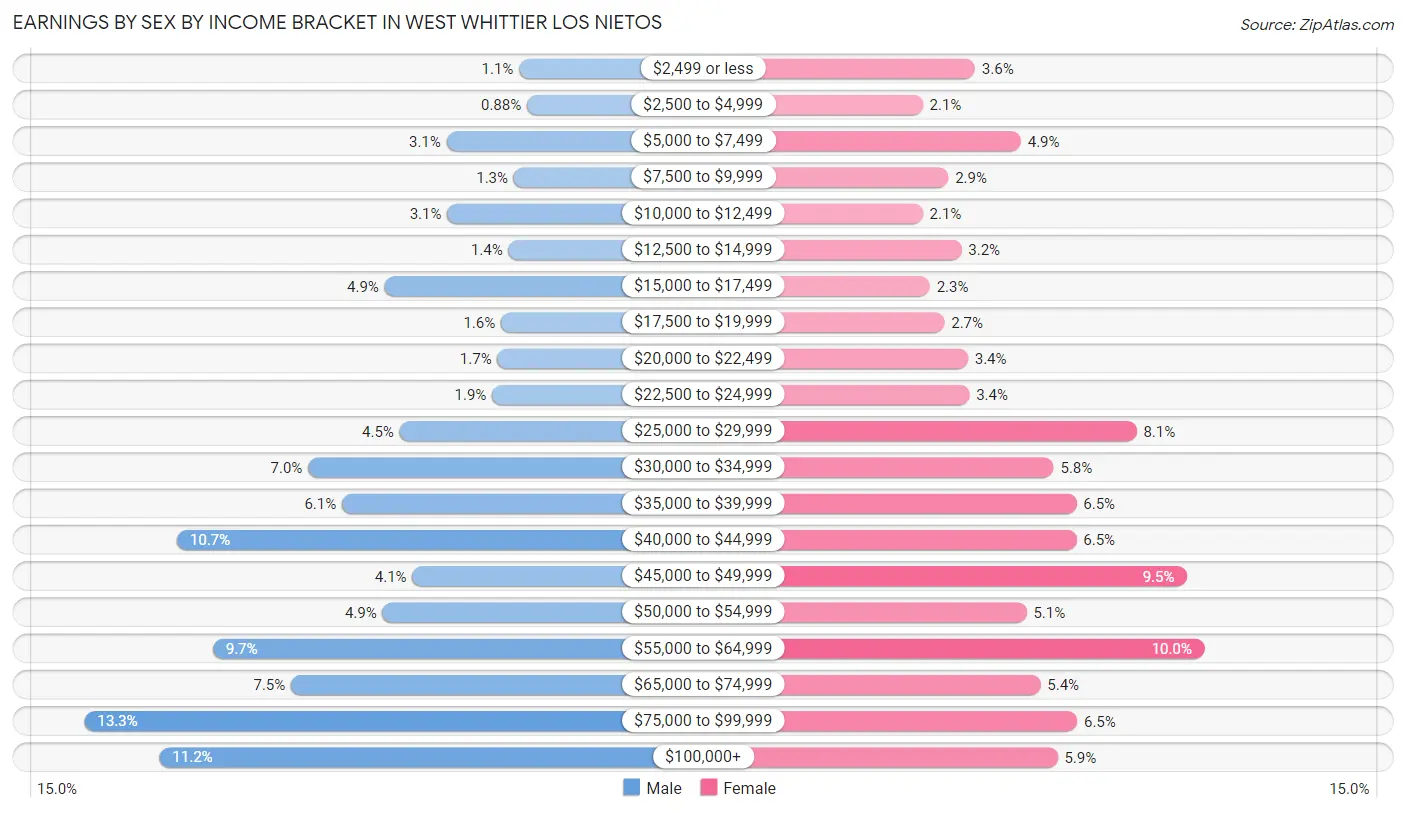
Earnings by Sex by Income Bracket in West Whittier Los Nietos
The most common earnings brackets in West Whittier Los Nietos are $75,000 to $99,999 for men (896 | 13.3%) and $55,000 to $64,999 for women (546 | 10.0%).
| Income | Male | Female |
| $2,499 or less | 74 (1.1%) | 196 (3.6%) |
| $2,500 to $4,999 | 59 (0.9%) | 116 (2.1%) |
| $5,000 to $7,499 | 211 (3.1%) | 266 (4.9%) |
| $7,500 to $9,999 | 84 (1.3%) | 155 (2.9%) |
| $10,000 to $12,499 | 210 (3.1%) | 116 (2.1%) |
| $12,500 to $14,999 | 94 (1.4%) | 175 (3.2%) |
| $15,000 to $17,499 | 328 (4.9%) | 127 (2.3%) |
| $17,500 to $19,999 | 108 (1.6%) | 149 (2.7%) |
| $20,000 to $22,499 | 115 (1.7%) | 185 (3.4%) |
| $22,500 to $24,999 | 125 (1.9%) | 187 (3.4%) |
| $25,000 to $29,999 | 300 (4.5%) | 443 (8.1%) |
| $30,000 to $34,999 | 473 (7.0%) | 316 (5.8%) |
| $35,000 to $39,999 | 409 (6.1%) | 351 (6.5%) |
| $40,000 to $44,999 | 721 (10.7%) | 351 (6.5%) |
| $45,000 to $49,999 | 276 (4.1%) | 519 (9.5%) |
| $50,000 to $54,999 | 332 (4.9%) | 275 (5.1%) |
| $55,000 to $64,999 | 653 (9.7%) | 546 (10.0%) |
| $65,000 to $74,999 | 505 (7.5%) | 296 (5.4%) |
| $75,000 to $99,999 | 896 (13.3%) | 352 (6.5%) |
| $100,000+ | 754 (11.2%) | 322 (5.9%) |
| Total | 6,727 (100.0%) | 5,443 (100.0%) |
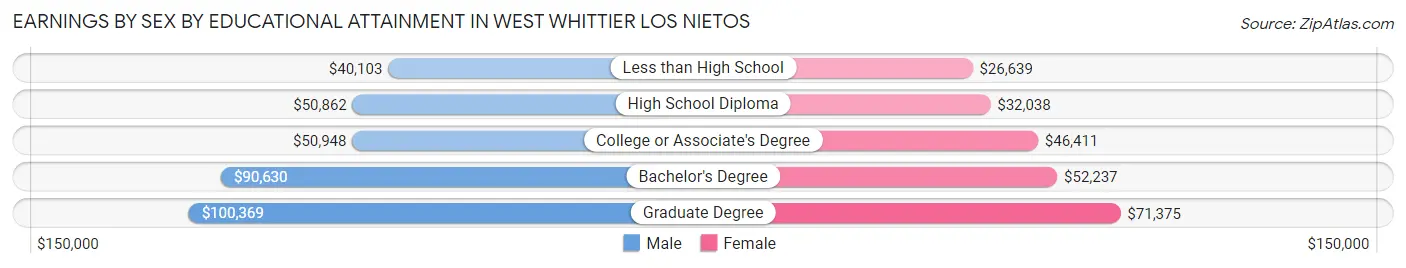
Earnings by Sex by Educational Attainment in West Whittier Los Nietos
Average earnings in West Whittier Los Nietos are $50,090 for men and $42,577 for women, a difference of 15.0%. Men with an educational attainment of graduate degree enjoy the highest average annual earnings of $100,369, while those with less than high school education earn the least with $40,103. Women with an educational attainment of graduate degree earn the most with the average annual earnings of $71,375, while those with less than high school education have the smallest earnings of $26,639.
| Educational Attainment | Male Income | Female Income |
| Less than High School | $40,103 | $26,639 |
| High School Diploma | $50,862 | $32,038 |
| College or Associate's Degree | $50,948 | $46,411 |
| Bachelor's Degree | $90,630 | $52,237 |
| Graduate Degree | $100,369 | $71,375 |
| Total | $50,090 | $42,577 |
Family Income in West Whittier Los Nietos
Family Income Brackets in West Whittier Los Nietos
According to the West Whittier Los Nietos family income data, there are 1,495 families falling into the $100,000 to $149,999 income range, which is the most common income bracket and makes up 26.5% of all families. Conversely, the $10,000 to $14,999 income bracket is the least frequent group with only 51 families (0.9%) belonging to this category.
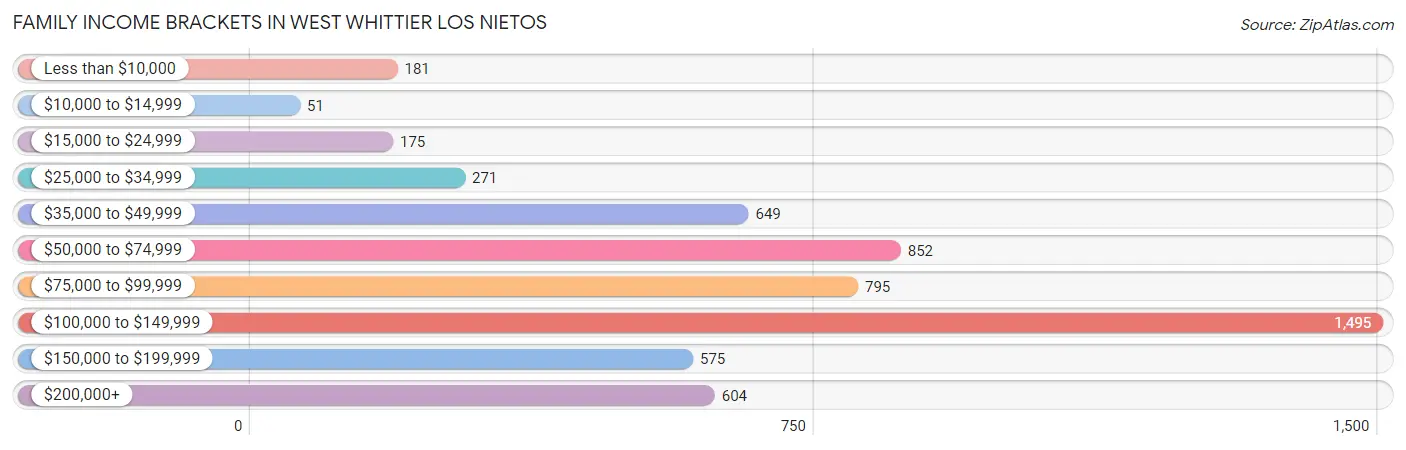
| Income Bracket | # Families | % Families |
| Less than $10,000 | 181 | 3.2% |
| $10,000 to $14,999 | 51 | 0.9% |
| $15,000 to $24,999 | 175 | 3.1% |
| $25,000 to $34,999 | 271 | 4.8% |
| $35,000 to $49,999 | 649 | 11.5% |
| $50,000 to $74,999 | 852 | 15.1% |
| $75,000 to $99,999 | 795 | 14.1% |
| $100,000 to $149,999 | 1,495 | 26.5% |
| $150,000 to $199,999 | 575 | 10.2% |
| $200,000+ | 604 | 10.7% |
Family Income by Famaliy Size in West Whittier Los Nietos
6-person families (529 | 9.4%) account for the highest median family income in West Whittier Los Nietos with $132,982 per family, while 2-person families (1,765 | 31.3%) have the highest median income of $33,192 per family member.
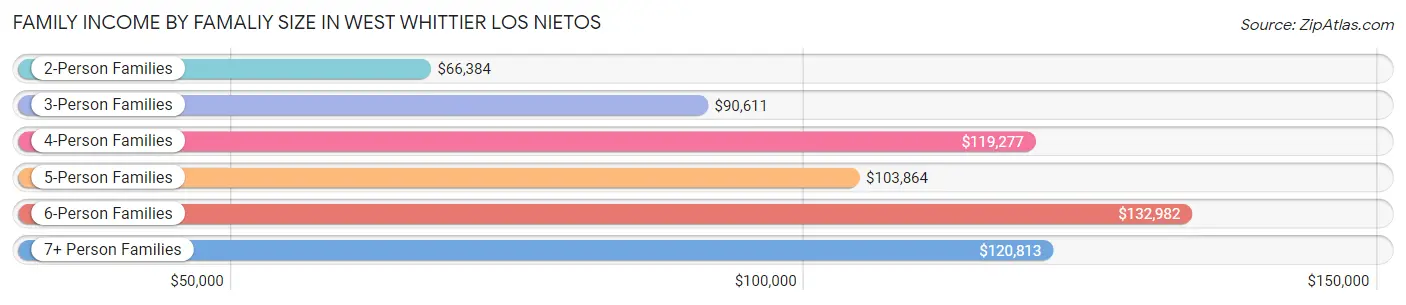
| Income Bracket | # Families | Median Income |
| 2-Person Families | 1,765 (31.3%) | $66,384 |
| 3-Person Families | 1,000 (17.7%) | $90,611 |
| 4-Person Families | 1,111 (19.7%) | $119,277 |
| 5-Person Families | 814 (14.4%) | $103,864 |
| 6-Person Families | 529 (9.4%) | $132,982 |
| 7+ Person Families | 422 (7.5%) | $120,813 |
| Total | 5,641 (100.0%) | $94,278 |
Family Income by Number of Earners in West Whittier Los Nietos
The median family income in West Whittier Los Nietos is $94,278, with families comprising 3+ earners (1,274) having the highest median family income of $144,762, while families with no earners (631) have the lowest median family income of $33,527, accounting for 22.6% and 11.2% of families, respectively.
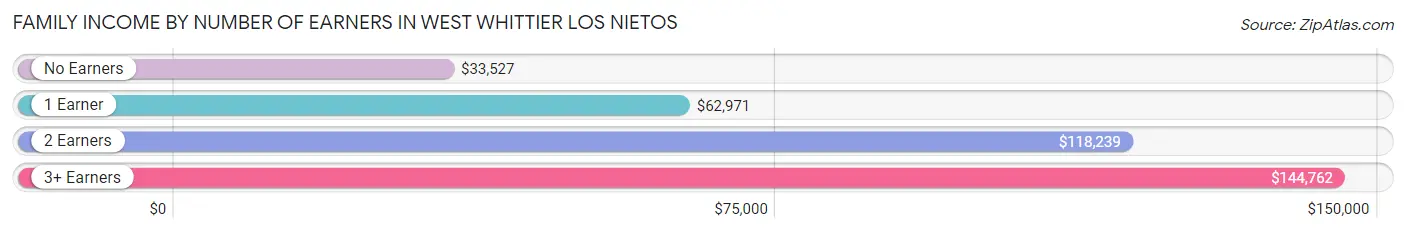
| Number of Earners | # Families | Median Income |
| No Earners | 631 (11.2%) | $33,527 |
| 1 Earner | 1,737 (30.8%) | $62,971 |
| 2 Earners | 1,999 (35.4%) | $118,239 |
| 3+ Earners | 1,274 (22.6%) | $144,762 |
| Total | 5,641 (100.0%) | $94,278 |
Household Income in West Whittier Los Nietos
Household Income Brackets in West Whittier Los Nietos
With 1,593 households falling in the category, the $100,000 to $149,999 income range is the most frequent in West Whittier Los Nietos, accounting for 23.5% of all households. In contrast, only 169 households (2.5%) fall into the $10,000 to $14,999 income bracket, making it the least populous group.
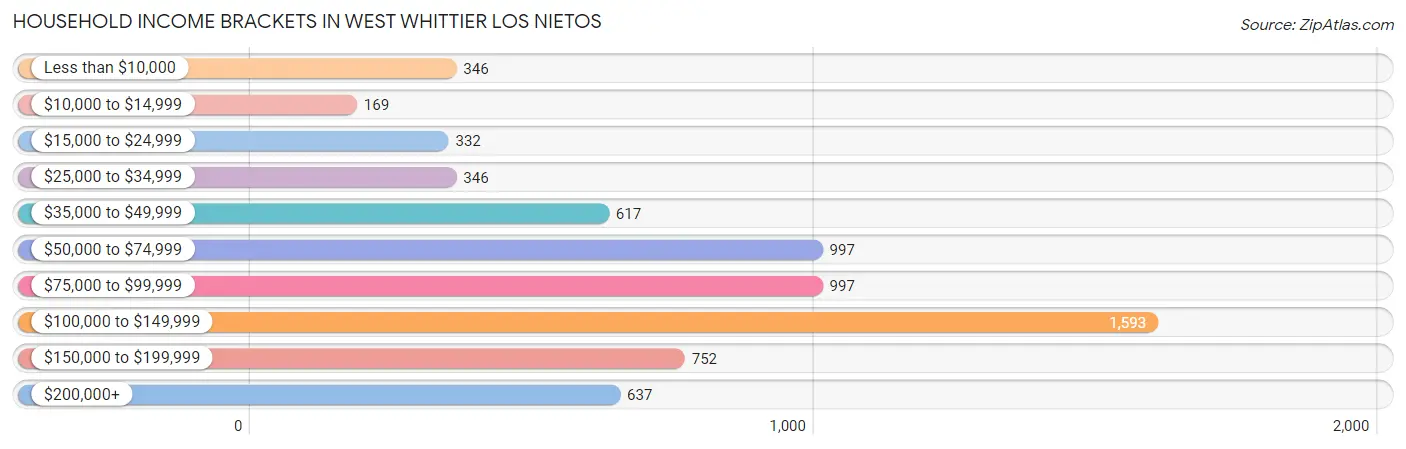
| Income Bracket | # Households | % Households |
| Less than $10,000 | 346 | 5.1% |
| $10,000 to $14,999 | 169 | 2.5% |
| $15,000 to $24,999 | 332 | 4.9% |
| $25,000 to $34,999 | 346 | 5.1% |
| $35,000 to $49,999 | 617 | 9.1% |
| $50,000 to $74,999 | 997 | 14.7% |
| $75,000 to $99,999 | 997 | 14.7% |
| $100,000 to $149,999 | 1,593 | 23.5% |
| $150,000 to $199,999 | 752 | 11.1% |
| $200,000+ | 637 | 9.4% |
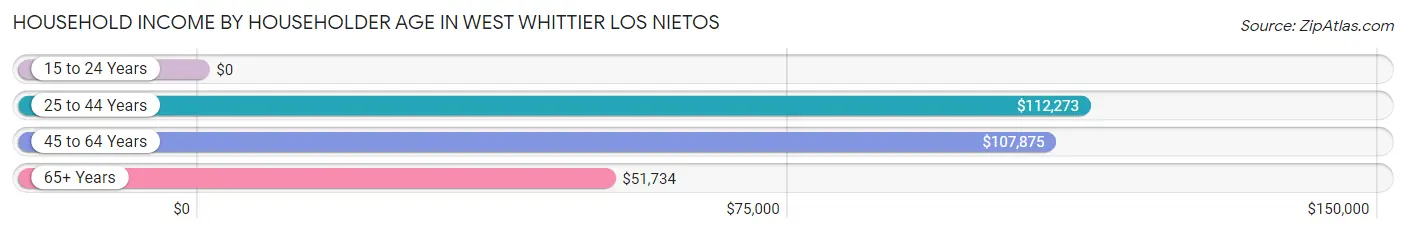
Household Income by Householder Age in West Whittier Los Nietos
The median household income in West Whittier Los Nietos is $88,064, with the highest median household income of $112,273 found in the 25 to 44 years age bracket for the primary householder. A total of 1,942 households (28.6%) fall into this category. Meanwhile, the 15 to 24 years age bracket for the primary householder has the lowest median household income of $0, with 27 households (0.4%) in this group.
| Income Bracket | # Households | Median Income |
| 15 to 24 Years | 27 (0.4%) | $0 |
| 25 to 44 Years | 1,942 (28.6%) | $112,273 |
| 45 to 64 Years | 2,986 (44.1%) | $107,875 |
| 65+ Years | 1,824 (26.9%) | $51,734 |
| Total | 6,779 (100.0%) | $88,064 |
Poverty in West Whittier Los Nietos
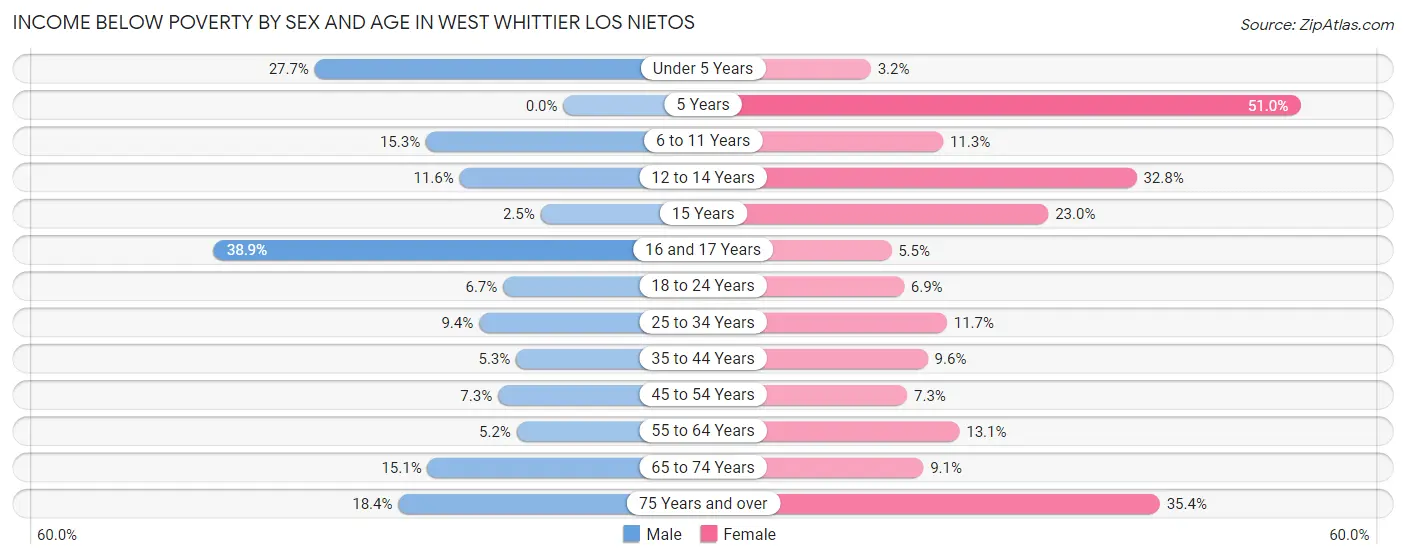
Income Below Poverty by Sex and Age in West Whittier Los Nietos
With 11.0% poverty level for males and 13.3% for females among the residents of West Whittier Los Nietos, 16 and 17 year old males and 5 year old females are the most vulnerable to poverty, with 165 males (38.9%) and 99 females (51.0%) in their respective age groups living below the poverty level.
| Age Bracket | Male | Female |
| Under 5 Years | 134 (27.7%) | 25 (3.2%) |
| 5 Years | 0 (0.0%) | 99 (51.0%) |
| 6 to 11 Years | 157 (15.3%) | 101 (11.3%) |
| 12 to 14 Years | 40 (11.6%) | 192 (32.8%) |
| 15 Years | 5 (2.5%) | 20 (23.0%) |
| 16 and 17 Years | 165 (38.9%) | 16 (5.5%) |
| 18 to 24 Years | 53 (6.7%) | 79 (6.9%) |
| 25 to 34 Years | 231 (9.4%) | 248 (11.7%) |
| 35 to 44 Years | 89 (5.3%) | 136 (9.6%) |
| 45 to 54 Years | 119 (7.3%) | 116 (7.3%) |
| 55 to 64 Years | 78 (5.2%) | 214 (13.1%) |
| 65 to 74 Years | 146 (15.1%) | 97 (9.1%) |
| 75 Years and over | 145 (18.4%) | 375 (35.4%) |
| Total | 1,362 (11.0%) | 1,718 (13.3%) |
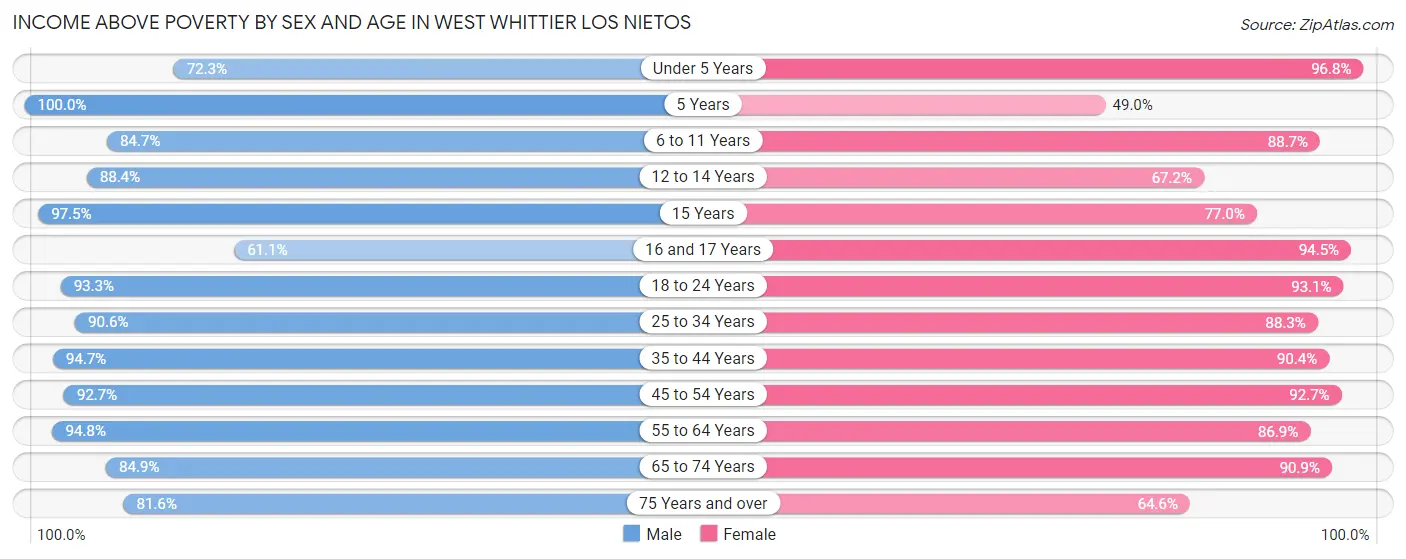
Income Above Poverty by Sex and Age in West Whittier Los Nietos
According to the poverty statistics in West Whittier Los Nietos, males aged 5 years and females aged under 5 years are the age groups that are most secure financially, with 100.0% of males and 96.8% of females in these age groups living above the poverty line.
| Age Bracket | Male | Female |
| Under 5 Years | 350 (72.3%) | 751 (96.8%) |
| 5 Years | 97 (100.0%) | 95 (49.0%) |
| 6 to 11 Years | 869 (84.7%) | 795 (88.7%) |
| 12 to 14 Years | 306 (88.4%) | 393 (67.2%) |
| 15 Years | 192 (97.5%) | 67 (77.0%) |
| 16 and 17 Years | 259 (61.1%) | 275 (94.5%) |
| 18 to 24 Years | 737 (93.3%) | 1,064 (93.1%) |
| 25 to 34 Years | 2,228 (90.6%) | 1,874 (88.3%) |
| 35 to 44 Years | 1,602 (94.7%) | 1,287 (90.4%) |
| 45 to 54 Years | 1,516 (92.7%) | 1,479 (92.7%) |
| 55 to 64 Years | 1,421 (94.8%) | 1,421 (86.9%) |
| 65 to 74 Years | 819 (84.9%) | 973 (90.9%) |
| 75 Years and over | 644 (81.6%) | 684 (64.6%) |
| Total | 11,040 (89.0%) | 11,158 (86.7%) |
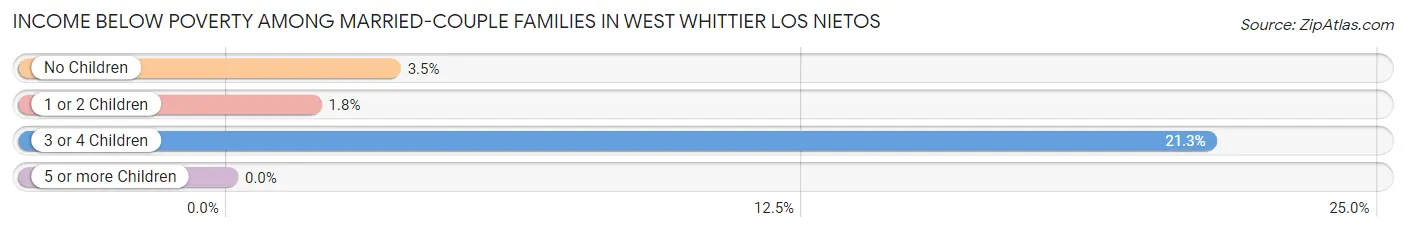
Income Below Poverty Among Married-Couple Families in West Whittier Los Nietos
The poverty statistics for married-couple families in West Whittier Los Nietos show that 4.2% or 167 of the total 3,948 families live below the poverty line. Families with 3 or 4 children have the highest poverty rate of 21.3%, comprising of 65 families. On the other hand, families with 5 or more children have the lowest poverty rate of 0.0%, which includes 0 families.
| Children | Above Poverty | Below Poverty |
| No Children | 2,069 (96.5%) | 76 (3.5%) |
| 1 or 2 Children | 1,405 (98.2%) | 26 (1.8%) |
| 3 or 4 Children | 240 (78.7%) | 65 (21.3%) |
| 5 or more Children | 67 (100.0%) | 0 (0.0%) |
| Total | 3,781 (95.8%) | 167 (4.2%) |
Income Below Poverty Among Single-Parent Households in West Whittier Los Nietos
According to the poverty data in West Whittier Los Nietos, 11.3% or 71 single-father households and 23.6% or 251 single-mother households are living below the poverty line. Among single-father households, those with 3 or 4 children have the highest poverty rate, with 33 households (78.6%) experiencing poverty. Likewise, among single-mother households, those with 5 or more children have the highest poverty rate, with 26 households (100.0%) falling below the poverty line.
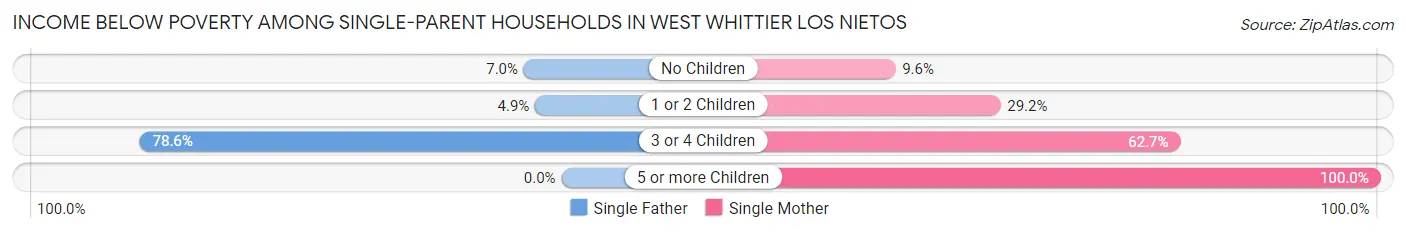
| Children | Single Father | Single Mother |
| No Children | 31 (7.0%) | 48 (9.6%) |
| 1 or 2 Children | 7 (4.9%) | 140 (29.2%) |
| 3 or 4 Children | 33 (78.6%) | 37 (62.7%) |
| 5 or more Children | 0 (0.0%) | 26 (100.0%) |
| Total | 71 (11.3%) | 251 (23.6%) |
Income Below Poverty Among Married-Couple vs Single-Parent Households in West Whittier Los Nietos
The poverty data for West Whittier Los Nietos shows that 167 of the married-couple family households (4.2%) and 322 of the single-parent households (19.0%) are living below the poverty level. Within the married-couple family households, those with 3 or 4 children have the highest poverty rate, with 65 households (21.3%) falling below the poverty line. Among the single-parent households, those with 5 or more children have the highest poverty rate, with 26 household (100.0%) living below poverty.
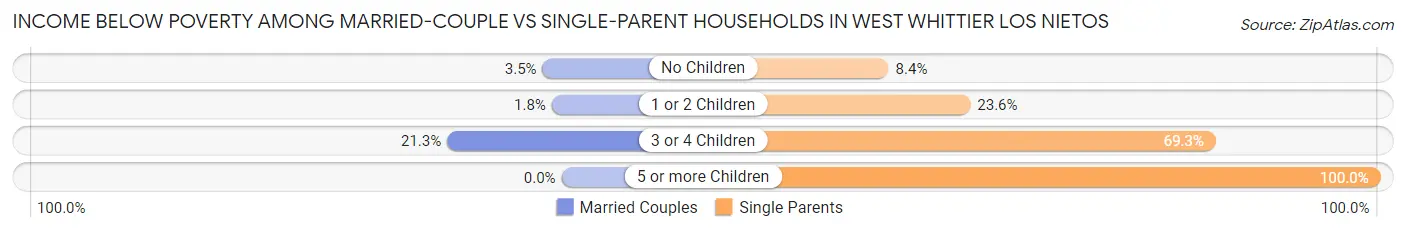
| Children | Married-Couple Families | Single-Parent Households |
| No Children | 76 (3.5%) | 79 (8.4%) |
| 1 or 2 Children | 26 (1.8%) | 147 (23.6%) |
| 3 or 4 Children | 65 (21.3%) | 70 (69.3%) |
| 5 or more Children | 0 (0.0%) | 26 (100.0%) |
| Total | 167 (4.2%) | 322 (19.0%) |
Race in West Whittier Los Nietos
The most populous races in West Whittier Los Nietos are Hispanic or Latino (22,463 | 88.3%), Some other Race (13,828 | 54.3%), and White / Caucasian (6,847 | 26.9%).
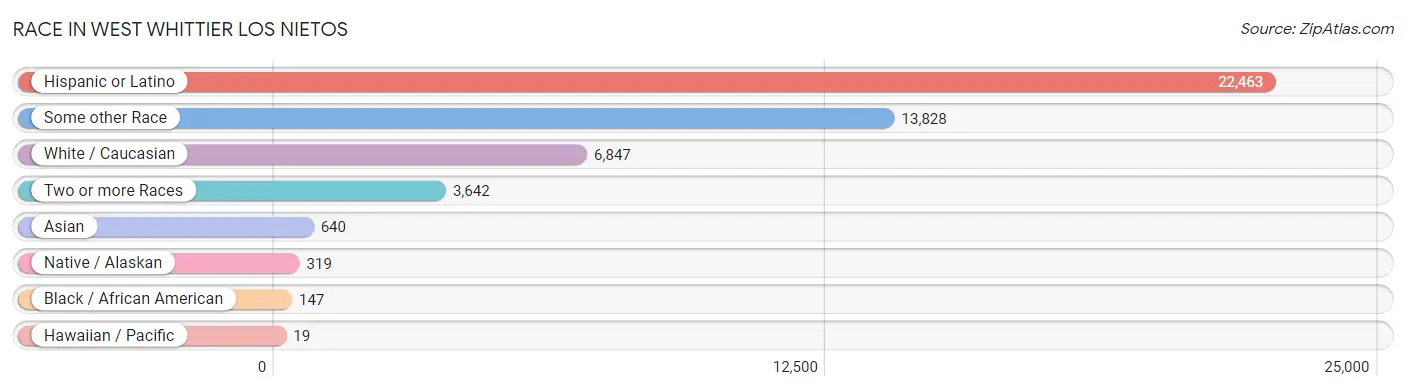
| Race | # Population | % Population |
| Asian | 640 | 2.5% |
| Black / African American | 147 | 0.6% |
| Hawaiian / Pacific | 19 | 0.1% |
| Hispanic or Latino | 22,463 | 88.3% |
| Native / Alaskan | 319 | 1.3% |
| White / Caucasian | 6,847 | 26.9% |
| Two or more Races | 3,642 | 14.3% |
| Some other Race | 13,828 | 54.3% |
| Total | 25,442 | 100.0% |
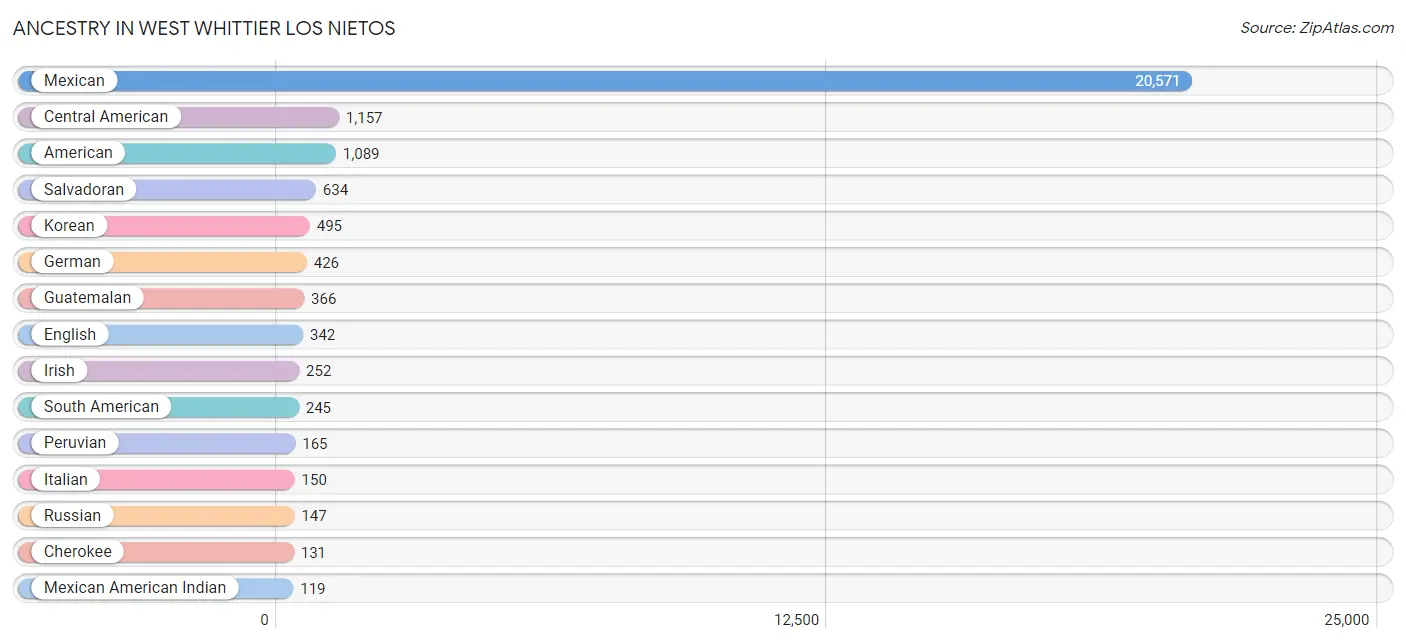
Ancestry in West Whittier Los Nietos
The most populous ancestries reported in West Whittier Los Nietos are Mexican (20,571 | 80.8%), Central American (1,157 | 4.5%), American (1,089 | 4.3%), Salvadoran (634 | 2.5%), and Korean (495 | 1.9%), together accounting for 94.1% of all West Whittier Los Nietos residents.
| Ancestry | # Population | % Population |
| African | 5 | 0.0% |
| American | 1,089 | 4.3% |
| Arab | 34 | 0.1% |
| Armenian | 20 | 0.1% |
| Austrian | 7 | 0.0% |
| Belgian | 14 | 0.1% |
| Bhutanese | 25 | 0.1% |
| Blackfeet | 16 | 0.1% |
| Bolivian | 9 | 0.0% |
| Burmese | 26 | 0.1% |
| Central American | 1,157 | 4.5% |
| Central American Indian | 17 | 0.1% |
| Cherokee | 131 | 0.5% |
| Colombian | 22 | 0.1% |
| Costa Rican | 47 | 0.2% |
| Cuban | 81 | 0.3% |
| Czech | 7 | 0.0% |
| Danish | 9 | 0.0% |
| Dutch | 42 | 0.2% |
| Ecuadorian | 49 | 0.2% |
| English | 342 | 1.3% |
| European | 53 | 0.2% |
| French | 117 | 0.5% |
| French Canadian | 33 | 0.1% |
| German | 426 | 1.7% |
| Guatemalan | 366 | 1.4% |
| Honduran | 61 | 0.2% |
| Hungarian | 19 | 0.1% |
| Indian (Asian) | 76 | 0.3% |
| Irish | 252 | 1.0% |
| Italian | 150 | 0.6% |
| Korean | 495 | 1.9% |
| Latvian | 1 | 0.0% |
| Lebanese | 28 | 0.1% |
| Mexican | 20,571 | 80.8% |
| Mexican American Indian | 119 | 0.5% |
| Moroccan | 6 | 0.0% |
| Native Hawaiian | 11 | 0.0% |
| Navajo | 9 | 0.0% |
| Nicaraguan | 49 | 0.2% |
| Norwegian | 14 | 0.1% |
| Peruvian | 165 | 0.6% |
| Polish | 73 | 0.3% |
| Portuguese | 69 | 0.3% |
| Puerto Rican | 61 | 0.2% |
| Romanian | 5 | 0.0% |
| Russian | 147 | 0.6% |
| Salvadoran | 634 | 2.5% |
| Scandinavian | 16 | 0.1% |
| Scotch-Irish | 8 | 0.0% |
| Scottish | 24 | 0.1% |
| South American | 245 | 1.0% |
| Spaniard | 82 | 0.3% |
| Spanish | 50 | 0.2% |
| Sri Lankan | 74 | 0.3% |
| Subsaharan African | 12 | 0.1% |
| Swedish | 18 | 0.1% |
| Thai | 70 | 0.3% |
| Welsh | 44 | 0.2% | View All 59 Rows |
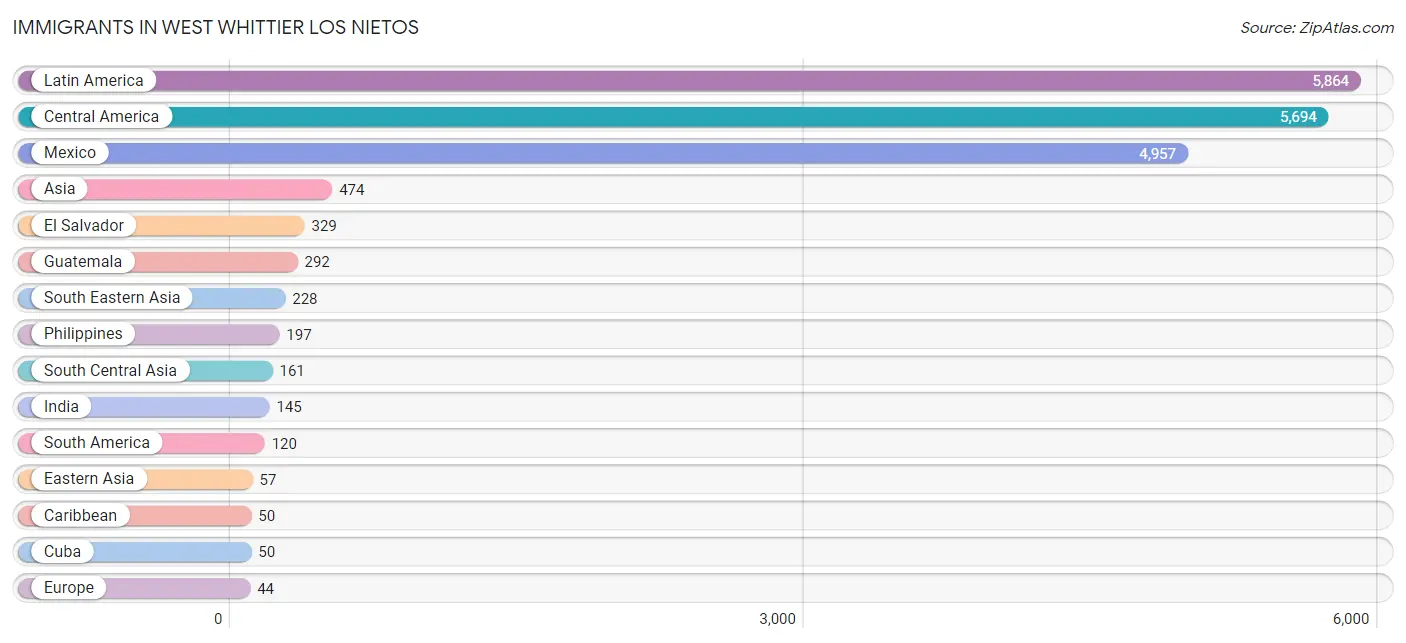
Immigrants in West Whittier Los Nietos
The most numerous immigrant groups reported in West Whittier Los Nietos came from Latin America (5,864 | 23.1%), Central America (5,694 | 22.4%), Mexico (4,957 | 19.5%), Asia (474 | 1.9%), and El Salvador (329 | 1.3%), together accounting for 68.1% of all West Whittier Los Nietos residents.
| Immigration Origin | # Population | % Population |
| Argentina | 2 | 0.0% |
| Asia | 474 | 1.9% |
| Belgium | 5 | 0.0% |
| Bolivia | 9 | 0.0% |
| Canada | 14 | 0.1% |
| Caribbean | 50 | 0.2% |
| Central America | 5,694 | 22.4% |
| China | 37 | 0.2% |
| Colombia | 28 | 0.1% |
| Costa Rica | 37 | 0.2% |
| Cuba | 50 | 0.2% |
| Eastern Asia | 57 | 0.2% |
| Eastern Europe | 37 | 0.2% |
| Ecuador | 36 | 0.1% |
| El Salvador | 329 | 1.3% |
| Europe | 44 | 0.2% |
| Guatemala | 292 | 1.1% |
| Honduras | 37 | 0.2% |
| India | 145 | 0.6% |
| Italy | 2 | 0.0% |
| Japan | 11 | 0.0% |
| Korea | 9 | 0.0% |
| Latin America | 5,864 | 23.1% |
| Lebanon | 28 | 0.1% |
| Mexico | 4,957 | 19.5% |
| Nicaragua | 18 | 0.1% |
| Peru | 24 | 0.1% |
| Philippines | 197 | 0.8% |
| Romania | 5 | 0.0% |
| Russia | 32 | 0.1% |
| South America | 120 | 0.5% |
| South Central Asia | 161 | 0.6% |
| South Eastern Asia | 228 | 0.9% |
| Southern Europe | 2 | 0.0% |
| Sri Lanka | 16 | 0.1% |
| Vietnam | 31 | 0.1% |
| Western Asia | 28 | 0.1% |
| Western Europe | 5 | 0.0% | View All 38 Rows |
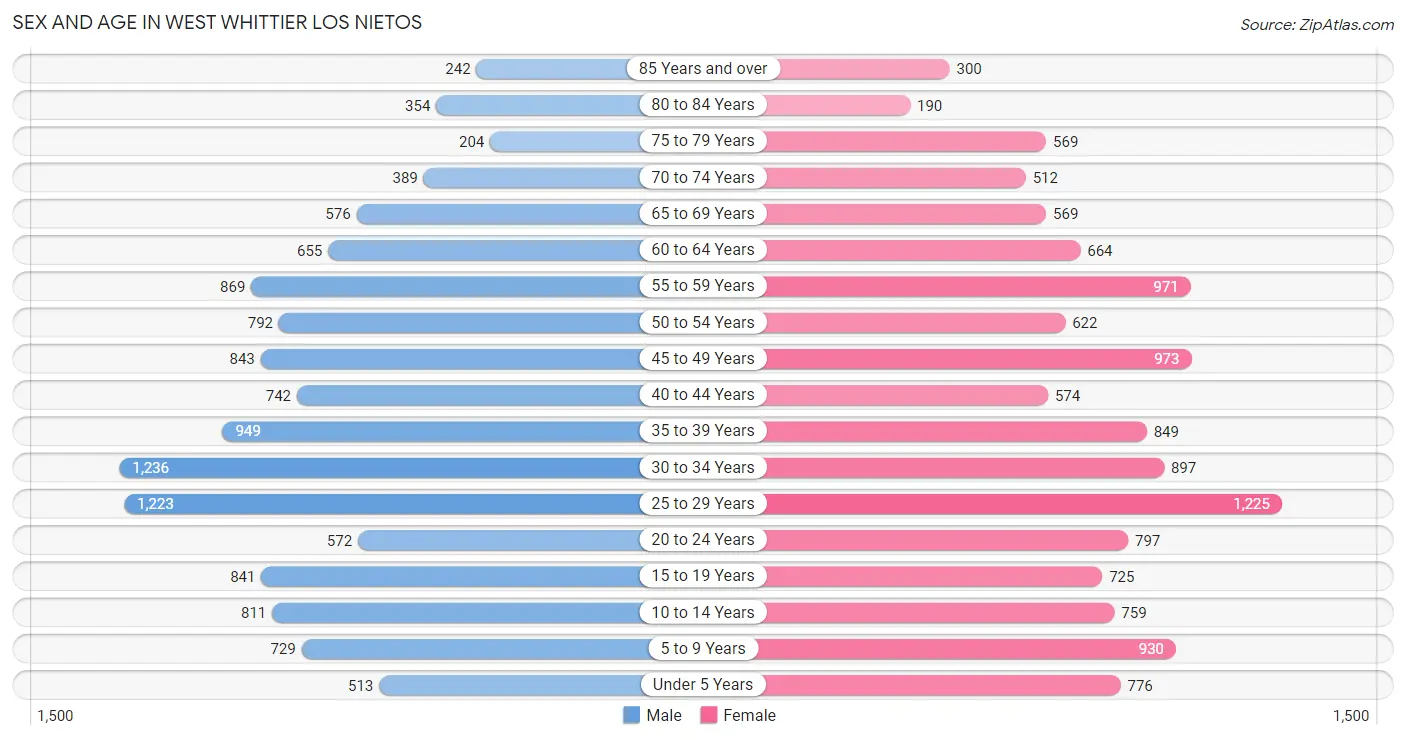
Sex and Age in West Whittier Los Nietos
Sex and Age in West Whittier Los Nietos
The most populous age groups in West Whittier Los Nietos are 30 to 34 Years (1,236 | 9.9%) for men and 25 to 29 Years (1,225 | 9.5%) for women.
| Age Bracket | Male | Female |
| Under 5 Years | 513 (4.1%) | 776 (6.0%) |
| 5 to 9 Years | 729 (5.8%) | 930 (7.2%) |
| 10 to 14 Years | 811 (6.5%) | 759 (5.9%) |
| 15 to 19 Years | 841 (6.7%) | 725 (5.6%) |
| 20 to 24 Years | 572 (4.6%) | 797 (6.2%) |
| 25 to 29 Years | 1,223 (9.8%) | 1,225 (9.5%) |
| 30 to 34 Years | 1,236 (9.9%) | 897 (7.0%) |
| 35 to 39 Years | 949 (7.6%) | 849 (6.6%) |
| 40 to 44 Years | 742 (5.9%) | 574 (4.4%) |
| 45 to 49 Years | 843 (6.7%) | 973 (7.5%) |
| 50 to 54 Years | 792 (6.3%) | 622 (4.8%) |
| 55 to 59 Years | 869 (6.9%) | 971 (7.5%) |
| 60 to 64 Years | 655 (5.2%) | 664 (5.1%) |
| 65 to 69 Years | 576 (4.6%) | 569 (4.4%) |
| 70 to 74 Years | 389 (3.1%) | 512 (4.0%) |
| 75 to 79 Years | 204 (1.6%) | 569 (4.4%) |
| 80 to 84 Years | 354 (2.8%) | 190 (1.5%) |
| 85 Years and over | 242 (1.9%) | 300 (2.3%) |
| Total | 12,540 (100.0%) | 12,902 (100.0%) |
Families and Households in West Whittier Los Nietos
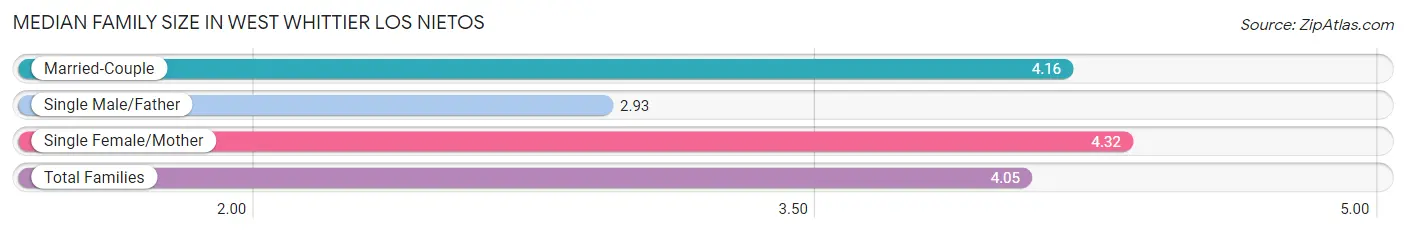
Median Family Size in West Whittier Los Nietos
The median family size in West Whittier Los Nietos is 4.05 persons per family, with single female/mother families (1,065 | 18.9%) accounting for the largest median family size of 4.32 persons per family. On the other hand, single male/father families (628 | 11.1%) represent the smallest median family size with 2.93 persons per family.
| Family Type | # Families | Family Size |
| Married-Couple | 3,948 (70.0%) | 4.16 |
| Single Male/Father | 628 (11.1%) | 2.93 |
| Single Female/Mother | 1,065 (18.9%) | 4.32 |
| Total Families | 5,641 (100.0%) | 4.05 |
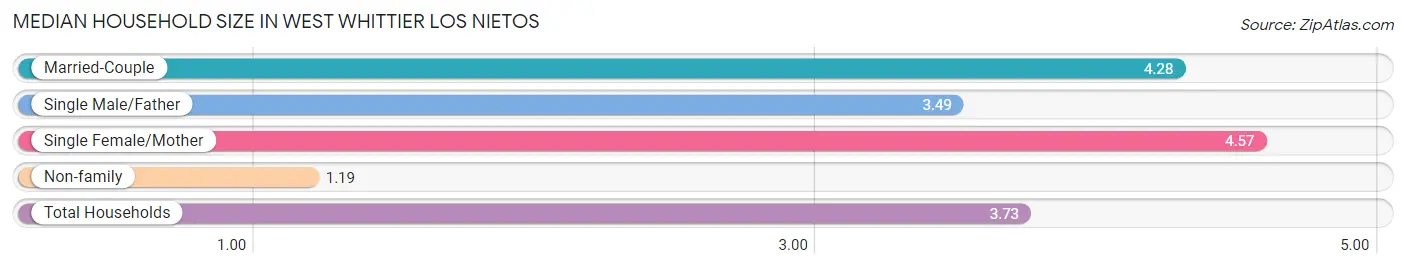
Median Household Size in West Whittier Los Nietos
The median household size in West Whittier Los Nietos is 3.73 persons per household, with single female/mother households (1,065 | 15.7%) accounting for the largest median household size of 4.57 persons per household. non-family households (1,138 | 16.8%) represent the smallest median household size with 1.19 persons per household.
| Household Type | # Households | Household Size |
| Married-Couple | 3,948 (58.2%) | 4.28 |
| Single Male/Father | 628 (9.3%) | 3.49 |
| Single Female/Mother | 1,065 (15.7%) | 4.57 |
| Non-family | 1,138 (16.8%) | 1.19 |
| Total Households | 6,779 (100.0%) | 3.73 |
Household Size by Marriage Status in West Whittier Los Nietos
Out of a total of 6,779 households in West Whittier Los Nietos, 5,641 (83.2%) are family households, while 1,138 (16.8%) are nonfamily households. The most numerous type of family households are 2-person households, comprising 1,487, and the most common type of nonfamily households are 1-person households, comprising 997.
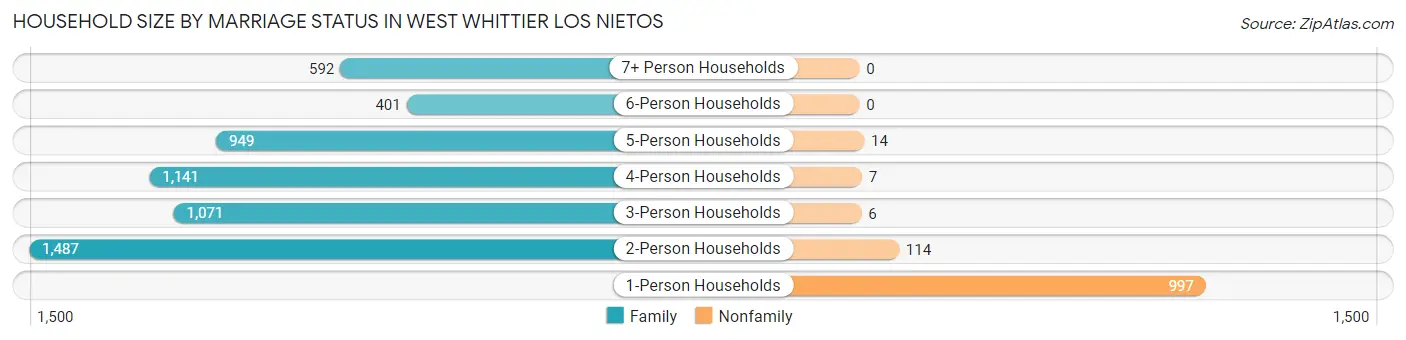
| Household Size | Family Households | Nonfamily Households |
| 1-Person Households | - | 997 (14.7%) |
| 2-Person Households | 1,487 (21.9%) | 114 (1.7%) |
| 3-Person Households | 1,071 (15.8%) | 6 (0.1%) |
| 4-Person Households | 1,141 (16.8%) | 7 (0.1%) |
| 5-Person Households | 949 (14.0%) | 14 (0.2%) |
| 6-Person Households | 401 (5.9%) | 0 (0.0%) |
| 7+ Person Households | 592 (8.7%) | 0 (0.0%) |
| Total | 5,641 (83.2%) | 1,138 (16.8%) |
Female Fertility in West Whittier Los Nietos
Fertility by Age in West Whittier Los Nietos
Average fertility rate in West Whittier Los Nietos is 28.0 births per 1,000 women. Women in the age bracket of 35 to 50 years have the highest fertility rate with 51.0 births per 1,000 women. Women in the age bracket of 35 to 50 years acount for 73.0% of all women with births.
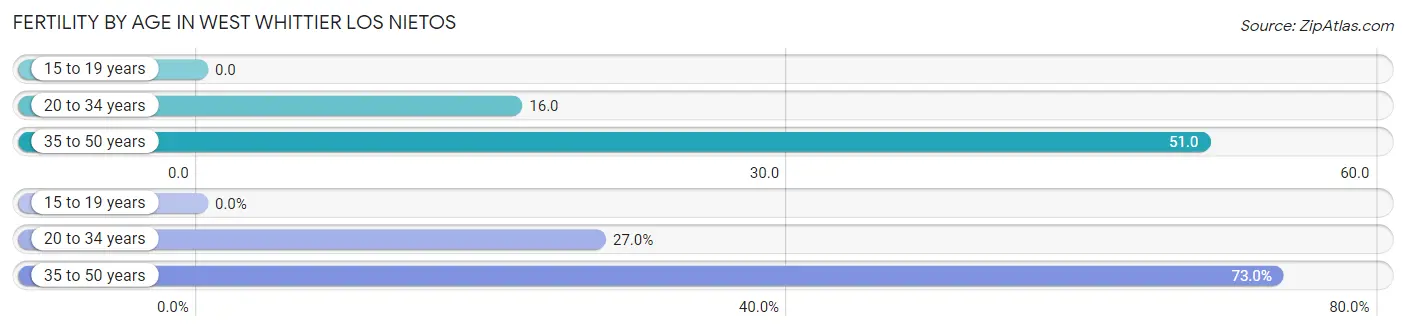
| Age Bracket | Women with Births | Births / 1,000 Women |
| 15 to 19 years | 0 (0.0%) | 0.0 |
| 20 to 34 years | 47 (27.0%) | 16.0 |
| 35 to 50 years | 127 (73.0%) | 51.0 |
| Total | 174 (100.0%) | 28.0 |
Fertility by Age by Marriage Status in West Whittier Los Nietos
59.2% of women with births (174) in West Whittier Los Nietos are married. The highest percentage of unmarried women with births falls into 35 to 50 years age bracket with 45.7% of them unmarried at the time of birth, while the lowest percentage of unmarried women with births belong to 20 to 34 years age bracket with 27.7% of them unmarried.
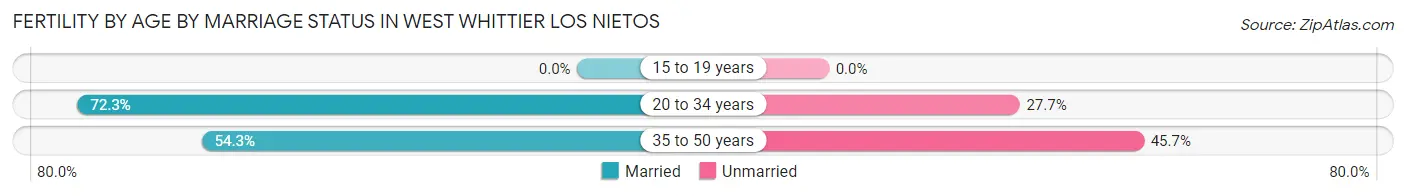
| Age Bracket | Married | Unmarried |
| 15 to 19 years | 0 (0.0%) | 0 (0.0%) |
| 20 to 34 years | 34 (72.3%) | 13 (27.7%) |
| 35 to 50 years | 69 (54.3%) | 58 (45.7%) |
| Total | 103 (59.2%) | 71 (40.8%) |
Fertility by Education in West Whittier Los Nietos
Average fertility rate in West Whittier Los Nietos is 28.0 births per 1,000 women. Women with the education attainment of graduate degree have the highest fertility rate of 97.0 births per 1,000 women, while women with the education attainment of less than high school have the lowest fertility at 5.0 births per 1,000 women. Women with the education attainment of bachelor's degree represent 31.6% of all women with births.
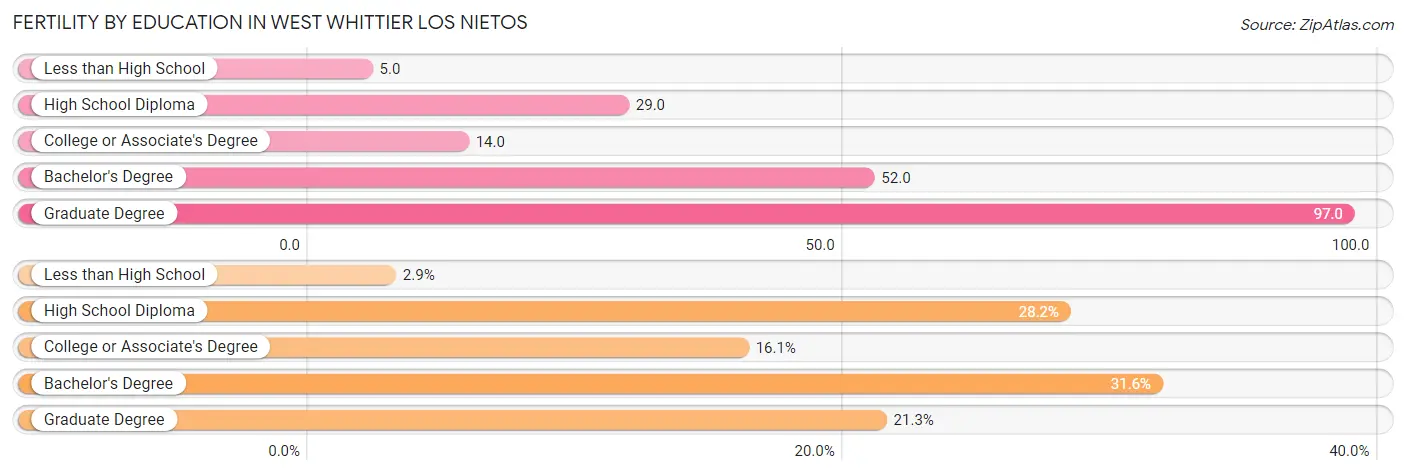
| Educational Attainment | Women with Births | Births / 1,000 Women |
| Less than High School | 5 (2.9%) | 5.0 |
| High School Diploma | 49 (28.2%) | 29.0 |
| College or Associate's Degree | 28 (16.1%) | 14.0 |
| Bachelor's Degree | 55 (31.6%) | 52.0 |
| Graduate Degree | 37 (21.3%) | 97.0 |
| Total | 174 (100.0%) | 28.0 |
Fertility by Education by Marriage Status in West Whittier Los Nietos
40.8% of women with births in West Whittier Los Nietos are unmarried. Women with the educational attainment of less than high school are most likely to be married with 100.0% of them married at childbirth, while women with the educational attainment of bachelor's degree are least likely to be married with 76.4% of them unmarried at childbirth.
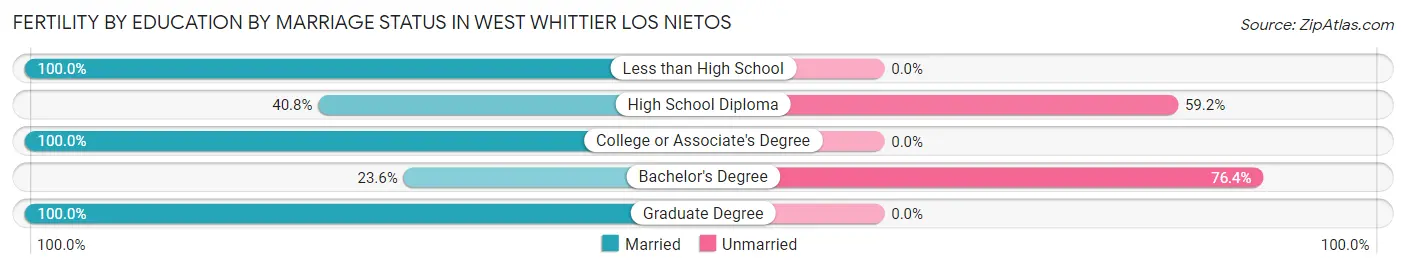
| Educational Attainment | Married | Unmarried |
| Less than High School | 5 (100.0%) | 0 (0.0%) |
| High School Diploma | 20 (40.8%) | 29 (59.2%) |
| College or Associate's Degree | 28 (100.0%) | 0 (0.0%) |
| Bachelor's Degree | 13 (23.6%) | 42 (76.4%) |
| Graduate Degree | 37 (100.0%) | 0 (0.0%) |
| Total | 103 (59.2%) | 71 (40.8%) |
Employment Characteristics in West Whittier Los Nietos
Employment by Class of Employer in West Whittier Los Nietos
Among the 11,214 employed individuals in West Whittier Los Nietos, private company employees (7,792 | 69.5%), local government employees (1,148 | 10.2%), and not-for-profit organizations (626 | 5.6%) make up the most common classes of employment.
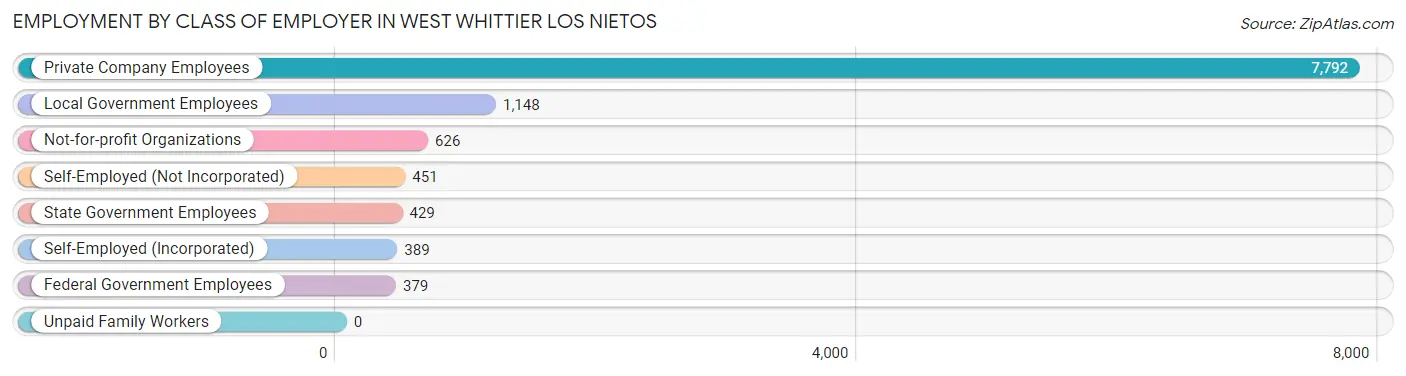
| Employer Class | # Employees | % Employees |
| Private Company Employees | 7,792 | 69.5% |
| Self-Employed (Incorporated) | 389 | 3.5% |
| Self-Employed (Not Incorporated) | 451 | 4.0% |
| Not-for-profit Organizations | 626 | 5.6% |
| Local Government Employees | 1,148 | 10.2% |
| State Government Employees | 429 | 3.8% |
| Federal Government Employees | 379 | 3.4% |
| Unpaid Family Workers | 0 | 0.0% |
| Total | 11,214 | 100.0% |
Employment Status by Age in West Whittier Los Nietos
According to the labor force statistics for West Whittier Los Nietos, out of the total population over 16 years of age (20,640), 57.9% or 11,951 individuals are in the labor force, with 3.9% or 466 of them unemployed. The age group with the highest labor force participation rate is 35 to 44 years, with 84.3% or 2,625 individuals in the labor force. Within the labor force, the 75 years and over age range has the highest percentage of unemployed individuals, with 20.9% or 9 of them being unemployed.
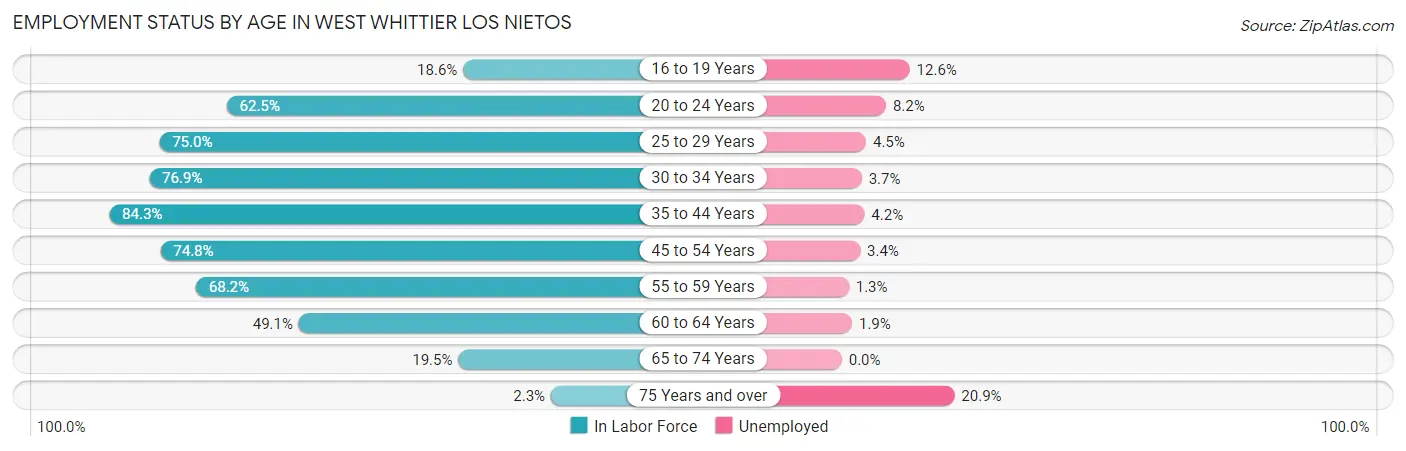
| Age Bracket | In Labor Force | Unemployed |
| 16 to 19 Years | 238 (18.6%) | 30 (12.6%) |
| 20 to 24 Years | 856 (62.5%) | 70 (8.2%) |
| 25 to 29 Years | 1,836 (75.0%) | 83 (4.5%) |
| 30 to 34 Years | 1,640 (76.9%) | 61 (3.7%) |
| 35 to 44 Years | 2,625 (84.3%) | 110 (4.2%) |
| 45 to 54 Years | 2,416 (74.8%) | 82 (3.4%) |
| 55 to 59 Years | 1,255 (68.2%) | 16 (1.3%) |
| 60 to 64 Years | 648 (49.1%) | 12 (1.9%) |
| 65 to 74 Years | 399 (19.5%) | 0 (0.0%) |
| 75 Years and over | 43 (2.3%) | 9 (20.9%) |
| Total | 11,951 (57.9%) | 466 (3.9%) |
Employment Status by Educational Attainment in West Whittier Los Nietos
According to labor force statistics for West Whittier Los Nietos, 74.0% of individuals (10,422) out of the total population between 25 and 64 years of age (14,084) are in the labor force, with 3.5% or 365 of them being unemployed. The group with the highest labor force participation rate are those with the educational attainment of bachelor's degree or higher, with 88.7% or 2,301 individuals in the labor force. Within the labor force, individuals with high school diploma education have the highest percentage of unemployment, with 5.4% or 163 of them being unemployed.
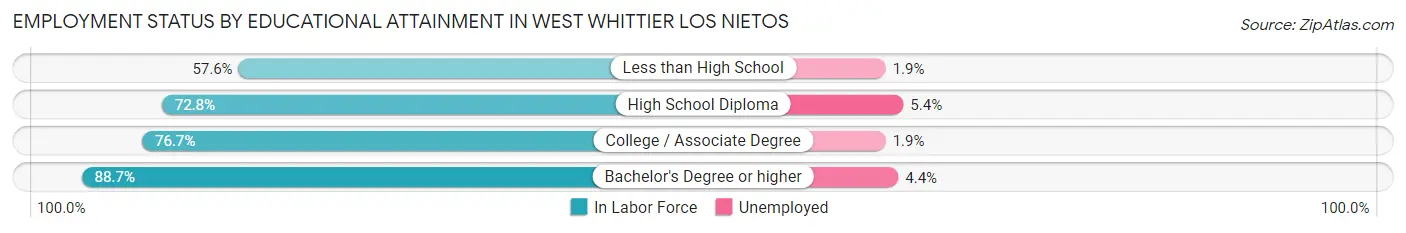
| Educational Attainment | In Labor Force | Unemployed |
| Less than High School | 1,608 (57.6%) | 53 (1.9%) |
| High School Diploma | 3,017 (72.8%) | 224 (5.4%) |
| College / Associate Degree | 3,494 (76.7%) | 87 (1.9%) |
| Bachelor's Degree or higher | 2,301 (88.7%) | 114 (4.4%) |
| Total | 10,422 (74.0%) | 493 (3.5%) |
Employment Occupations by Sex in West Whittier Los Nietos
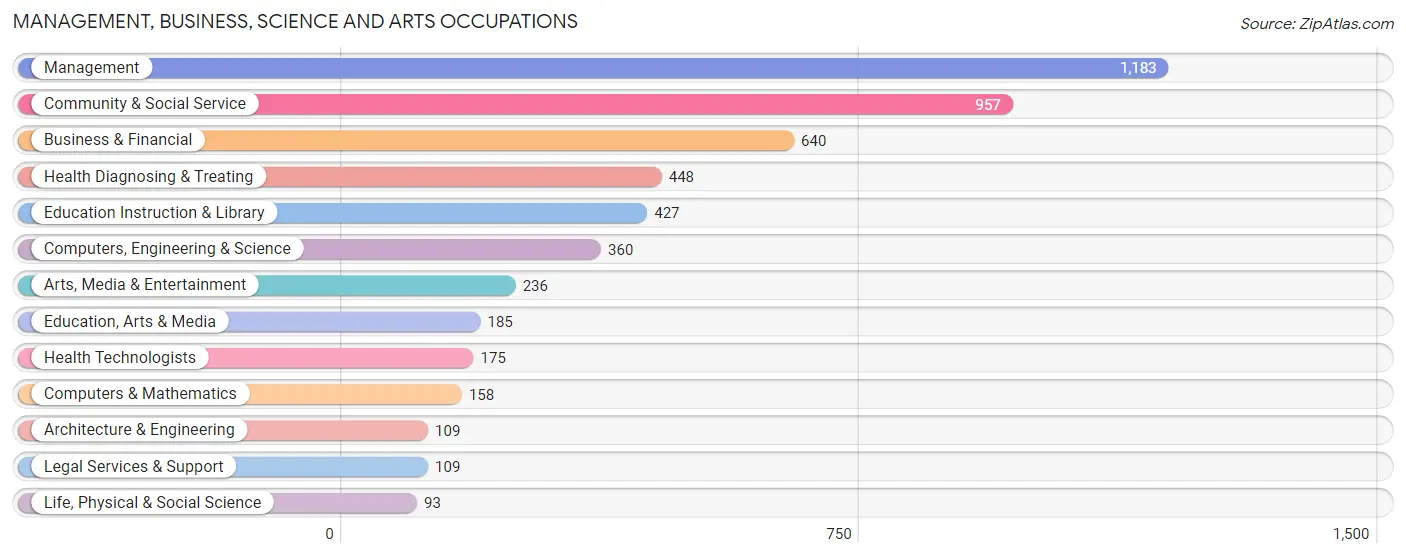
Management, Business, Science and Arts Occupations
The most common Management, Business, Science and Arts occupations in West Whittier Los Nietos are Management (1,183 | 10.3%), Community & Social Service (957 | 8.3%), Business & Financial (640 | 5.6%), Health Diagnosing & Treating (448 | 3.9%), and Education Instruction & Library (427 | 3.7%).
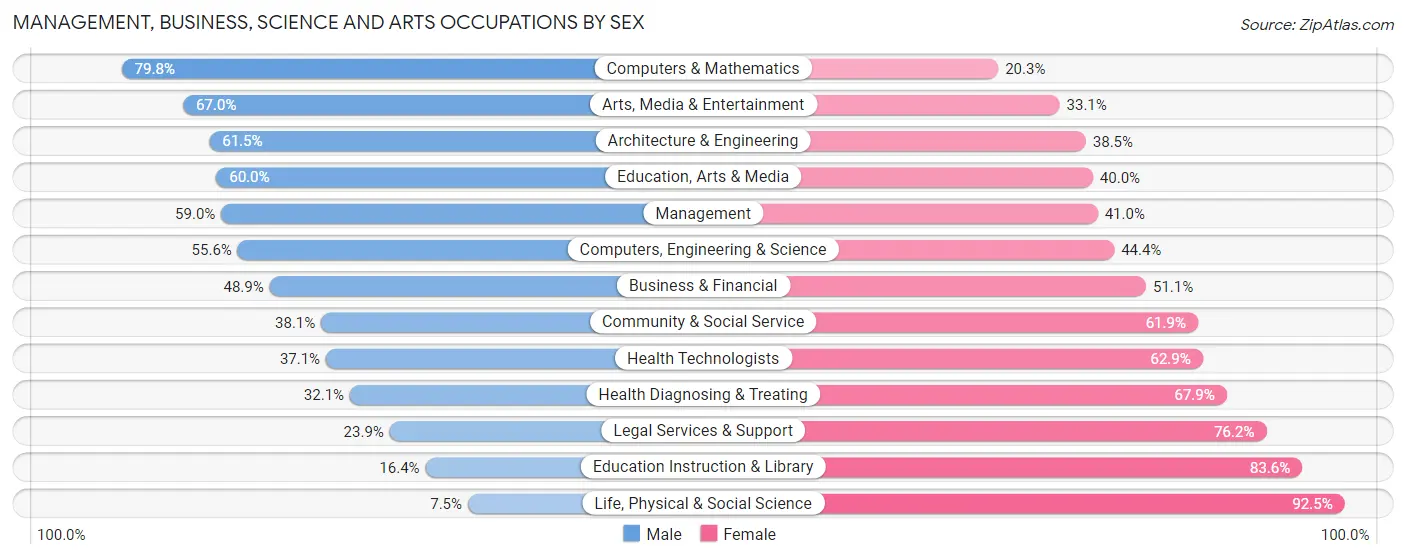
Management, Business, Science and Arts Occupations by Sex
Within the Management, Business, Science and Arts occupations in West Whittier Los Nietos, the most male-oriented occupations are Computers & Mathematics (79.7%), Arts, Media & Entertainment (66.9%), and Architecture & Engineering (61.5%), while the most female-oriented occupations are Life, Physical & Social Science (92.5%), Education Instruction & Library (83.6%), and Legal Services & Support (76.1%).
| Occupation | Male | Female |
| Management | 698 (59.0%) | 485 (41.0%) |
| Business & Financial | 313 (48.9%) | 327 (51.1%) |
| Computers, Engineering & Science | 200 (55.6%) | 160 (44.4%) |
| Computers & Mathematics | 126 (79.7%) | 32 (20.3%) |
| Architecture & Engineering | 67 (61.5%) | 42 (38.5%) |
| Life, Physical & Social Science | 7 (7.5%) | 86 (92.5%) |
| Community & Social Service | 365 (38.1%) | 592 (61.9%) |
| Education, Arts & Media | 111 (60.0%) | 74 (40.0%) |
| Legal Services & Support | 26 (23.8%) | 83 (76.1%) |
| Education Instruction & Library | 70 (16.4%) | 357 (83.6%) |
| Arts, Media & Entertainment | 158 (66.9%) | 78 (33.1%) |
| Health Diagnosing & Treating | 144 (32.1%) | 304 (67.9%) |
| Health Technologists | 65 (37.1%) | 110 (62.9%) |
| Total (Category) | 1,720 (47.9%) | 1,868 (52.1%) |
| Total (Overall) | 6,243 (54.4%) | 5,240 (45.6%) |
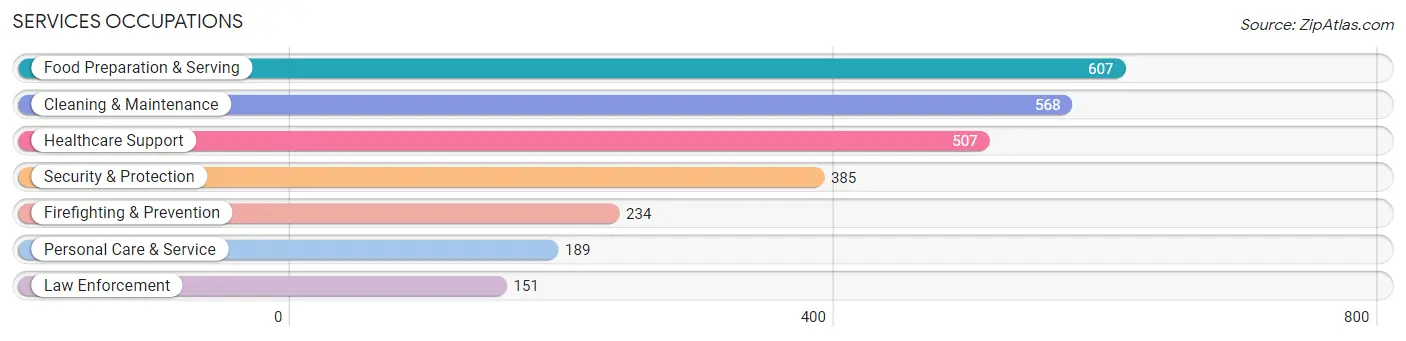
Services Occupations
The most common Services occupations in West Whittier Los Nietos are Food Preparation & Serving (607 | 5.3%), Cleaning & Maintenance (568 | 5.0%), Healthcare Support (507 | 4.4%), Security & Protection (385 | 3.4%), and Firefighting & Prevention (234 | 2.0%).
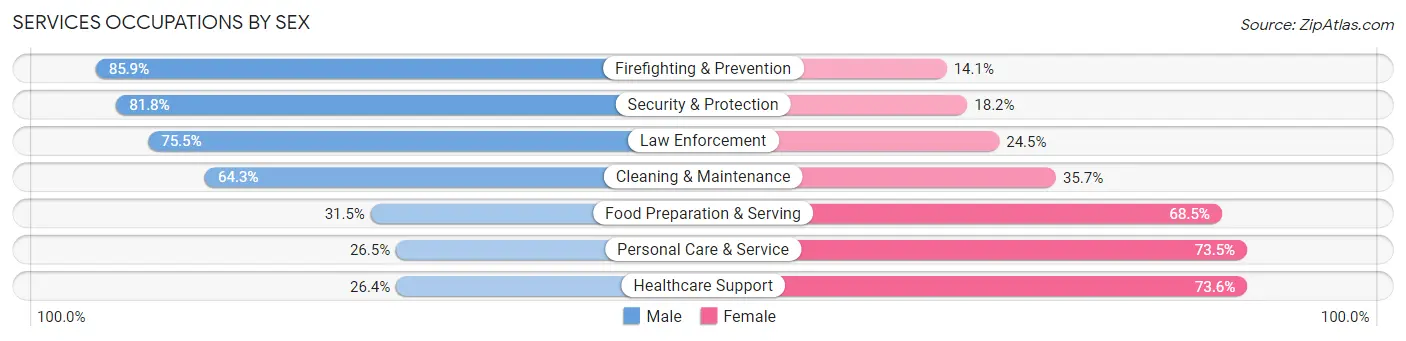
Services Occupations by Sex
Within the Services occupations in West Whittier Los Nietos, the most male-oriented occupations are Firefighting & Prevention (85.9%), Security & Protection (81.8%), and Law Enforcement (75.5%), while the most female-oriented occupations are Healthcare Support (73.6%), Personal Care & Service (73.5%), and Food Preparation & Serving (68.5%).
| Occupation | Male | Female |
| Healthcare Support | 134 (26.4%) | 373 (73.6%) |
| Security & Protection | 315 (81.8%) | 70 (18.2%) |
| Firefighting & Prevention | 201 (85.9%) | 33 (14.1%) |
| Law Enforcement | 114 (75.5%) | 37 (24.5%) |
| Food Preparation & Serving | 191 (31.5%) | 416 (68.5%) |
| Cleaning & Maintenance | 365 (64.3%) | 203 (35.7%) |
| Personal Care & Service | 50 (26.5%) | 139 (73.5%) |
| Total (Category) | 1,055 (46.8%) | 1,201 (53.2%) |
| Total (Overall) | 6,243 (54.4%) | 5,240 (45.6%) |
Sales and Office Occupations
The most common Sales and Office occupations in West Whittier Los Nietos are Office & Administration (1,531 | 13.3%), and Sales & Related (1,085 | 9.5%).
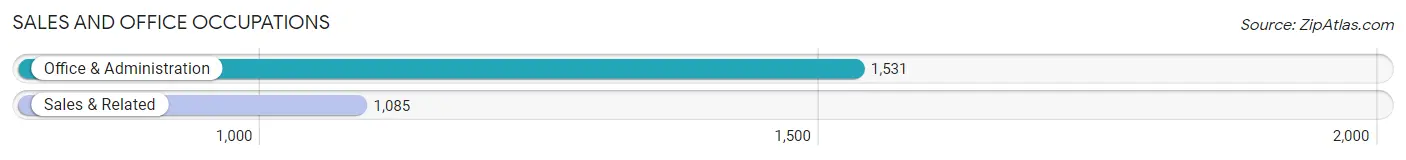
Sales and Office Occupations by Sex
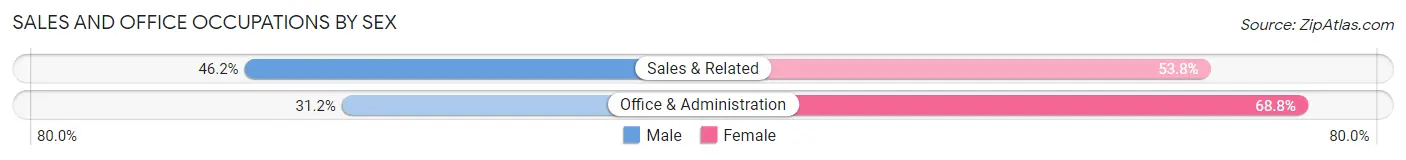
| Occupation | Male | Female |
| Sales & Related | 501 (46.2%) | 584 (53.8%) |
| Office & Administration | 478 (31.2%) | 1,053 (68.8%) |
| Total (Category) | 979 (37.4%) | 1,637 (62.6%) |
| Total (Overall) | 6,243 (54.4%) | 5,240 (45.6%) |
Natural Resources, Construction and Maintenance Occupations
The most common Natural Resources, Construction and Maintenance occupations in West Whittier Los Nietos are Installation, Maintenance & Repair (487 | 4.2%), and Construction & Extraction (449 | 3.9%).
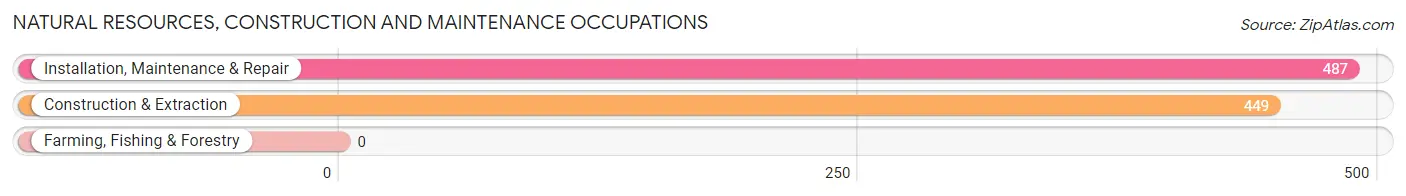
Natural Resources, Construction and Maintenance Occupations by Sex
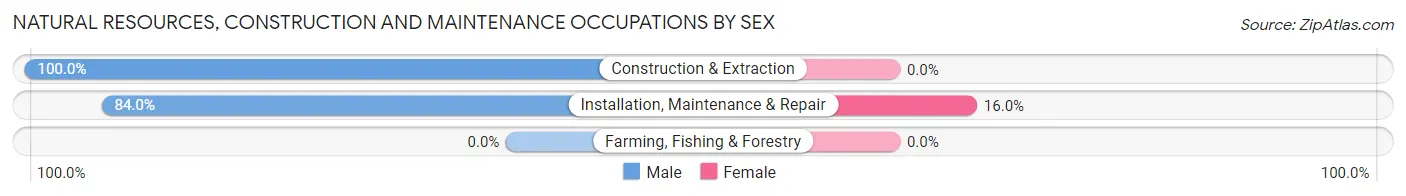
| Occupation | Male | Female |
| Farming, Fishing & Forestry | 0 (0.0%) | 0 (0.0%) |
| Construction & Extraction | 449 (100.0%) | 0 (0.0%) |
| Installation, Maintenance & Repair | 409 (84.0%) | 78 (16.0%) |
| Total (Category) | 858 (91.7%) | 78 (8.3%) |
| Total (Overall) | 6,243 (54.4%) | 5,240 (45.6%) |
Production, Transportation and Moving Occupations
The most common Production, Transportation and Moving occupations in West Whittier Los Nietos are Production (1,013 | 8.8%), Material Moving (648 | 5.6%), and Transportation (426 | 3.7%).
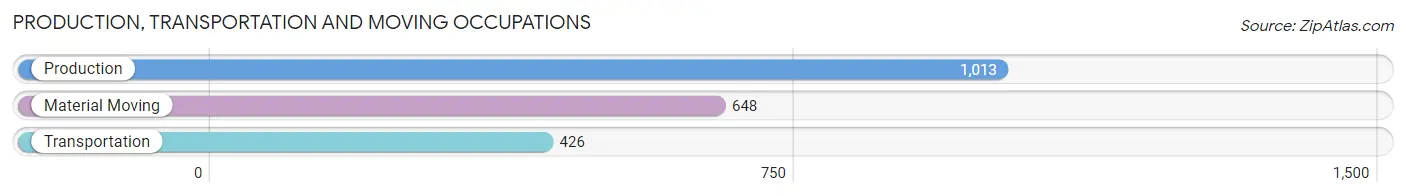
Production, Transportation and Moving Occupations by Sex
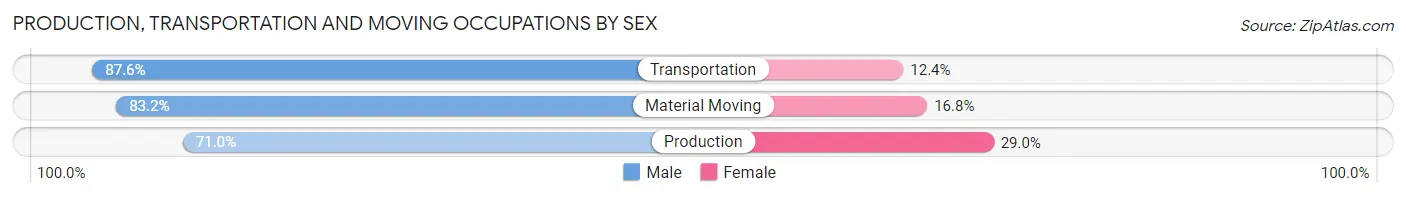
| Occupation | Male | Female |
| Production | 719 (71.0%) | 294 (29.0%) |
| Transportation | 373 (87.6%) | 53 (12.4%) |
| Material Moving | 539 (83.2%) | 109 (16.8%) |
| Total (Category) | 1,631 (78.1%) | 456 (21.8%) |
| Total (Overall) | 6,243 (54.4%) | 5,240 (45.6%) |
Employment Industries by Sex in West Whittier Los Nietos
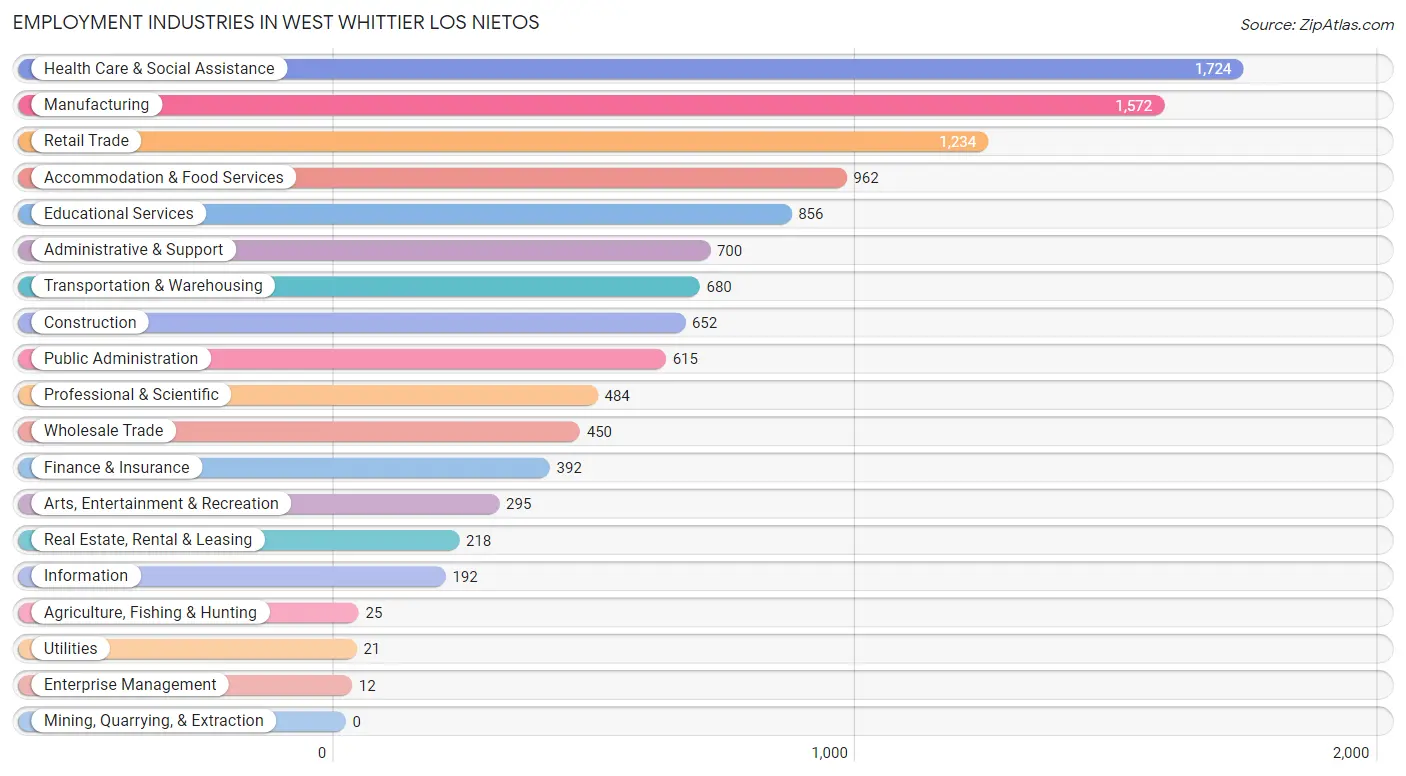
Employment Industries in West Whittier Los Nietos
The major employment industries in West Whittier Los Nietos include Health Care & Social Assistance (1,724 | 15.0%), Manufacturing (1,572 | 13.7%), Retail Trade (1,234 | 10.7%), Accommodation & Food Services (962 | 8.4%), and Educational Services (856 | 7.4%).
Employment Industries by Sex in West Whittier Los Nietos
The West Whittier Los Nietos industries that see more men than women are Agriculture, Fishing & Hunting (100.0%), Utilities (100.0%), and Construction (93.2%), whereas the industries that tend to have a higher number of women are Enterprise Management (100.0%), Health Care & Social Assistance (72.0%), and Finance & Insurance (71.9%).
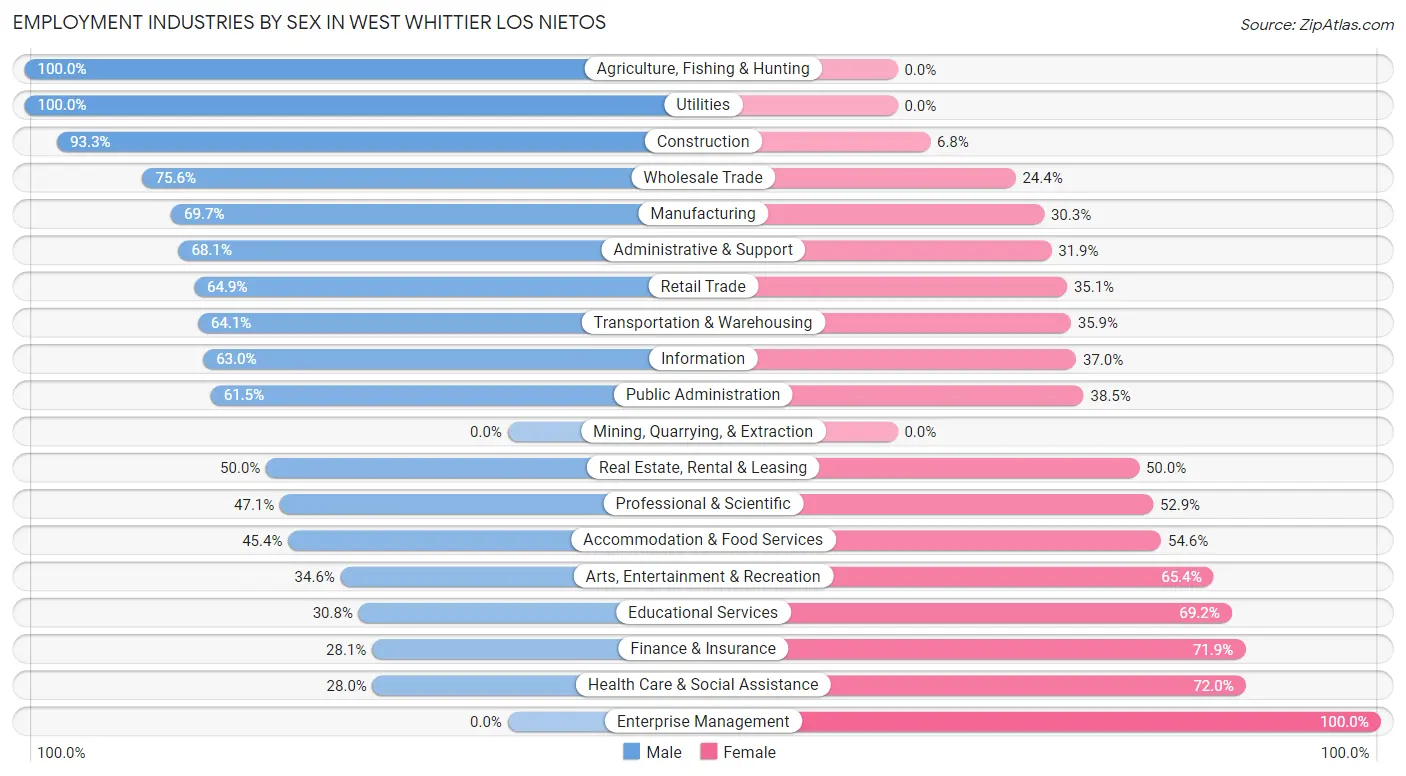
| Industry | Male | Female |
| Agriculture, Fishing & Hunting | 25 (100.0%) | 0 (0.0%) |
| Mining, Quarrying, & Extraction | 0 (0.0%) | 0 (0.0%) |
| Construction | 608 (93.2%) | 44 (6.8%) |
| Manufacturing | 1,095 (69.7%) | 477 (30.3%) |
| Wholesale Trade | 340 (75.6%) | 110 (24.4%) |
| Retail Trade | 801 (64.9%) | 433 (35.1%) |
| Transportation & Warehousing | 436 (64.1%) | 244 (35.9%) |
| Utilities | 21 (100.0%) | 0 (0.0%) |
| Information | 121 (63.0%) | 71 (37.0%) |
| Finance & Insurance | 110 (28.1%) | 282 (71.9%) |
| Real Estate, Rental & Leasing | 109 (50.0%) | 109 (50.0%) |
| Professional & Scientific | 228 (47.1%) | 256 (52.9%) |
| Enterprise Management | 0 (0.0%) | 12 (100.0%) |
| Administrative & Support | 477 (68.1%) | 223 (31.9%) |
| Educational Services | 264 (30.8%) | 592 (69.2%) |
| Health Care & Social Assistance | 482 (28.0%) | 1,242 (72.0%) |
| Arts, Entertainment & Recreation | 102 (34.6%) | 193 (65.4%) |
| Accommodation & Food Services | 437 (45.4%) | 525 (54.6%) |
| Public Administration | 378 (61.5%) | 237 (38.5%) |
| Total | 6,243 (54.4%) | 5,240 (45.6%) |
Education in West Whittier Los Nietos
School Enrollment in West Whittier Los Nietos
The most common levels of schooling among the 6,233 students in West Whittier Los Nietos are college / undergraduate (1,810 | 29.0%), high school (1,406 | 22.6%), and elementary school (1,144 | 18.3%).
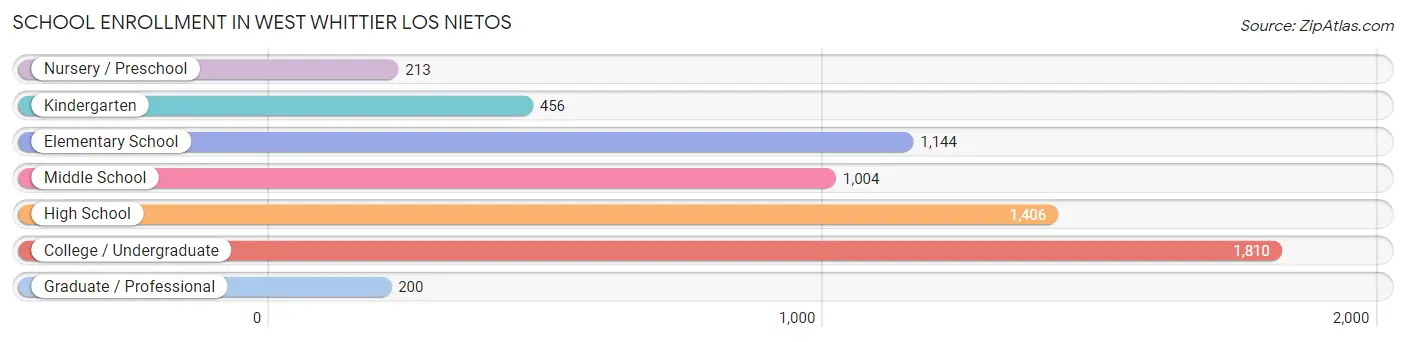
| School Level | # Students | % Students |
| Nursery / Preschool | 213 | 3.4% |
| Kindergarten | 456 | 7.3% |
| Elementary School | 1,144 | 18.3% |
| Middle School | 1,004 | 16.1% |
| High School | 1,406 | 22.6% |
| College / Undergraduate | 1,810 | 29.0% |
| Graduate / Professional | 200 | 3.2% |
| Total | 6,233 | 100.0% |
School Enrollment by Age by Funding Source in West Whittier Los Nietos
Out of a total of 6,233 students who are enrolled in schools in West Whittier Los Nietos, 879 (14.1%) attend a private institution, while the remaining 5,354 (85.9%) are enrolled in public schools. The age group of 25 to 34 year olds has the highest likelihood of being enrolled in private schools, with 365 (48.6% in the age bracket) enrolled. Conversely, the age group of 15 to 17 year olds has the lowest likelihood of being enrolled in a private school, with 901 (99.9% in the age bracket) attending a public institution.
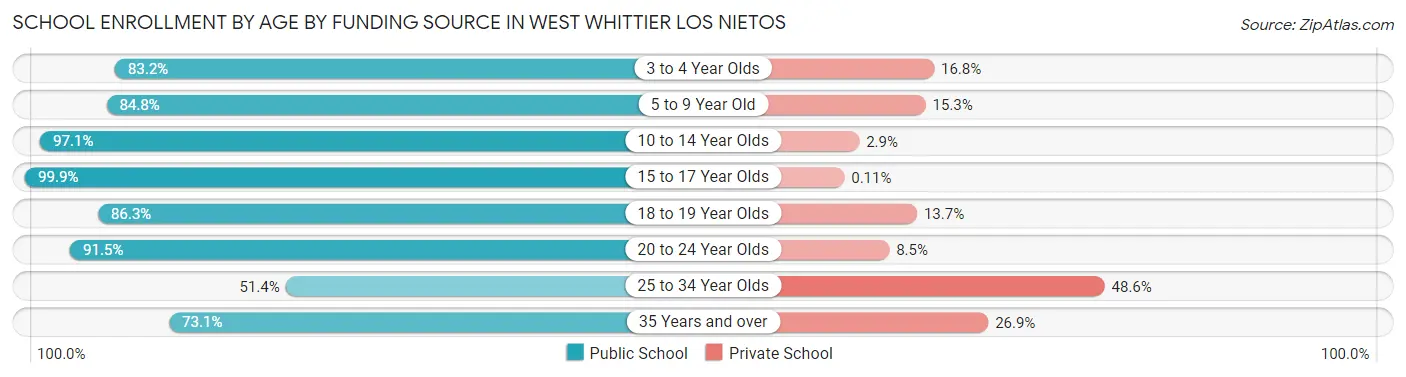
| Age Bracket | Public School | Private School |
| 3 to 4 Year Olds | 173 (83.2%) | 35 (16.8%) |
| 5 to 9 Year Old | 1,300 (84.8%) | 234 (15.2%) |
| 10 to 14 Year Olds | 1,345 (97.1%) | 40 (2.9%) |
| 15 to 17 Year Olds | 901 (99.9%) | 1 (0.1%) |
| 18 to 19 Year Olds | 354 (86.3%) | 56 (13.7%) |
| 20 to 24 Year Olds | 669 (91.5%) | 62 (8.5%) |
| 25 to 34 Year Olds | 386 (51.4%) | 365 (48.6%) |
| 35 Years and over | 228 (73.1%) | 84 (26.9%) |
| Total | 5,354 (85.9%) | 879 (14.1%) |
Educational Attainment by Field of Study in West Whittier Los Nietos
Business (709 | 22.2%), social sciences (317 | 9.9%), education (288 | 9.0%), arts & humanities (287 | 9.0%), and science & technology (239 | 7.5%) are the most common fields of study among 3,192 individuals in West Whittier Los Nietos who have obtained a bachelor's degree or higher.
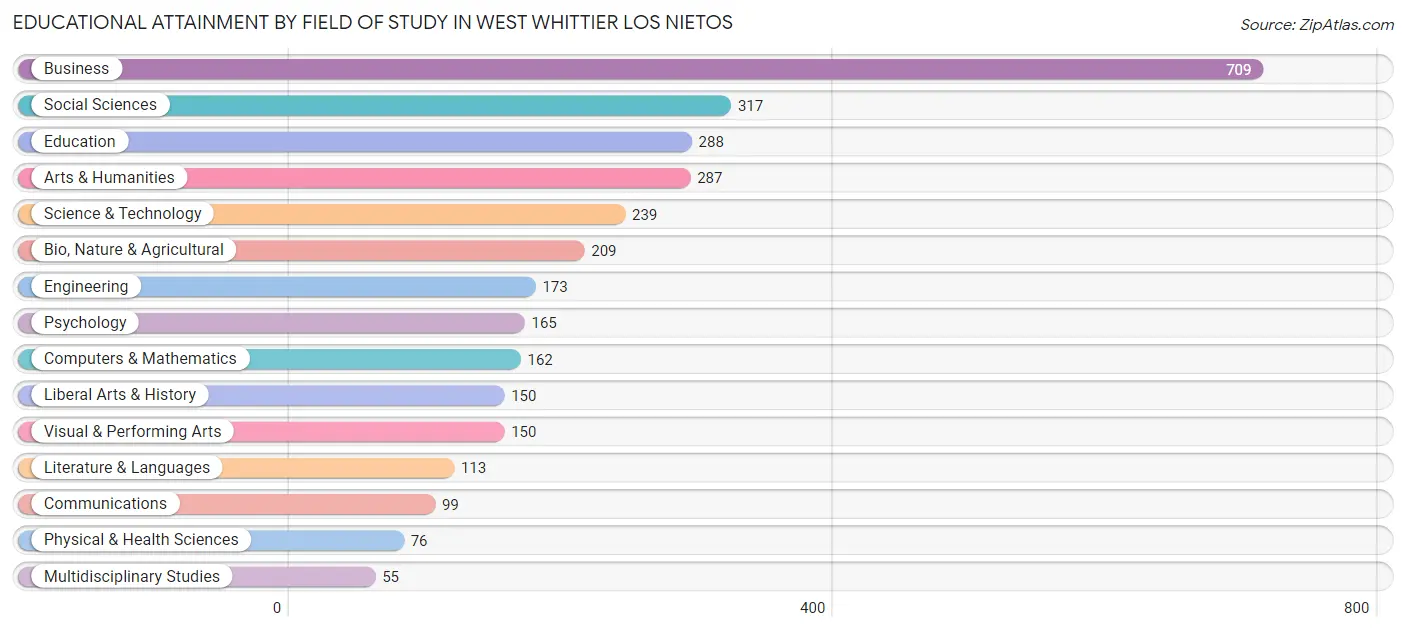
| Field of Study | # Graduates | % Graduates |
| Computers & Mathematics | 162 | 5.1% |
| Bio, Nature & Agricultural | 209 | 6.6% |
| Physical & Health Sciences | 76 | 2.4% |
| Psychology | 165 | 5.2% |
| Social Sciences | 317 | 9.9% |
| Engineering | 173 | 5.4% |
| Multidisciplinary Studies | 55 | 1.7% |
| Science & Technology | 239 | 7.5% |
| Business | 709 | 22.2% |
| Education | 288 | 9.0% |
| Literature & Languages | 113 | 3.5% |
| Liberal Arts & History | 150 | 4.7% |
| Visual & Performing Arts | 150 | 4.7% |
| Communications | 99 | 3.1% |
| Arts & Humanities | 287 | 9.0% |
| Total | 3,192 | 100.0% |
Transportation & Commute in West Whittier Los Nietos
Vehicle Availability by Sex in West Whittier Los Nietos
The most prevalent vehicle ownership categories in West Whittier Los Nietos are males with 3 vehicles (1,917, accounting for 31.1%) and females with 3 vehicles (1,273, making up 38.1%).
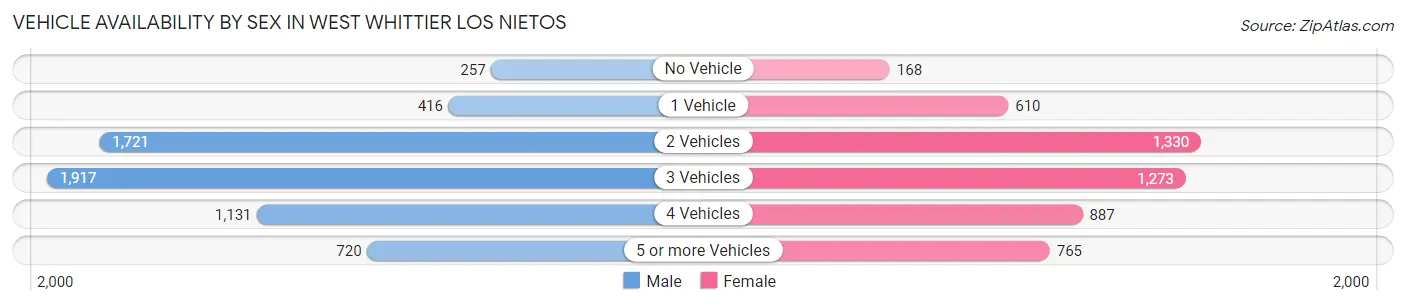
| Vehicles Available | Male | Female |
| No Vehicle | 257 (4.2%) | 168 (3.3%) |
| 1 Vehicle | 416 (6.8%) | 610 (12.1%) |
| 2 Vehicles | 1,721 (27.9%) | 1,330 (26.4%) |
| 3 Vehicles | 1,917 (31.1%) | 1,273 (25.3%) |
| 4 Vehicles | 1,131 (18.3%) | 887 (17.6%) |
| 5 or more Vehicles | 720 (11.7%) | 765 (15.2%) |
| Total | 6,162 (100.0%) | 5,033 (100.0%) |
Commute Time in West Whittier Los Nietos
The most frequently occuring commute durations in West Whittier Los Nietos are 30 to 34 minutes (2,155 commuters, 21.3%), 20 to 24 minutes (1,213 commuters, 12.0%), and 15 to 19 minutes (1,080 commuters, 10.7%).
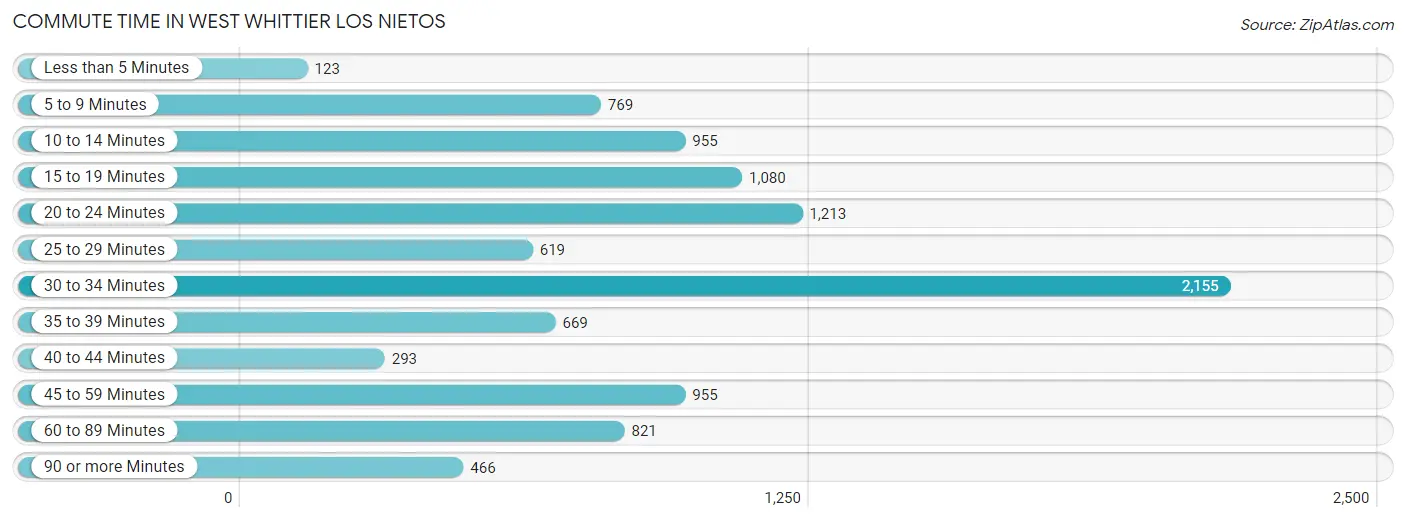
| Commute Time | # Commuters | % Commuters |
| Less than 5 Minutes | 123 | 1.2% |
| 5 to 9 Minutes | 769 | 7.6% |
| 10 to 14 Minutes | 955 | 9.4% |
| 15 to 19 Minutes | 1,080 | 10.7% |
| 20 to 24 Minutes | 1,213 | 12.0% |
| 25 to 29 Minutes | 619 | 6.1% |
| 30 to 34 Minutes | 2,155 | 21.3% |
| 35 to 39 Minutes | 669 | 6.6% |
| 40 to 44 Minutes | 293 | 2.9% |
| 45 to 59 Minutes | 955 | 9.4% |
| 60 to 89 Minutes | 821 | 8.1% |
| 90 or more Minutes | 466 | 4.6% |
Commute Time by Sex in West Whittier Los Nietos
The most common commute times in West Whittier Los Nietos are 30 to 34 minutes (1,165 commuters, 20.9%) for males and 30 to 34 minutes (990 commuters, 21.8%) for females.
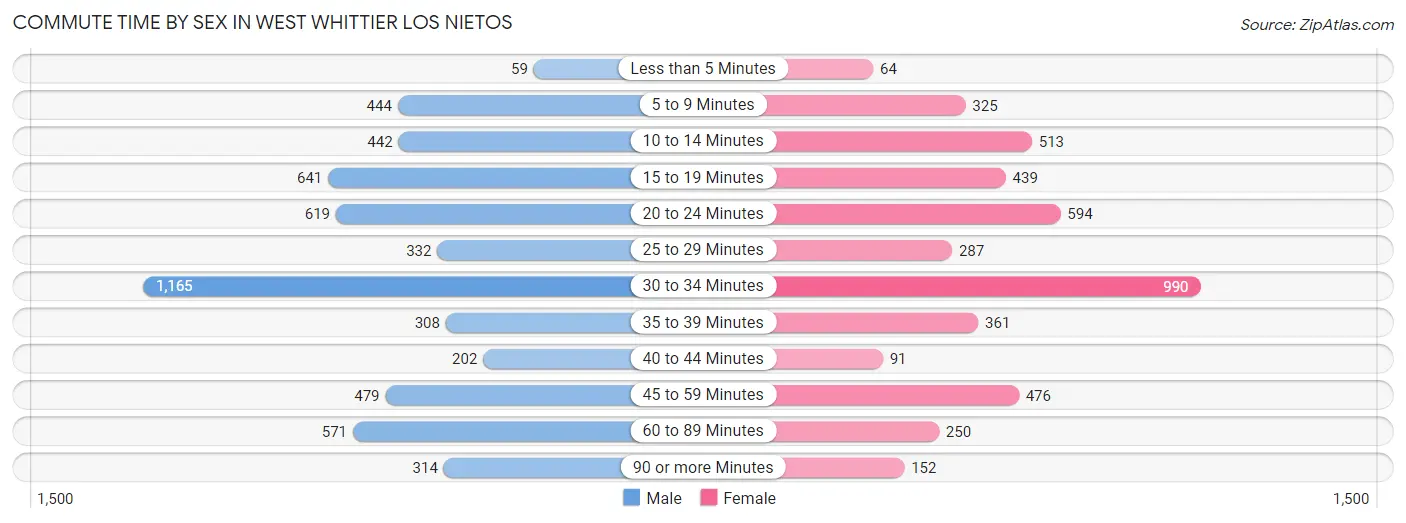
| Commute Time | Male | Female |
| Less than 5 Minutes | 59 (1.1%) | 64 (1.4%) |
| 5 to 9 Minutes | 444 (8.0%) | 325 (7.2%) |
| 10 to 14 Minutes | 442 (7.9%) | 513 (11.3%) |
| 15 to 19 Minutes | 641 (11.5%) | 439 (9.7%) |
| 20 to 24 Minutes | 619 (11.1%) | 594 (13.1%) |
| 25 to 29 Minutes | 332 (5.9%) | 287 (6.3%) |
| 30 to 34 Minutes | 1,165 (20.9%) | 990 (21.8%) |
| 35 to 39 Minutes | 308 (5.5%) | 361 (8.0%) |
| 40 to 44 Minutes | 202 (3.6%) | 91 (2.0%) |
| 45 to 59 Minutes | 479 (8.6%) | 476 (10.5%) |
| 60 to 89 Minutes | 571 (10.2%) | 250 (5.5%) |
| 90 or more Minutes | 314 (5.6%) | 152 (3.4%) |
Time of Departure to Work by Sex in West Whittier Los Nietos
The most frequent times of departure to work in West Whittier Los Nietos are 7:00 AM to 7:29 AM (764, 13.7%) for males and 7:00 AM to 7:29 AM (928, 20.4%) for females.
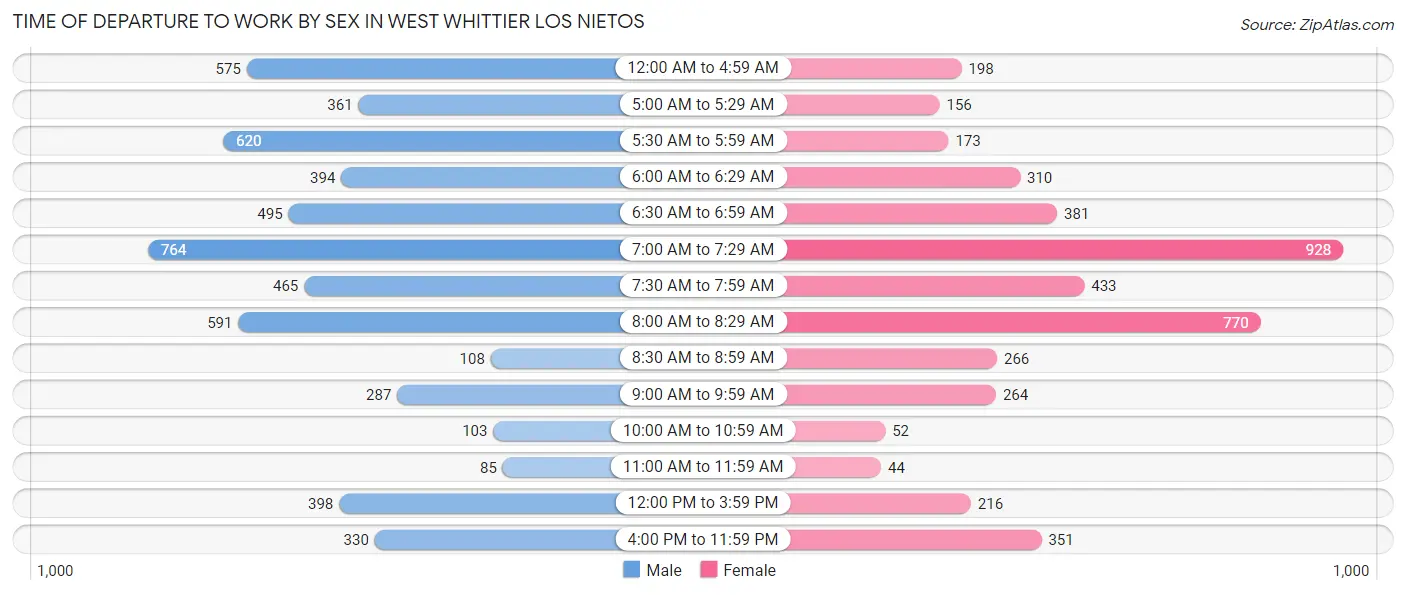
| Time of Departure | Male | Female |
| 12:00 AM to 4:59 AM | 575 (10.3%) | 198 (4.4%) |
| 5:00 AM to 5:29 AM | 361 (6.5%) | 156 (3.4%) |
| 5:30 AM to 5:59 AM | 620 (11.1%) | 173 (3.8%) |
| 6:00 AM to 6:29 AM | 394 (7.1%) | 310 (6.8%) |
| 6:30 AM to 6:59 AM | 495 (8.9%) | 381 (8.4%) |
| 7:00 AM to 7:29 AM | 764 (13.7%) | 928 (20.4%) |
| 7:30 AM to 7:59 AM | 465 (8.3%) | 433 (9.5%) |
| 8:00 AM to 8:29 AM | 591 (10.6%) | 770 (17.0%) |
| 8:30 AM to 8:59 AM | 108 (1.9%) | 266 (5.9%) |
| 9:00 AM to 9:59 AM | 287 (5.1%) | 264 (5.8%) |
| 10:00 AM to 10:59 AM | 103 (1.8%) | 52 (1.1%) |
| 11:00 AM to 11:59 AM | 85 (1.5%) | 44 (1.0%) |
| 12:00 PM to 3:59 PM | 398 (7.1%) | 216 (4.8%) |
| 4:00 PM to 11:59 PM | 330 (5.9%) | 351 (7.7%) |
| Total | 5,576 (100.0%) | 4,542 (100.0%) |
Housing Occupancy in West Whittier Los Nietos
Occupancy by Ownership in West Whittier Los Nietos
Of the total 6,779 dwellings in West Whittier Los Nietos, owner-occupied units account for 5,096 (75.2%), while renter-occupied units make up 1,683 (24.8%).
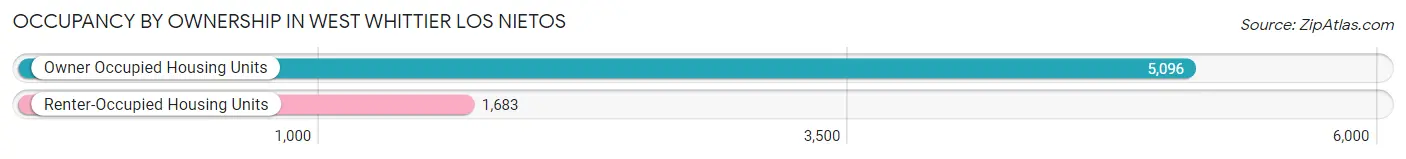
| Occupancy | # Housing Units | % Housing Units |
| Owner Occupied Housing Units | 5,096 | 75.2% |
| Renter-Occupied Housing Units | 1,683 | 24.8% |
| Total Occupied Housing Units | 6,779 | 100.0% |
Occupancy by Household Size in West Whittier Los Nietos
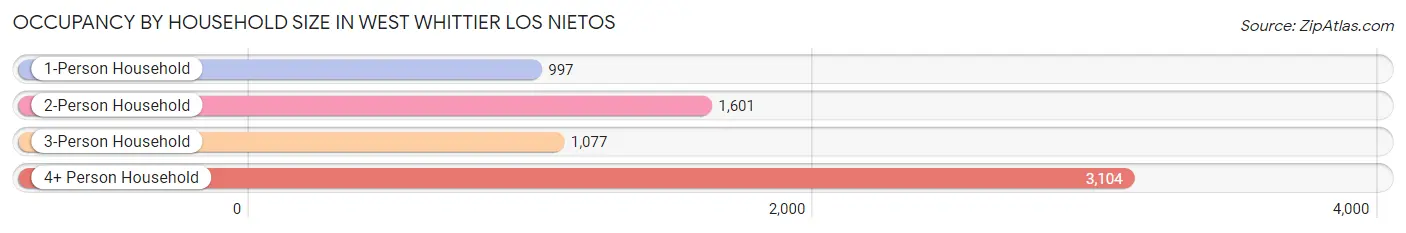
| Household Size | # Housing Units | % Housing Units |
| 1-Person Household | 997 | 14.7% |
| 2-Person Household | 1,601 | 23.6% |
| 3-Person Household | 1,077 | 15.9% |
| 4+ Person Household | 3,104 | 45.8% |
| Total Housing Units | 6,779 | 100.0% |
Occupancy by Ownership by Household Size in West Whittier Los Nietos
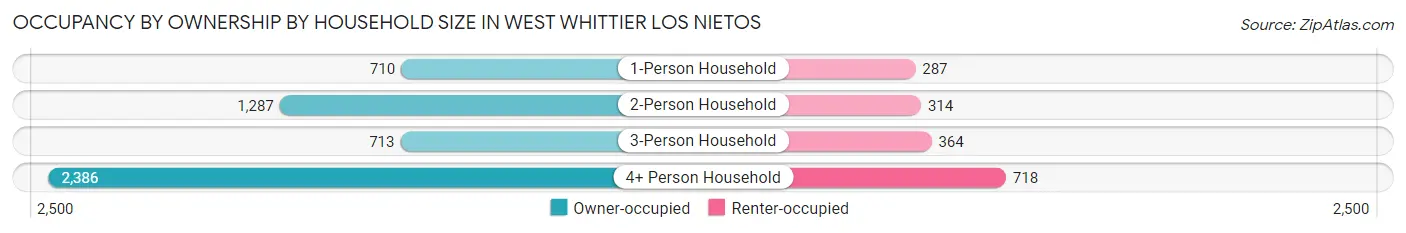
| Household Size | Owner-occupied | Renter-occupied |
| 1-Person Household | 710 (71.2%) | 287 (28.8%) |
| 2-Person Household | 1,287 (80.4%) | 314 (19.6%) |
| 3-Person Household | 713 (66.2%) | 364 (33.8%) |
| 4+ Person Household | 2,386 (76.9%) | 718 (23.1%) |
| Total Housing Units | 5,096 (75.2%) | 1,683 (24.8%) |
Occupancy by Educational Attainment in West Whittier Los Nietos
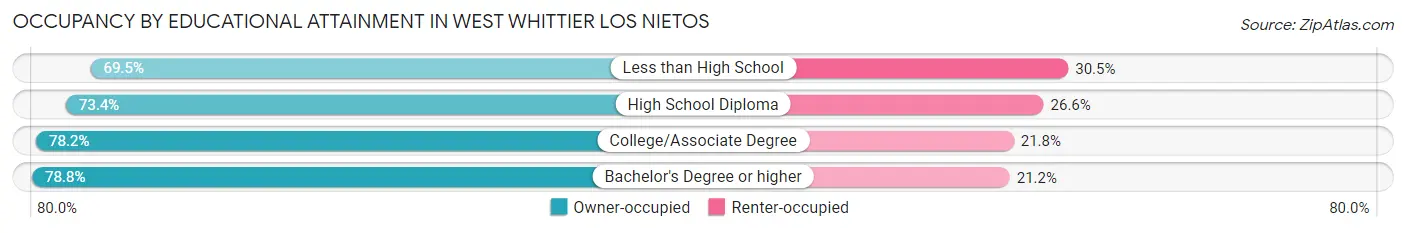
| Household Size | Owner-occupied | Renter-occupied |
| Less than High School | 1,043 (69.5%) | 457 (30.5%) |
| High School Diploma | 1,291 (73.4%) | 467 (26.6%) |
| College/Associate Degree | 1,583 (78.2%) | 442 (21.8%) |
| Bachelor's Degree or higher | 1,179 (78.8%) | 317 (21.2%) |
Occupancy by Age of Householder in West Whittier Los Nietos
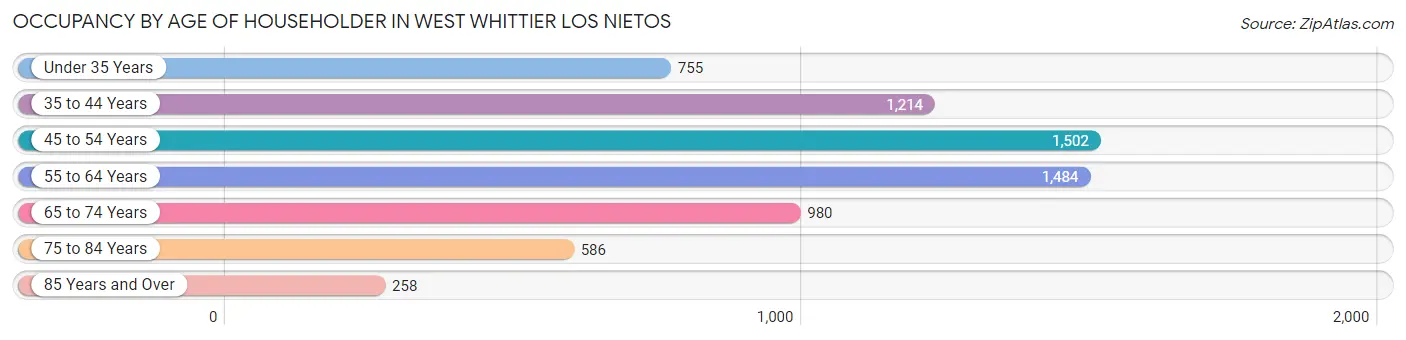
| Age Bracket | # Households | % Households |
| Under 35 Years | 755 | 11.1% |
| 35 to 44 Years | 1,214 | 17.9% |
| 45 to 54 Years | 1,502 | 22.2% |
| 55 to 64 Years | 1,484 | 21.9% |
| 65 to 74 Years | 980 | 14.5% |
| 75 to 84 Years | 586 | 8.6% |
| 85 Years and Over | 258 | 3.8% |
| Total | 6,779 | 100.0% |
Housing Finances in West Whittier Los Nietos
Median Income by Occupancy in West Whittier Los Nietos

| Occupancy Type | # Households | Median Income |
| Owner-Occupied | 5,096 (75.2%) | $96,895 |
| Renter-Occupied | 1,683 (24.8%) | $59,236 |
| Average | 6,779 (100.0%) | $88,064 |
Occupancy by Householder Income Bracket in West Whittier Los Nietos
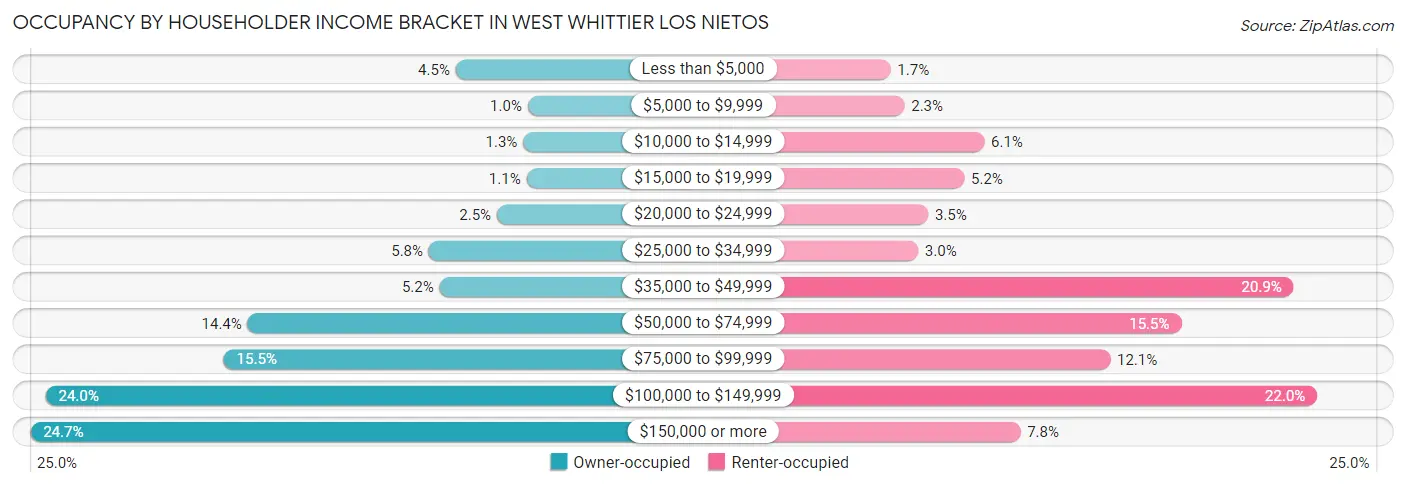
| Income Bracket | Owner-occupied | Renter-occupied |
| Less than $5,000 | 228 (4.5%) | 28 (1.7%) |
| $5,000 to $9,999 | 53 (1.0%) | 39 (2.3%) |
| $10,000 to $14,999 | 64 (1.3%) | 103 (6.1%) |
| $15,000 to $19,999 | 56 (1.1%) | 87 (5.2%) |
| $20,000 to $24,999 | 128 (2.5%) | 58 (3.5%) |
| $25,000 to $34,999 | 293 (5.8%) | 50 (3.0%) |
| $35,000 to $49,999 | 267 (5.2%) | 351 (20.9%) |
| $50,000 to $74,999 | 733 (14.4%) | 261 (15.5%) |
| $75,000 to $99,999 | 791 (15.5%) | 204 (12.1%) |
| $100,000 to $149,999 | 1,223 (24.0%) | 370 (22.0%) |
| $150,000 or more | 1,260 (24.7%) | 132 (7.8%) |
| Total | 5,096 (100.0%) | 1,683 (100.0%) |
Monthly Housing Cost Tiers in West Whittier Los Nietos
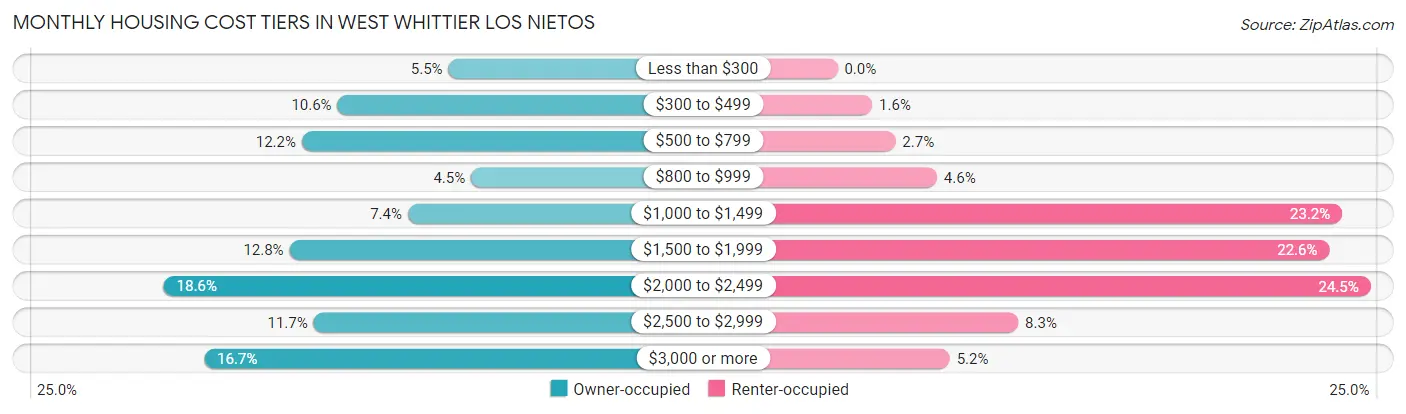
| Monthly Cost | Owner-occupied | Renter-occupied |
| Less than $300 | 280 (5.5%) | 0 (0.0%) |
| $300 to $499 | 540 (10.6%) | 27 (1.6%) |
| $500 to $799 | 624 (12.2%) | 45 (2.7%) |
| $800 to $999 | 227 (4.4%) | 77 (4.6%) |
| $1,000 to $1,499 | 375 (7.4%) | 391 (23.2%) |
| $1,500 to $1,999 | 653 (12.8%) | 381 (22.6%) |
| $2,000 to $2,499 | 948 (18.6%) | 413 (24.5%) |
| $2,500 to $2,999 | 596 (11.7%) | 140 (8.3%) |
| $3,000 or more | 853 (16.7%) | 87 (5.2%) |
| Total | 5,096 (100.0%) | 1,683 (100.0%) |
Physical Housing Characteristics in West Whittier Los Nietos
Housing Structures in West Whittier Los Nietos
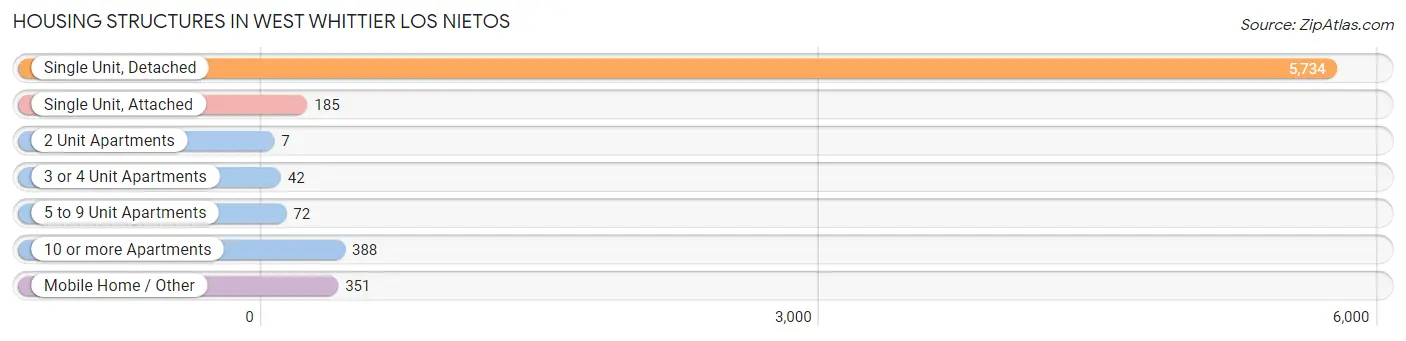
| Structure Type | # Housing Units | % Housing Units |
| Single Unit, Detached | 5,734 | 84.6% |
| Single Unit, Attached | 185 | 2.7% |
| 2 Unit Apartments | 7 | 0.1% |
| 3 or 4 Unit Apartments | 42 | 0.6% |
| 5 to 9 Unit Apartments | 72 | 1.1% |
| 10 or more Apartments | 388 | 5.7% |
| Mobile Home / Other | 351 | 5.2% |
| Total | 6,779 | 100.0% |
Housing Structures by Occupancy in West Whittier Los Nietos
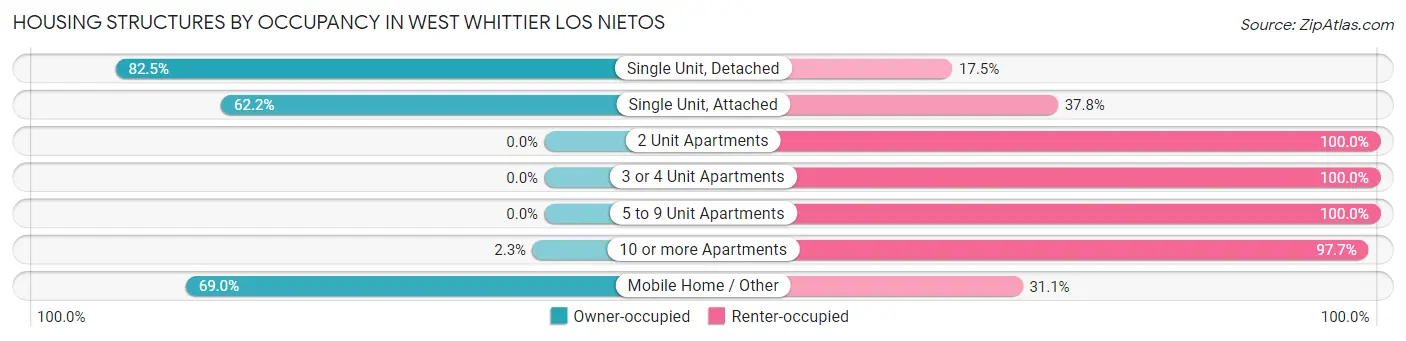
| Structure Type | Owner-occupied | Renter-occupied |
| Single Unit, Detached | 4,730 (82.5%) | 1,004 (17.5%) |
| Single Unit, Attached | 115 (62.2%) | 70 (37.8%) |
| 2 Unit Apartments | 0 (0.0%) | 7 (100.0%) |
| 3 or 4 Unit Apartments | 0 (0.0%) | 42 (100.0%) |
| 5 to 9 Unit Apartments | 0 (0.0%) | 72 (100.0%) |
| 10 or more Apartments | 9 (2.3%) | 379 (97.7%) |
| Mobile Home / Other | 242 (69.0%) | 109 (31.0%) |
| Total | 5,096 (75.2%) | 1,683 (24.8%) |
Housing Structures by Number of Rooms in West Whittier Los Nietos
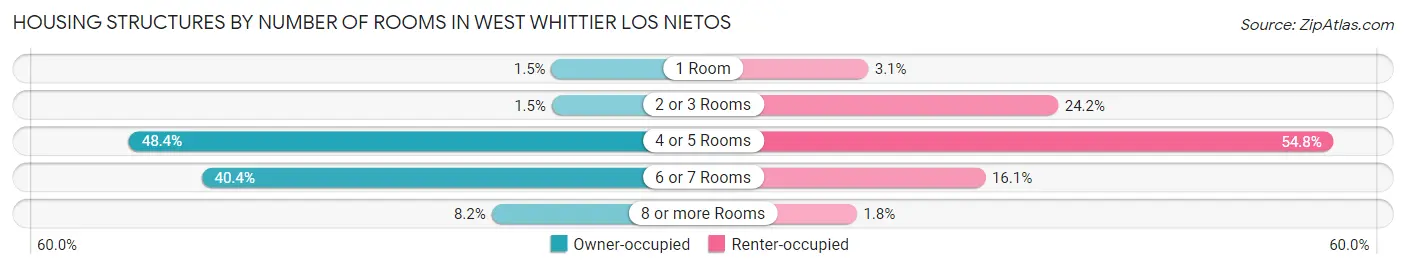
| Number of Rooms | Owner-occupied | Renter-occupied |
| 1 Room | 78 (1.5%) | 52 (3.1%) |
| 2 or 3 Rooms | 76 (1.5%) | 407 (24.2%) |
| 4 or 5 Rooms | 2,468 (48.4%) | 922 (54.8%) |
| 6 or 7 Rooms | 2,057 (40.4%) | 271 (16.1%) |
| 8 or more Rooms | 417 (8.2%) | 31 (1.8%) |
| Total | 5,096 (100.0%) | 1,683 (100.0%) |
Housing Structure by Heating Type in West Whittier Los Nietos
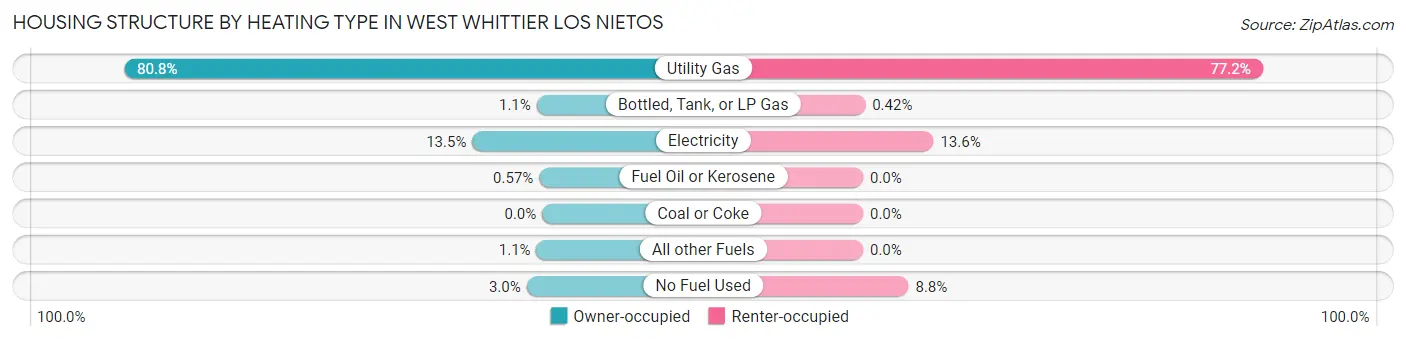
| Heating Type | Owner-occupied | Renter-occupied |
| Utility Gas | 4,116 (80.8%) | 1,299 (77.2%) |
| Bottled, Tank, or LP Gas | 54 (1.1%) | 7 (0.4%) |
| Electricity | 688 (13.5%) | 229 (13.6%) |
| Fuel Oil or Kerosene | 29 (0.6%) | 0 (0.0%) |
| Coal or Coke | 0 (0.0%) | 0 (0.0%) |
| All other Fuels | 56 (1.1%) | 0 (0.0%) |
| No Fuel Used | 153 (3.0%) | 148 (8.8%) |
| Total | 5,096 (100.0%) | 1,683 (100.0%) |
Household Vehicle Usage in West Whittier Los Nietos
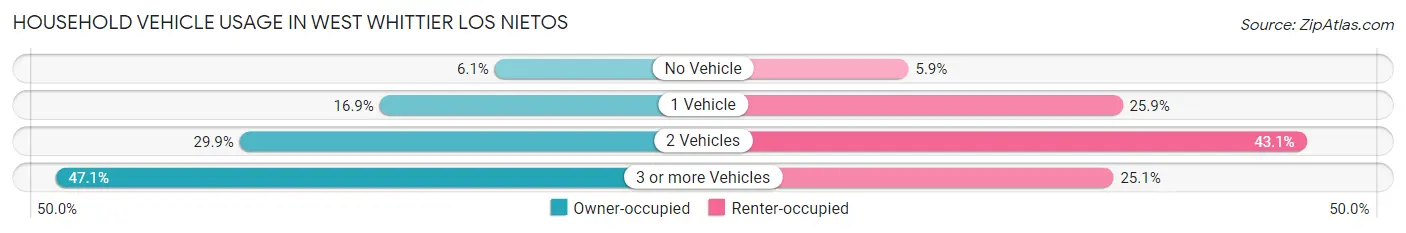
| Vehicles per Household | Owner-occupied | Renter-occupied |
| No Vehicle | 312 (6.1%) | 100 (5.9%) |
| 1 Vehicle | 859 (16.9%) | 436 (25.9%) |
| 2 Vehicles | 1,525 (29.9%) | 725 (43.1%) |
| 3 or more Vehicles | 2,400 (47.1%) | 422 (25.1%) |
| Total | 5,096 (100.0%) | 1,683 (100.0%) |
Real Estate & Mortgages in West Whittier Los Nietos
Real Estate and Mortgage Overview in West Whittier Los Nietos
| Characteristic | Without Mortgage | With Mortgage |
| Housing Units | 1,680 | 3,416 |
| Median Property Value | $501,400 | $609,600 |
| Median Household Income | $80,694 | $988 |
| Monthly Housing Costs | $521 | $853 |
| Real Estate Taxes | $2,282 | $64 |
Property Value by Mortgage Status in West Whittier Los Nietos
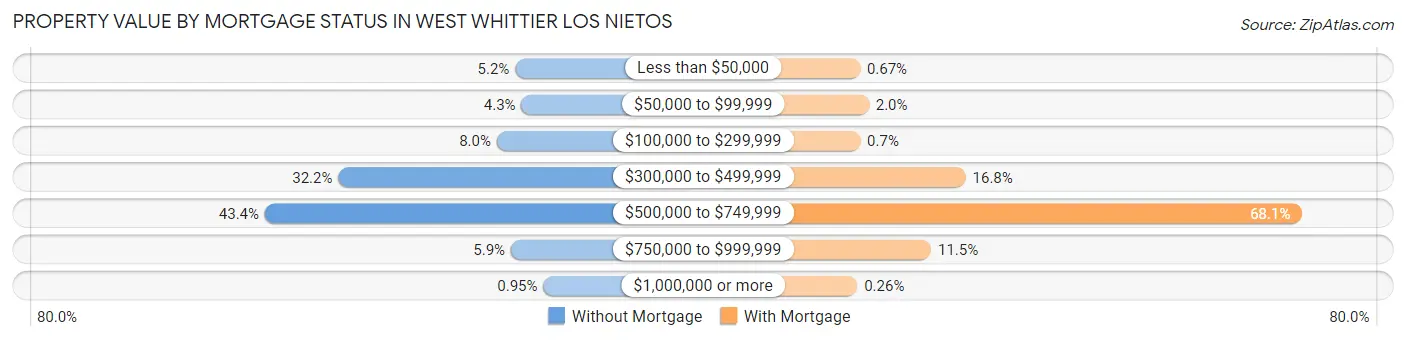
| Property Value | Without Mortgage | With Mortgage |
| Less than $50,000 | 88 (5.2%) | 23 (0.7%) |
| $50,000 to $99,999 | 72 (4.3%) | 69 (2.0%) |
| $100,000 to $299,999 | 135 (8.0%) | 24 (0.7%) |
| $300,000 to $499,999 | 541 (32.2%) | 573 (16.8%) |
| $500,000 to $749,999 | 729 (43.4%) | 2,325 (68.1%) |
| $750,000 to $999,999 | 99 (5.9%) | 393 (11.5%) |
| $1,000,000 or more | 16 (0.9%) | 9 (0.3%) |
| Total | 1,680 (100.0%) | 3,416 (100.0%) |
Household Income by Mortgage Status in West Whittier Los Nietos
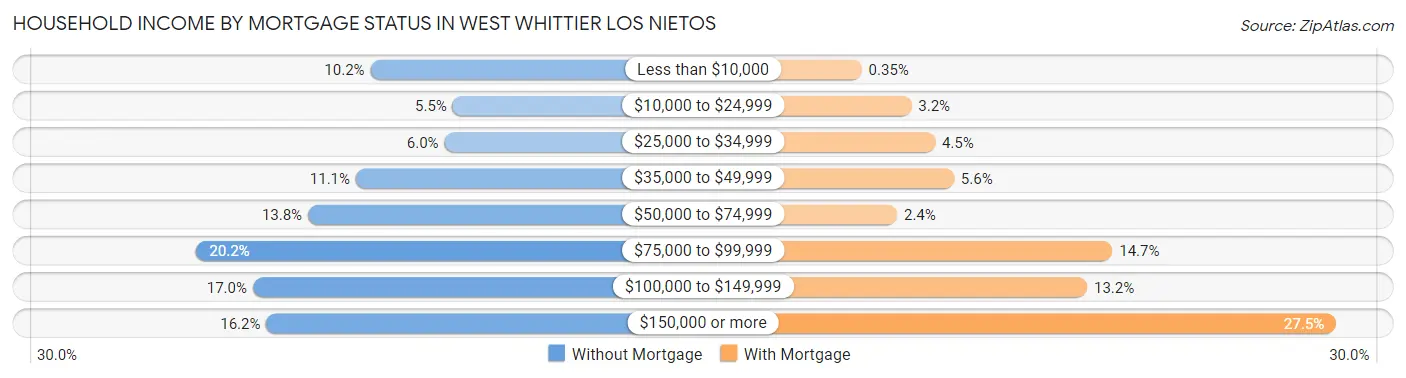
| Household Income | Without Mortgage | With Mortgage |
| Less than $10,000 | 172 (10.2%) | 12 (0.4%) |
| $10,000 to $24,999 | 93 (5.5%) | 109 (3.2%) |
| $25,000 to $34,999 | 101 (6.0%) | 155 (4.5%) |
| $35,000 to $49,999 | 186 (11.1%) | 192 (5.6%) |
| $50,000 to $74,999 | 232 (13.8%) | 81 (2.4%) |
| $75,000 to $99,999 | 339 (20.2%) | 501 (14.7%) |
| $100,000 to $149,999 | 285 (17.0%) | 452 (13.2%) |
| $150,000 or more | 272 (16.2%) | 938 (27.5%) |
| Total | 1,680 (100.0%) | 3,416 (100.0%) |
Property Value to Household Income Ratio in West Whittier Los Nietos
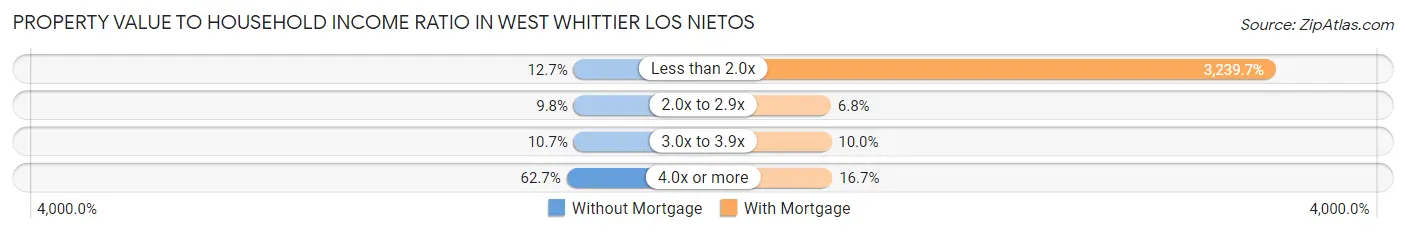
| Value-to-Income Ratio | Without Mortgage | With Mortgage |
| Less than 2.0x | 213 (12.7%) | 110,667 (3,239.7%) |
| 2.0x to 2.9x | 164 (9.8%) | 231 (6.8%) |
| 3.0x to 3.9x | 180 (10.7%) | 340 (10.0%) |
| 4.0x or more | 1,054 (62.7%) | 572 (16.7%) |
| Total | 1,680 (100.0%) | 3,416 (100.0%) |
Real Estate Taxes by Mortgage Status in West Whittier Los Nietos
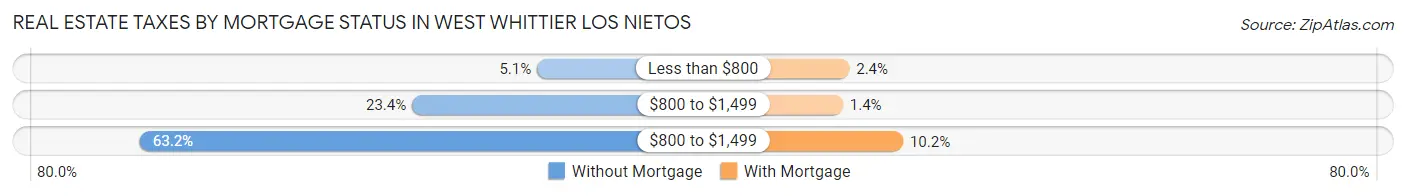
| Property Taxes | Without Mortgage | With Mortgage |
| Less than $800 | 86 (5.1%) | 81 (2.4%) |
| $800 to $1,499 | 393 (23.4%) | 49 (1.4%) |
| $800 to $1,499 | 1,061 (63.1%) | 349 (10.2%) |
| Total | 1,680 (100.0%) | 3,416 (100.0%) |
Health & Disability in West Whittier Los Nietos
Health Insurance Coverage by Age in West Whittier Los Nietos
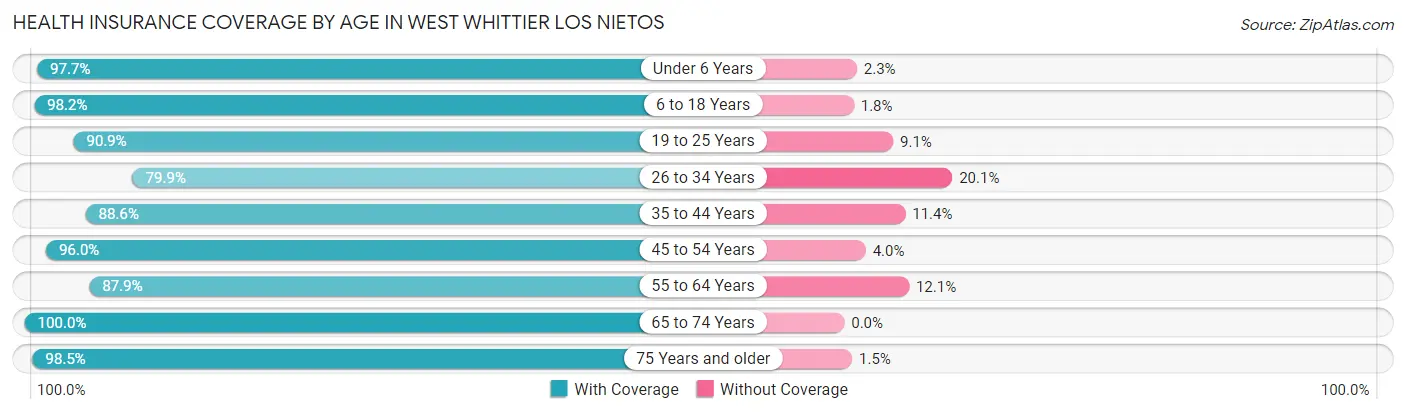
| Age Bracket | With Coverage | Without Coverage |
| Under 6 Years | 1,543 (97.7%) | 37 (2.3%) |
| 6 to 18 Years | 4,096 (98.2%) | 74 (1.8%) |
| 19 to 25 Years | 1,969 (90.9%) | 197 (9.1%) |
| 26 to 34 Years | 3,286 (79.9%) | 828 (20.1%) |
| 35 to 44 Years | 2,760 (88.6%) | 354 (11.4%) |
| 45 to 54 Years | 3,101 (96.0%) | 129 (4.0%) |
| 55 to 64 Years | 2,756 (87.9%) | 378 (12.1%) |
| 65 to 74 Years | 2,035 (100.0%) | 0 (0.0%) |
| 75 Years and older | 1,821 (98.5%) | 27 (1.5%) |
| Total | 23,367 (92.0%) | 2,024 (8.0%) |
Health Insurance Coverage by Citizenship Status in West Whittier Los Nietos
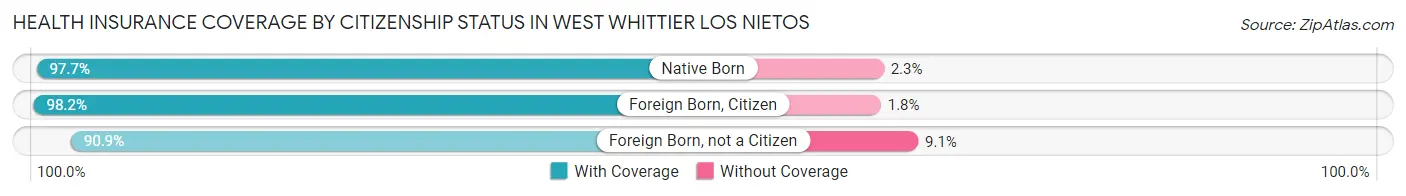
| Citizenship Status | With Coverage | Without Coverage |
| Native Born | 1,543 (97.7%) | 37 (2.3%) |
| Foreign Born, Citizen | 4,096 (98.2%) | 74 (1.8%) |
| Foreign Born, not a Citizen | 1,969 (90.9%) | 197 (9.1%) |
Health Insurance Coverage by Household Income in West Whittier Los Nietos
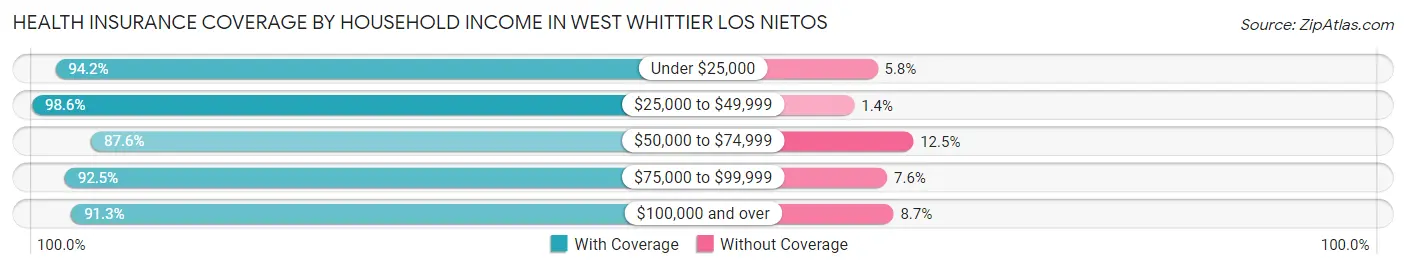
| Household Income | With Coverage | Without Coverage |
| Under $25,000 | 1,782 (94.2%) | 109 (5.8%) |
| $25,000 to $49,999 | 2,893 (98.6%) | 41 (1.4%) |
| $50,000 to $74,999 | 2,875 (87.5%) | 409 (12.4%) |
| $75,000 to $99,999 | 3,427 (92.4%) | 280 (7.5%) |
| $100,000 and over | 12,305 (91.3%) | 1,178 (8.7%) |
Public vs Private Health Insurance Coverage by Age in West Whittier Los Nietos
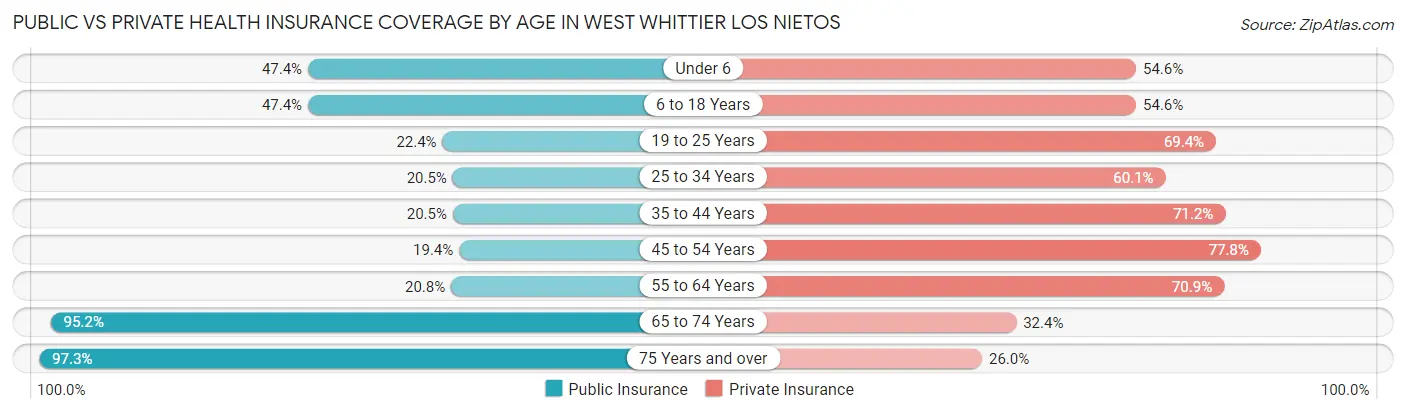
| Age Bracket | Public Insurance | Private Insurance |
| Under 6 | 749 (47.4%) | 863 (54.6%) |
| 6 to 18 Years | 1,977 (47.4%) | 2,278 (54.6%) |
| 19 to 25 Years | 486 (22.4%) | 1,504 (69.4%) |
| 25 to 34 Years | 845 (20.5%) | 2,471 (60.1%) |
| 35 to 44 Years | 639 (20.5%) | 2,216 (71.2%) |
| 45 to 54 Years | 625 (19.4%) | 2,512 (77.8%) |
| 55 to 64 Years | 653 (20.8%) | 2,223 (70.9%) |
| 65 to 74 Years | 1,937 (95.2%) | 659 (32.4%) |
| 75 Years and over | 1,798 (97.3%) | 481 (26.0%) |
| Total | 9,709 (38.2%) | 15,207 (59.9%) |
Disability Status by Sex by Age in West Whittier Los Nietos
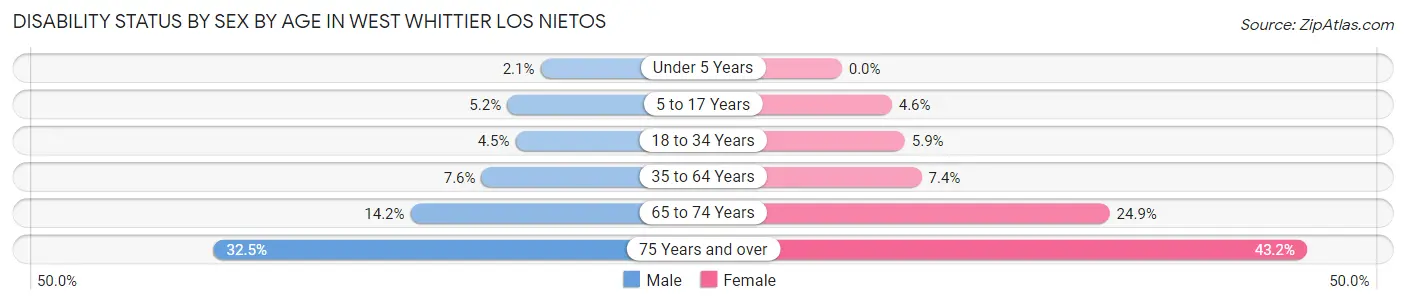
| Age Bracket | Male | Female |
| Under 5 Years | 11 (2.1%) | 0 (0.0%) |
| 5 to 17 Years | 113 (5.2%) | 96 (4.6%) |
| 18 to 34 Years | 145 (4.5%) | 191 (5.9%) |
| 35 to 64 Years | 367 (7.6%) | 345 (7.4%) |
| 65 to 74 Years | 137 (14.2%) | 266 (24.9%) |
| 75 Years and over | 256 (32.5%) | 457 (43.1%) |
Disability Class by Sex by Age in West Whittier Los Nietos
Disability Class: Hearing Difficulty
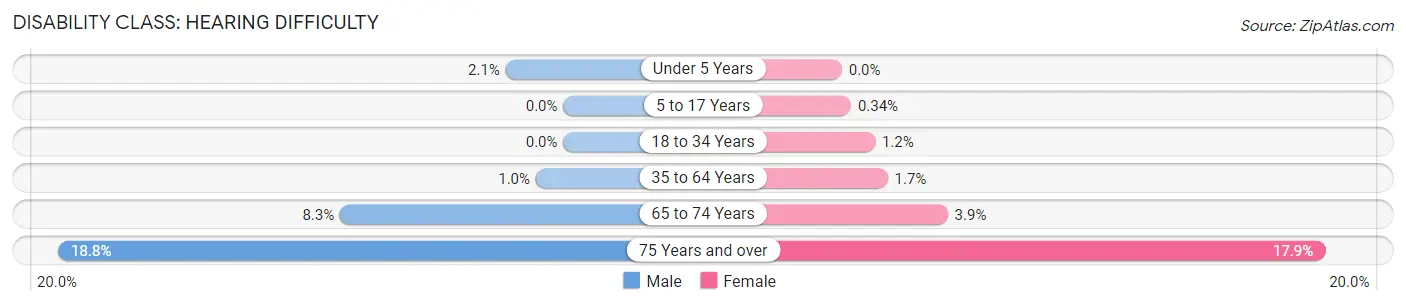
| Age Bracket | Male | Female |
| Under 5 Years | 11 (2.1%) | 0 (0.0%) |
| 5 to 17 Years | 0 (0.0%) | 7 (0.3%) |
| 18 to 34 Years | 0 (0.0%) | 40 (1.2%) |
| 35 to 64 Years | 49 (1.0%) | 79 (1.7%) |
| 65 to 74 Years | 80 (8.3%) | 42 (3.9%) |
| 75 Years and over | 148 (18.8%) | 190 (17.9%) |
Disability Class: Vision Difficulty
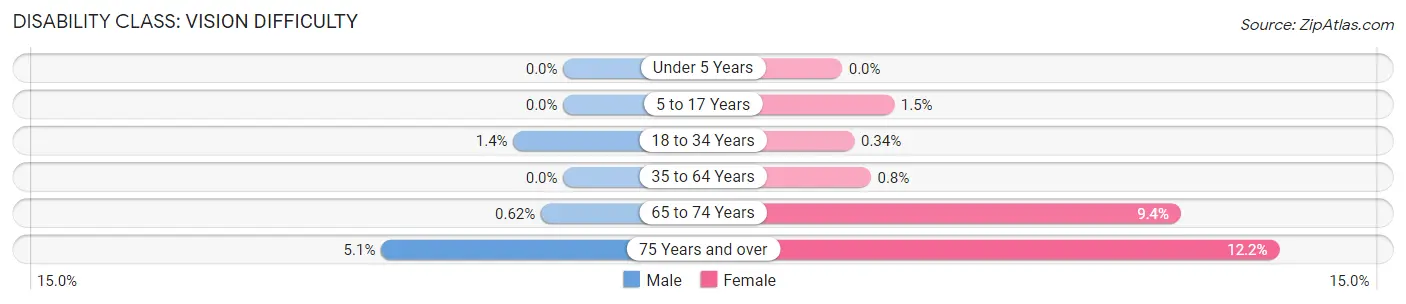
| Age Bracket | Male | Female |
| Under 5 Years | 0 (0.0%) | 0 (0.0%) |
| 5 to 17 Years | 0 (0.0%) | 30 (1.5%) |
| 18 to 34 Years | 45 (1.4%) | 11 (0.3%) |
| 35 to 64 Years | 0 (0.0%) | 37 (0.8%) |
| 65 to 74 Years | 6 (0.6%) | 101 (9.4%) |
| 75 Years and over | 40 (5.1%) | 129 (12.2%) |
Disability Class: Cognitive Difficulty
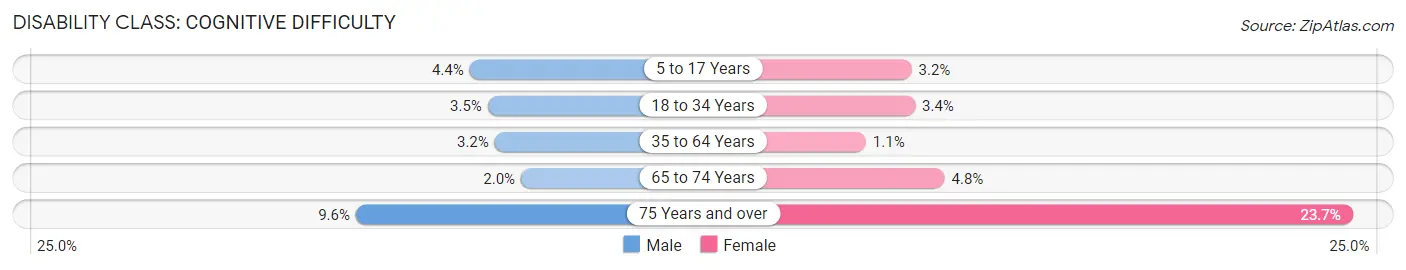
| Age Bracket | Male | Female |
| 5 to 17 Years | 94 (4.3%) | 67 (3.2%) |
| 18 to 34 Years | 114 (3.5%) | 111 (3.4%) |
| 35 to 64 Years | 154 (3.2%) | 52 (1.1%) |
| 65 to 74 Years | 19 (2.0%) | 51 (4.8%) |
| 75 Years and over | 76 (9.6%) | 251 (23.7%) |
Disability Class: Ambulatory Difficulty
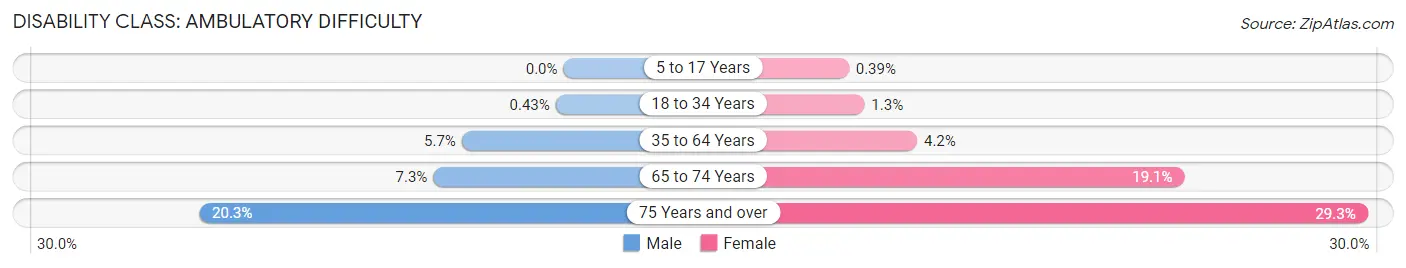
| Age Bracket | Male | Female |
| 5 to 17 Years | 0 (0.0%) | 8 (0.4%) |
| 18 to 34 Years | 14 (0.4%) | 41 (1.3%) |
| 35 to 64 Years | 273 (5.7%) | 195 (4.2%) |
| 65 to 74 Years | 70 (7.2%) | 204 (19.1%) |
| 75 Years and over | 160 (20.3%) | 310 (29.3%) |
Disability Class: Self-Care Difficulty
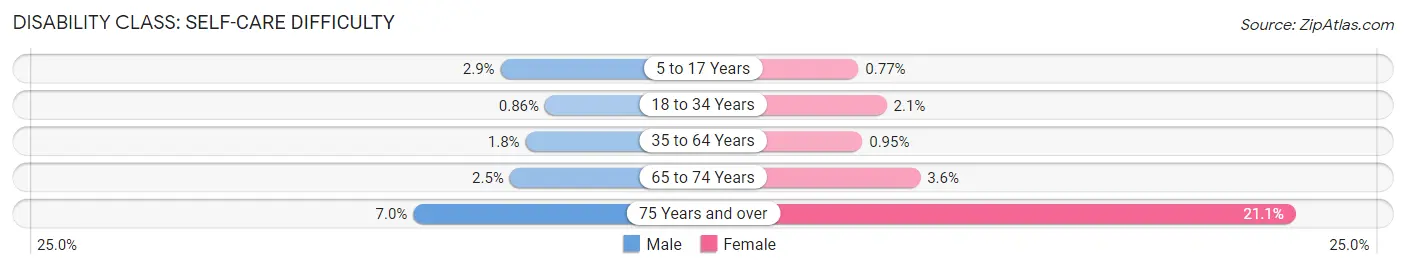
| Age Bracket | Male | Female |
| 5 to 17 Years | 63 (2.9%) | 16 (0.8%) |
| 18 to 34 Years | 28 (0.9%) | 68 (2.1%) |
| 35 to 64 Years | 85 (1.8%) | 44 (0.9%) |
| 65 to 74 Years | 24 (2.5%) | 39 (3.6%) |
| 75 Years and over | 55 (7.0%) | 223 (21.1%) |
Technology Access in West Whittier Los Nietos
Computing Device Access in West Whittier Los Nietos
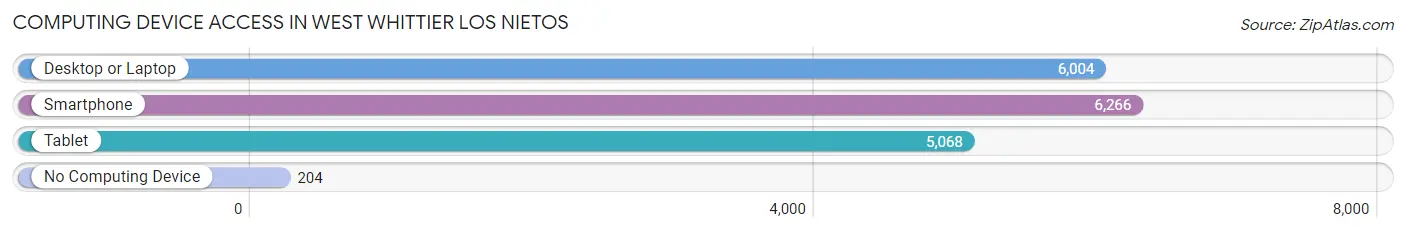
| Device Type | # Households | % Households |
| Desktop or Laptop | 6,004 | 88.6% |
| Smartphone | 6,266 | 92.4% |
| Tablet | 5,068 | 74.8% |
| No Computing Device | 204 | 3.0% |
| Total | 6,779 | 100.0% |
Internet Access in West Whittier Los Nietos
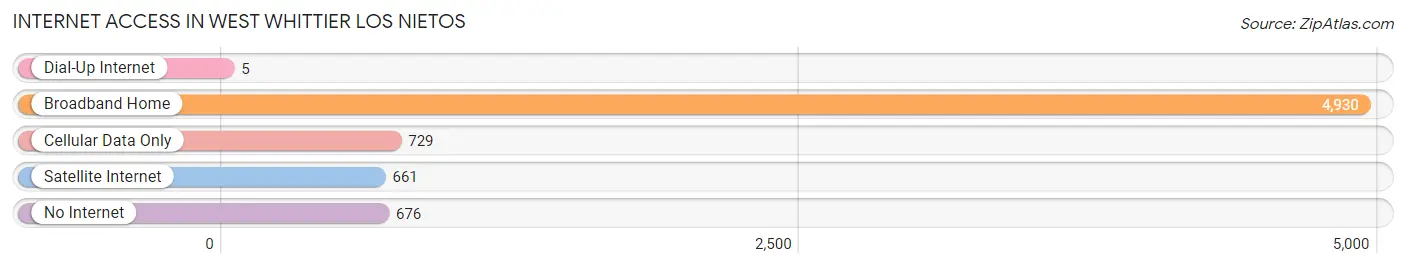
| Internet Type | # Households | % Households |
| Dial-Up Internet | 5 | 0.1% |
| Broadband Home | 4,930 | 72.7% |
| Cellular Data Only | 729 | 10.7% |
| Satellite Internet | 661 | 9.8% |
| No Internet | 676 | 10.0% |
| Total | 6,779 | 100.0% |
West Whittier Los Nietos Summary
West Whittier Los Nietos is a census-designated place (CDP) located in Los Angeles County, California. It is situated in the southeastern portion of the county, approximately 20 miles southeast of downtown Los Angeles. The population of West Whittier Los Nietos was 24,817 at the 2010 census.
History
The area now known as West Whittier Los Nietos was originally inhabited by the Tongva people, who were the original inhabitants of the Los Angeles Basin. The area was part of the Rancho Los Nietos, a Mexican land grant given to Manuel Nieto in 1795. The area was later settled by American settlers in the mid-19th century. The area was known as West Whittier until the 1990s, when it was officially changed to West Whittier Los Nietos to reflect the area’s Mexican heritage.
Geography
West Whittier Los Nietos is located at 33°59'25"N 118°3'25"W (33.990278, -118.056944). It is situated in the southeastern portion of Los Angeles County, approximately 20 miles southeast of downtown Los Angeles. The CDP has a total area of 4.2 square miles, all of which is land.
Economy
The economy of West Whittier Los Nietos is largely based on retail and services. The area is home to several large shopping centers, including the Los Nietos Shopping Center, the West Whittier Shopping Center, and the Whittwood Town Center. The area is also home to several industrial parks, including the West Whittier Industrial Park and the Los Nietos Industrial Park.
Demographics
As of the 2010 census, the population of West Whittier Los Nietos was 24,817. The racial makeup of the CDP was 57.2% White, 1.3% African American, 0.7% Native American, 2.2% Asian, 0.2% Pacific Islander, 33.3% from other races, and 5.3% from two or more races. Hispanic or Latino of any race were 63.2% of the population.
The median household income in West Whittier Los Nietos was $50,945 in 2018. The per capita income for the CDP was $20,945. About 17.2% of families and 20.3% of the population were below the poverty line, including 28.2% of those under age 18 and 11.2% of those age 65 or over.
Common Questions
What is Per Capita Income in West Whittier Los Nietos?
Per Capita income in West Whittier Los Nietos is $29,037.
What is the Median Family Income in West Whittier Los Nietos?
Median Family Income in West Whittier Los Nietos is $94,278.
What is the Median Household income in West Whittier Los Nietos?
Median Household Income in West Whittier Los Nietos is $88,064.
What is Income or Wage Gap in West Whittier Los Nietos?
Income or Wage Gap in West Whittier Los Nietos is 16.8%.
Women in West Whittier Los Nietos earn 83.2 cents for every dollar earned by a man.
What is Family Income Deficit in West Whittier Los Nietos?
Family Income Deficit in West Whittier Los Nietos is $11,618.
Families that are below poverty line in West Whittier Los Nietos earn $11,618 less on average than the poverty threshold level.
What is Inequality or Gini Index in West Whittier Los Nietos?
Inequality or Gini Index in West Whittier Los Nietos is 0.40.
What is the Total Population of West Whittier Los Nietos?
Total Population of West Whittier Los Nietos is 25,442.
What is the Total Male Population of West Whittier Los Nietos?
Total Male Population of West Whittier Los Nietos is 12,540.
What is the Total Female Population of West Whittier Los Nietos?
Total Female Population of West Whittier Los Nietos is 12,902.
What is the Ratio of Males per 100 Females in West Whittier Los Nietos?
There are 97.19 Males per 100 Females in West Whittier Los Nietos.
What is the Ratio of Females per 100 Males in West Whittier Los Nietos?
There are 102.89 Females per 100 Males in West Whittier Los Nietos.
What is the Median Population Age in West Whittier Los Nietos?
Median Population Age in West Whittier Los Nietos is 37.2 Years.
What is the Average Family Size in West Whittier Los Nietos
Average Family Size in West Whittier Los Nietos is 4.0 People.
What is the Average Household Size in West Whittier Los Nietos
Average Household Size in West Whittier Los Nietos is 3.7 People.
How Large is the Labor Force in West Whittier Los Nietos?
There are 11,951 People in the Labor Forcein in West Whittier Los Nietos.
What is the Percentage of People in the Labor Force in West Whittier Los Nietos?
57.9% of People are in the Labor Force in West Whittier Los Nietos.
What is the Unemployment Rate in West Whittier Los Nietos?
Unemployment Rate in West Whittier Los Nietos is 3.9%.