Cities with the Highest Percentage of Ghanaian Population in Illinois
RELATED REPORTS & OPTIONS
Ghanaian
Illinois
Compare Cities
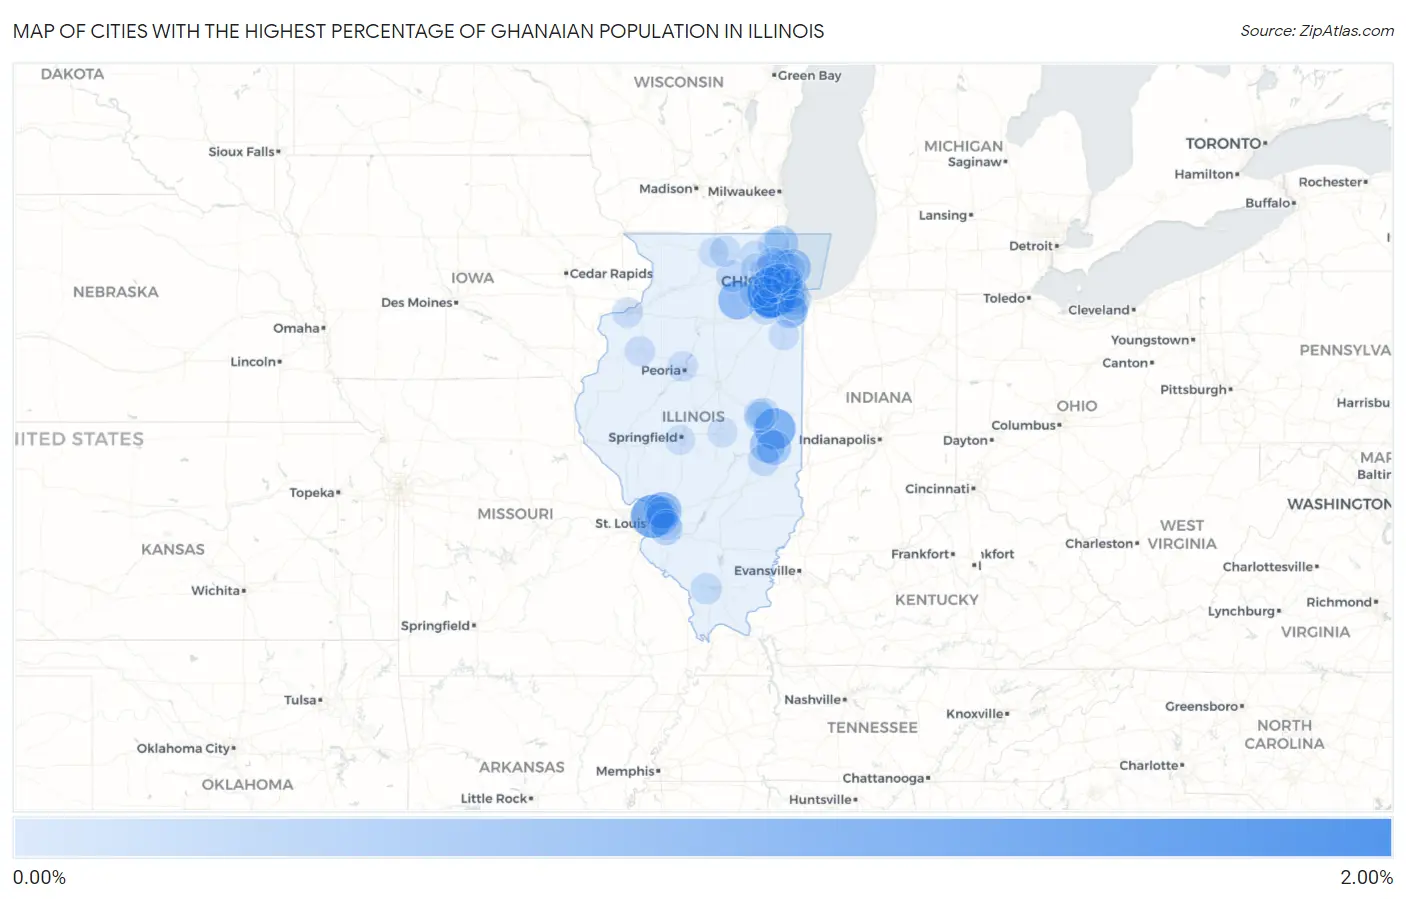
Map of Cities with the Highest Percentage of Ghanaian Population in Illinois
0.00%
2.00%
Cities with the Highest Percentage of Ghanaian Population in Illinois
| City | Ghanaian | vs State | vs National | |
| 1. | Woodridge | 1.85% | 0.051%(+1.80)#1 | 0.056%(+1.80)#59 |
| 2. | Madison | 1.23% | 0.051%(+1.18)#2 | 0.056%(+1.18)#108 |
| 3. | Broadlands | 1.02% | 0.051%(+0.966)#3 | 0.056%(+0.961)#127 |
| 4. | Romeoville | 0.81% | 0.051%(+0.756)#4 | 0.056%(+0.751)#156 |
| 5. | Lake Holiday | 0.80% | 0.051%(+0.751)#5 | 0.056%(+0.746)#157 |
| 6. | Edwardsville | 0.75% | 0.051%(+0.696)#6 | 0.056%(+0.692)#167 |
| 7. | Evanston | 0.62% | 0.051%(+0.573)#7 | 0.056%(+0.569)#210 |
| 8. | Worth | 0.49% | 0.051%(+0.437)#8 | 0.056%(+0.432)#271 |
| 9. | Hindsboro | 0.49% | 0.051%(+0.436)#9 | 0.056%(+0.432)#273 |
| 10. | Oakland | 0.43% | 0.051%(+0.381)#10 | 0.056%(+0.376)#300 |
| 11. | Richton Park | 0.38% | 0.051%(+0.326)#11 | 0.056%(+0.321)#335 |
| 12. | Waukegan | 0.36% | 0.051%(+0.304)#12 | 0.056%(+0.300)#351 |
| 13. | Maywood | 0.30% | 0.051%(+0.252)#13 | 0.056%(+0.248)#383 |
| 14. | Lisle | 0.29% | 0.051%(+0.238)#14 | 0.056%(+0.233)#392 |
| 15. | Collinsville | 0.26% | 0.051%(+0.212)#15 | 0.056%(+0.207)#419 |
| 16. | Bolingbrook | 0.26% | 0.051%(+0.209)#16 | 0.056%(+0.204)#423 |
| 17. | Shiloh | 0.24% | 0.051%(+0.186)#17 | 0.056%(+0.182)#448 |
| 18. | Riverdale | 0.22% | 0.051%(+0.167)#18 | 0.056%(+0.162)#475 |
| 19. | Glen Carbon | 0.21% | 0.051%(+0.161)#19 | 0.056%(+0.156)#487 |
| 20. | Hanover Park | 0.17% | 0.051%(+0.123)#20 | 0.056%(+0.119)#542 |
| 21. | Charleston | 0.16% | 0.051%(+0.112)#21 | 0.056%(+0.107)#560 |
| 22. | Dekalb | 0.16% | 0.051%(+0.106)#22 | 0.056%(+0.101)#570 |
| 23. | Urbana | 0.14% | 0.051%(+0.088)#23 | 0.056%(+0.083)#609 |
| 24. | Prospect Heights | 0.14% | 0.051%(+0.087)#24 | 0.056%(+0.083)#611 |
| 25. | Joliet | 0.13% | 0.051%(+0.079)#25 | 0.056%(+0.074)#628 |
| 26. | Lombard | 0.12% | 0.051%(+0.069)#26 | 0.056%(+0.064)#654 |
| 27. | Grayslake | 0.12% | 0.051%(+0.069)#27 | 0.056%(+0.064)#655 |
| 28. | Carbondale | 0.11% | 0.051%(+0.058)#28 | 0.056%(+0.053)#686 |
| 29. | Savoy | 0.10% | 0.051%(+0.052)#29 | 0.056%(+0.048)#699 |
| 30. | Montgomery | 0.097% | 0.051%(+0.046)#30 | 0.056%(+0.041)#719 |
| 31. | Chicago | 0.097% | 0.051%(+0.045)#31 | 0.056%(+0.041)#720 |
| 32. | Evergreen Park | 0.091% | 0.051%(+0.040)#32 | 0.056%(+0.035)#748 |
| 33. | Lake In The Hills | 0.079% | 0.051%(+0.028)#33 | 0.056%(+0.023)#799 |
| 34. | Glenview | 0.079% | 0.051%(+0.028)#34 | 0.056%(+0.023)#801 |
| 35. | Belvidere | 0.079% | 0.051%(+0.027)#35 | 0.056%(+0.023)#806 |
| 36. | Oak Park | 0.078% | 0.051%(+0.027)#36 | 0.056%(+0.022)#809 |
| 37. | Crest Hill | 0.070% | 0.051%(+0.019)#37 | 0.056%(+0.014)#838 |
| 38. | Elgin | 0.067% | 0.051%(+0.016)#38 | 0.056%(+0.011)#851 |
| 39. | Park Forest | 0.067% | 0.051%(+0.015)#39 | 0.056%(+0.011)#858 |
| 40. | Villa Park | 0.062% | 0.051%(+0.010)#40 | 0.056%(+0.006)#883 |
| 41. | Homewood | 0.060% | 0.051%(+0.009)#41 | 0.056%(+0.004)#886 |
| 42. | Downers Grove | 0.056% | 0.051%(+0.005)#42 | 0.056%(+0.000)#903 |
| 43. | Rock Island | 0.054% | 0.051%(+0.002)#43 | 0.056%(-0.002)#914 |
| 44. | Peoria | 0.048% | 0.051%(-0.004)#44 | 0.056%(-0.008)#939 |
| 45. | Addison | 0.048% | 0.051%(-0.004)#45 | 0.056%(-0.008)#940 |
| 46. | O Fallon | 0.040% | 0.051%(-0.011)#46 | 0.056%(-0.015)#985 |
| 47. | Galesburg | 0.037% | 0.051%(-0.015)#47 | 0.056%(-0.019)#1,009 |
| 48. | Schaumburg | 0.035% | 0.051%(-0.017)#48 | 0.056%(-0.021)#1,026 |
| 49. | Bradley | 0.033% | 0.051%(-0.019)#49 | 0.056%(-0.023)#1,045 |
| 50. | Palatine | 0.030% | 0.051%(-0.022)#50 | 0.056%(-0.026)#1,062 |
| 51. | Skokie | 0.025% | 0.051%(-0.026)#51 | 0.056%(-0.031)#1,095 |
| 52. | Berwyn | 0.023% | 0.051%(-0.028)#52 | 0.056%(-0.033)#1,114 |
| 53. | Rockford | 0.019% | 0.051%(-0.032)#53 | 0.056%(-0.037)#1,143 |
| 54. | Wheaton | 0.017% | 0.051%(-0.035)#54 | 0.056%(-0.039)#1,163 |
| 55. | Naperville | 0.013% | 0.051%(-0.038)#55 | 0.056%(-0.043)#1,188 |
| 56. | Elmhurst | 0.011% | 0.051%(-0.040)#56 | 0.056%(-0.045)#1,213 |
| 57. | Springfield | 0.011% | 0.051%(-0.041)#57 | 0.056%(-0.045)#1,215 |
| 58. | Decatur | 0.0070% | 0.051%(-0.044)#58 | 0.056%(-0.049)#1,244 |
| 59. | Champaign | 0.0056% | 0.051%(-0.046)#59 | 0.056%(-0.050)#1,255 |
Common Questions
What are the Top 10 Cities with the Highest Percentage of Ghanaian Population in Illinois?
Top 10 Cities with the Highest Percentage of Ghanaian Population in Illinois are:
#1
1.85%
#2
1.23%
#3
1.02%
#4
0.81%
#5
0.80%
#6
0.75%
#7
0.62%
#8
0.49%
#9
0.49%
#10
0.43%
What city has the Highest Percentage of Ghanaian Population in Illinois?
Woodridge has the Highest Percentage of Ghanaian Population in Illinois with 1.85%.
What is the Percentage of Ghanaian Population in the State of Illinois?
Percentage of Ghanaian Population in Illinois is 0.051%.
What is the Percentage of Ghanaian Population in the United States?
Percentage of Ghanaian Population in the United States is 0.056%.