Cities with the Highest Percentage of Ghanaian Population in New York
RELATED REPORTS & OPTIONS
Ghanaian
New York
Compare Cities
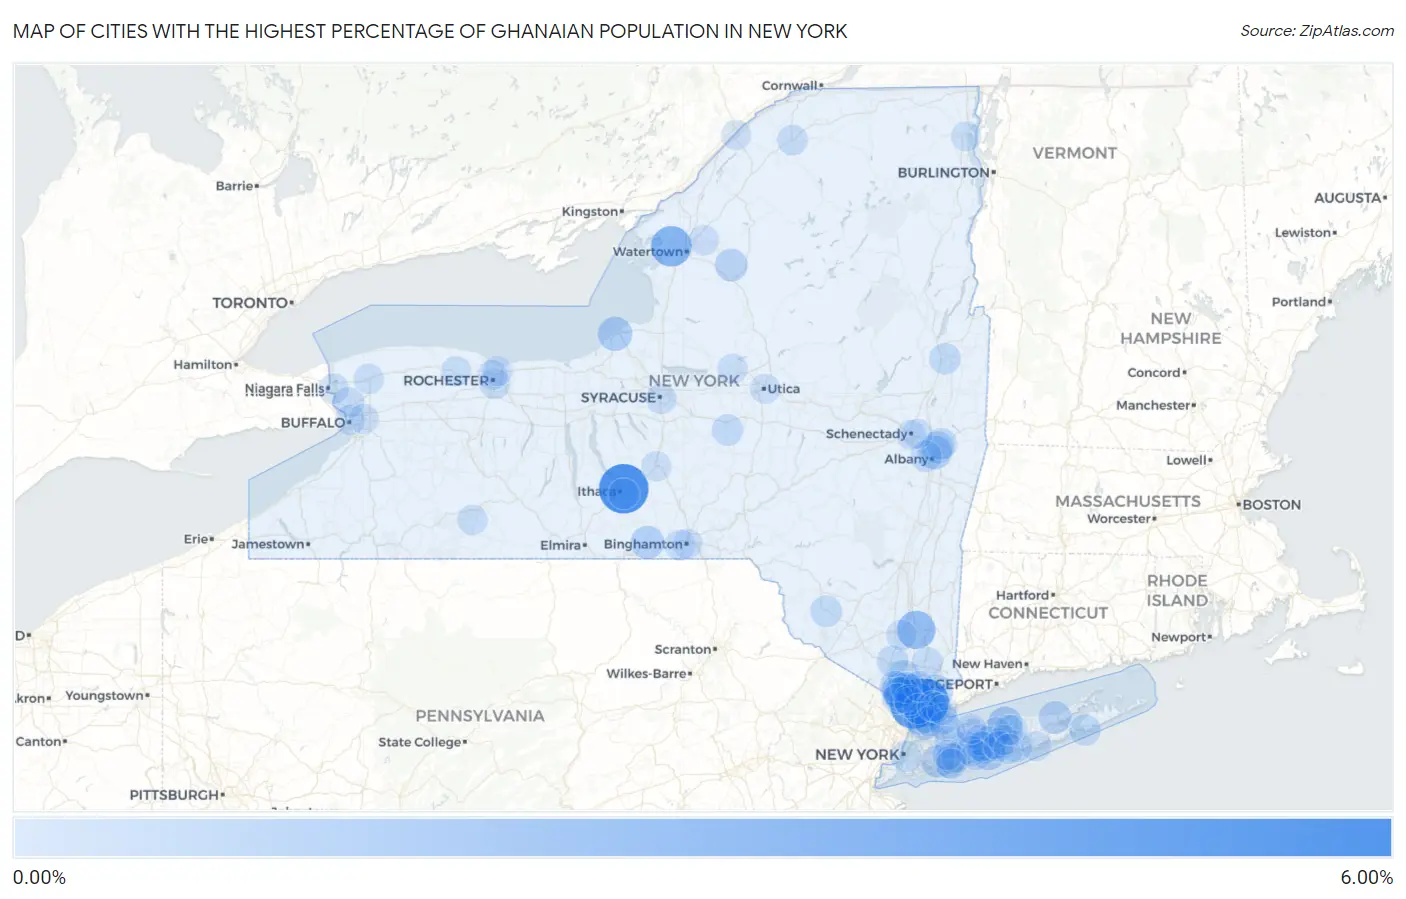
Map of Cities with the Highest Percentage of Ghanaian Population in New York
0.00%
6.00%
Cities with the Highest Percentage of Ghanaian Population in New York
| City | Ghanaian | vs State | vs National | |
| 1. | Forest Home | 5.69% | 0.18%(+5.51)#1 | 0.056%(+5.64)#8 |
| 2. | Elmsford | 5.26% | 0.18%(+5.08)#2 | 0.056%(+5.20)#11 |
| 3. | Piermont | 5.03% | 0.18%(+4.85)#3 | 0.056%(+4.97)#14 |
| 4. | Dexter | 3.01% | 0.18%(+2.84)#4 | 0.056%(+2.96)#31 |
| 5. | Fishkill | 2.39% | 0.18%(+2.21)#5 | 0.056%(+2.33)#40 |
| 6. | Valley Cottage | 2.02% | 0.18%(+1.84)#6 | 0.056%(+1.96)#52 |
| 7. | Hillcrest | 1.85% | 0.18%(+1.67)#7 | 0.056%(+1.79)#60 |
| 8. | Nanuet | 1.69% | 0.18%(+1.51)#8 | 0.056%(+1.63)#63 |
| 9. | Hartwick Seminary | 1.37% | 0.18%(+1.20)#9 | 0.056%(+1.32)#86 |
| 10. | Brentwood | 1.29% | 0.18%(+1.11)#10 | 0.056%(+1.23)#102 |
| 11. | Stony Brook University | 1.25% | 0.18%(+1.07)#11 | 0.056%(+1.19)#107 |
| 12. | Suny Oswego | 1.20% | 0.18%(+1.02)#12 | 0.056%(+1.14)#109 |
| 13. | Menands | 0.98% | 0.18%(+0.797)#13 | 0.056%(+0.919)#133 |
| 14. | Owego | 0.94% | 0.18%(+0.758)#14 | 0.056%(+0.880)#136 |
| 15. | Armonk | 0.91% | 0.18%(+0.736)#15 | 0.056%(+0.858)#141 |
| 16. | Brightwaters | 0.79% | 0.18%(+0.608)#16 | 0.056%(+0.730)#161 |
| 17. | Castorland | 0.74% | 0.18%(+0.567)#17 | 0.056%(+0.688)#169 |
| 18. | Mount Vernon | 0.73% | 0.18%(+0.556)#18 | 0.056%(+0.677)#174 |
| 19. | Riverhead | 0.72% | 0.18%(+0.545)#19 | 0.056%(+0.667)#178 |
| 20. | Valley Stream | 0.72% | 0.18%(+0.542)#20 | 0.056%(+0.664)#179 |
| 21. | Old Bethpage | 0.69% | 0.18%(+0.514)#21 | 0.056%(+0.636)#183 |
| 22. | Stony Point | 0.65% | 0.18%(+0.476)#22 | 0.056%(+0.598)#197 |
| 23. | Baywood | 0.64% | 0.18%(+0.462)#23 | 0.056%(+0.584)#203 |
| 24. | Watervliet | 0.57% | 0.18%(+0.394)#24 | 0.056%(+0.515)#233 |
| 25. | Yonkers | 0.55% | 0.18%(+0.377)#25 | 0.056%(+0.498)#240 |
| 26. | Old Westbury | 0.52% | 0.18%(+0.344)#26 | 0.056%(+0.466)#250 |
| 27. | Monticello | 0.43% | 0.18%(+0.251)#27 | 0.056%(+0.373)#302 |
| 28. | Patchogue | 0.41% | 0.18%(+0.235)#28 | 0.056%(+0.357)#310 |
| 29. | Troy | 0.40% | 0.18%(+0.222)#29 | 0.056%(+0.344)#320 |
| 30. | Woodbury | 0.40% | 0.18%(+0.218)#30 | 0.056%(+0.340)#323 |
| 31. | Rye | 0.36% | 0.18%(+0.187)#31 | 0.056%(+0.309)#344 |
| 32. | Hamilton | 0.36% | 0.18%(+0.183)#32 | 0.056%(+0.305)#346 |
| 33. | Southampton | 0.36% | 0.18%(+0.179)#33 | 0.056%(+0.301)#350 |
| 34. | South Glens Falls | 0.35% | 0.18%(+0.170)#34 | 0.056%(+0.292)#356 |
| 35. | Albany | 0.35% | 0.18%(+0.169)#35 | 0.056%(+0.291)#357 |
| 36. | New York | 0.32% | 0.18%(+0.143)#36 | 0.056%(+0.264)#372 |
| 37. | Eastchester | 0.30% | 0.18%(+0.123)#37 | 0.056%(+0.245)#385 |
| 38. | Wesley Hills | 0.24% | 0.18%(+0.067)#38 | 0.056%(+0.189)#439 |
| 39. | East Ithaca | 0.23% | 0.18%(+0.056)#39 | 0.056%(+0.178)#453 |
| 40. | Spring Valley | 0.23% | 0.18%(+0.056)#40 | 0.056%(+0.178)#455 |
| 41. | Brighton | 0.21% | 0.18%(+0.037)#41 | 0.056%(+0.159)#484 |
| 42. | Jefferson Valley Yorktown | 0.21% | 0.18%(+0.028)#42 | 0.056%(+0.150)#494 |
| 43. | Huntington Station | 0.20% | 0.18%(+0.022)#43 | 0.056%(+0.144)#501 |
| 44. | Potsdam | 0.20% | 0.18%(+0.021)#44 | 0.056%(+0.142)#505 |
| 45. | Baldwin | 0.20% | 0.18%(+0.021)#45 | 0.056%(+0.142)#506 |
| 46. | Tonawanda | 0.19% | 0.18%(+0.009)#46 | 0.056%(+0.131)#523 |
| 47. | Orangeburg | 0.17% | 0.18%(-0.009)#47 | 0.056%(+0.113)#548 |
| 48. | Roosevelt | 0.17% | 0.18%(-0.011)#48 | 0.056%(+0.110)#556 |
| 49. | New City | 0.16% | 0.18%(-0.015)#49 | 0.056%(+0.107)#562 |
| 50. | Dix Hills | 0.16% | 0.18%(-0.020)#50 | 0.056%(+0.102)#568 |
| 51. | Binghamton University | 0.16% | 0.18%(-0.022)#51 | 0.056%(+0.100)#573 |
| 52. | Central Islip | 0.15% | 0.18%(-0.030)#52 | 0.056%(+0.092)#587 |
| 53. | Chestnut Ridge | 0.15% | 0.18%(-0.033)#53 | 0.056%(+0.089)#592 |
| 54. | Syracuse | 0.13% | 0.18%(-0.052)#54 | 0.056%(+0.070)#643 |
| 55. | Selden | 0.12% | 0.18%(-0.058)#55 | 0.056%(+0.064)#658 |
| 56. | Village Of The Branch | 0.11% | 0.18%(-0.063)#56 | 0.056%(+0.058)#674 |
| 57. | Alfred | 0.11% | 0.18%(-0.069)#57 | 0.056%(+0.053)#685 |
| 58. | Fort Drum | 0.098% | 0.18%(-0.080)#58 | 0.056%(+0.042)#712 |
| 59. | Blauvelt | 0.097% | 0.18%(-0.081)#59 | 0.056%(+0.041)#718 |
| 60. | Newburgh | 0.094% | 0.18%(-0.084)#60 | 0.056%(+0.038)#731 |
| 61. | North Bellmore | 0.090% | 0.18%(-0.088)#61 | 0.056%(+0.034)#754 |
| 62. | Ossining | 0.081% | 0.18%(-0.097)#62 | 0.056%(+0.025)#791 |
| 63. | Lockport | 0.072% | 0.18%(-0.106)#63 | 0.056%(+0.016)#833 |
| 64. | New Rochelle | 0.072% | 0.18%(-0.106)#64 | 0.056%(+0.016)#834 |
| 65. | Brockport | 0.070% | 0.18%(-0.108)#65 | 0.056%(+0.014)#841 |
| 66. | Glen Cove | 0.068% | 0.18%(-0.110)#66 | 0.056%(+0.012)#849 |
| 67. | Niagara Falls | 0.056% | 0.18%(-0.122)#67 | 0.056%(-0.000)#904 |
| 68. | Hempstead | 0.055% | 0.18%(-0.123)#68 | 0.056%(-0.001)#909 |
| 69. | Dobbs Ferry | 0.052% | 0.18%(-0.125)#69 | 0.056%(-0.003)#920 |
| 70. | Binghamton | 0.050% | 0.18%(-0.127)#70 | 0.056%(-0.006)#925 |
| 71. | East Farmingdale | 0.050% | 0.18%(-0.128)#71 | 0.056%(-0.006)#928 |
| 72. | Buffalo | 0.048% | 0.18%(-0.129)#72 | 0.056%(-0.008)#936 |
| 73. | Cortland | 0.046% | 0.18%(-0.132)#73 | 0.056%(-0.010)#956 |
| 74. | Deer Park | 0.044% | 0.18%(-0.134)#74 | 0.056%(-0.012)#967 |
| 75. | Plattsburgh | 0.040% | 0.18%(-0.138)#75 | 0.056%(-0.016)#987 |
| 76. | West Babylon | 0.040% | 0.18%(-0.138)#76 | 0.056%(-0.016)#991 |
| 77. | Rochester | 0.036% | 0.18%(-0.142)#77 | 0.056%(-0.020)#1,016 |
| 78. | Freeport | 0.034% | 0.18%(-0.144)#78 | 0.056%(-0.022)#1,036 |
| 79. | Ronkonkoma | 0.032% | 0.18%(-0.146)#79 | 0.056%(-0.024)#1,049 |
| 80. | Ogdensburg | 0.030% | 0.18%(-0.147)#80 | 0.056%(-0.026)#1,059 |
| 81. | Harrison | 0.028% | 0.18%(-0.150)#81 | 0.056%(-0.028)#1,078 |
| 82. | North Great River | 0.027% | 0.18%(-0.151)#82 | 0.056%(-0.029)#1,084 |
| 83. | White Plains | 0.027% | 0.18%(-0.151)#83 | 0.056%(-0.029)#1,086 |
| 84. | Utica | 0.026% | 0.18%(-0.152)#84 | 0.056%(-0.030)#1,089 |
| 85. | Niskayuna | 0.024% | 0.18%(-0.154)#85 | 0.056%(-0.032)#1,104 |
| 86. | Huntington | 0.020% | 0.18%(-0.157)#86 | 0.056%(-0.036)#1,130 |
| 87. | Irondequoit | 0.014% | 0.18%(-0.164)#87 | 0.056%(-0.042)#1,184 |
| 88. | Rome | 0.012% | 0.18%(-0.165)#88 | 0.056%(-0.043)#1,197 |
| 89. | Centereach | 0.0094% | 0.18%(-0.168)#89 | 0.056%(-0.047)#1,225 |
| 90. | Cheektowaga | 0.0092% | 0.18%(-0.169)#90 | 0.056%(-0.047)#1,226 |
| 91. | Schenectady | 0.0073% | 0.18%(-0.170)#91 | 0.056%(-0.049)#1,241 |
| 92. | Port Chester | 0.0064% | 0.18%(-0.171)#92 | 0.056%(-0.050)#1,248 |
| 93. | Sayville | 0.0062% | 0.18%(-0.172)#93 | 0.056%(-0.050)#1,250 |
| 94. | Mastic Beach | 0.0062% | 0.18%(-0.172)#94 | 0.056%(-0.050)#1,251 |
Common Questions
What are the Top 10 Cities with the Highest Percentage of Ghanaian Population in New York?
Top 10 Cities with the Highest Percentage of Ghanaian Population in New York are:
#1
5.69%
#2
5.26%
#3
5.03%
#4
3.01%
#5
2.39%
#6
2.02%
#7
1.85%
#8
1.69%
#9
1.29%
#10
1.25%
What city has the Highest Percentage of Ghanaian Population in New York?
Forest Home has the Highest Percentage of Ghanaian Population in New York with 5.69%.
What is the Percentage of Ghanaian Population in the State of New York?
Percentage of Ghanaian Population in New York is 0.18%.
What is the Percentage of Ghanaian Population in the United States?
Percentage of Ghanaian Population in the United States is 0.056%.