Cities with the Highest Percentage of Ghanaian Population in Maryland
RELATED REPORTS & OPTIONS
Ghanaian
Maryland
Compare Cities
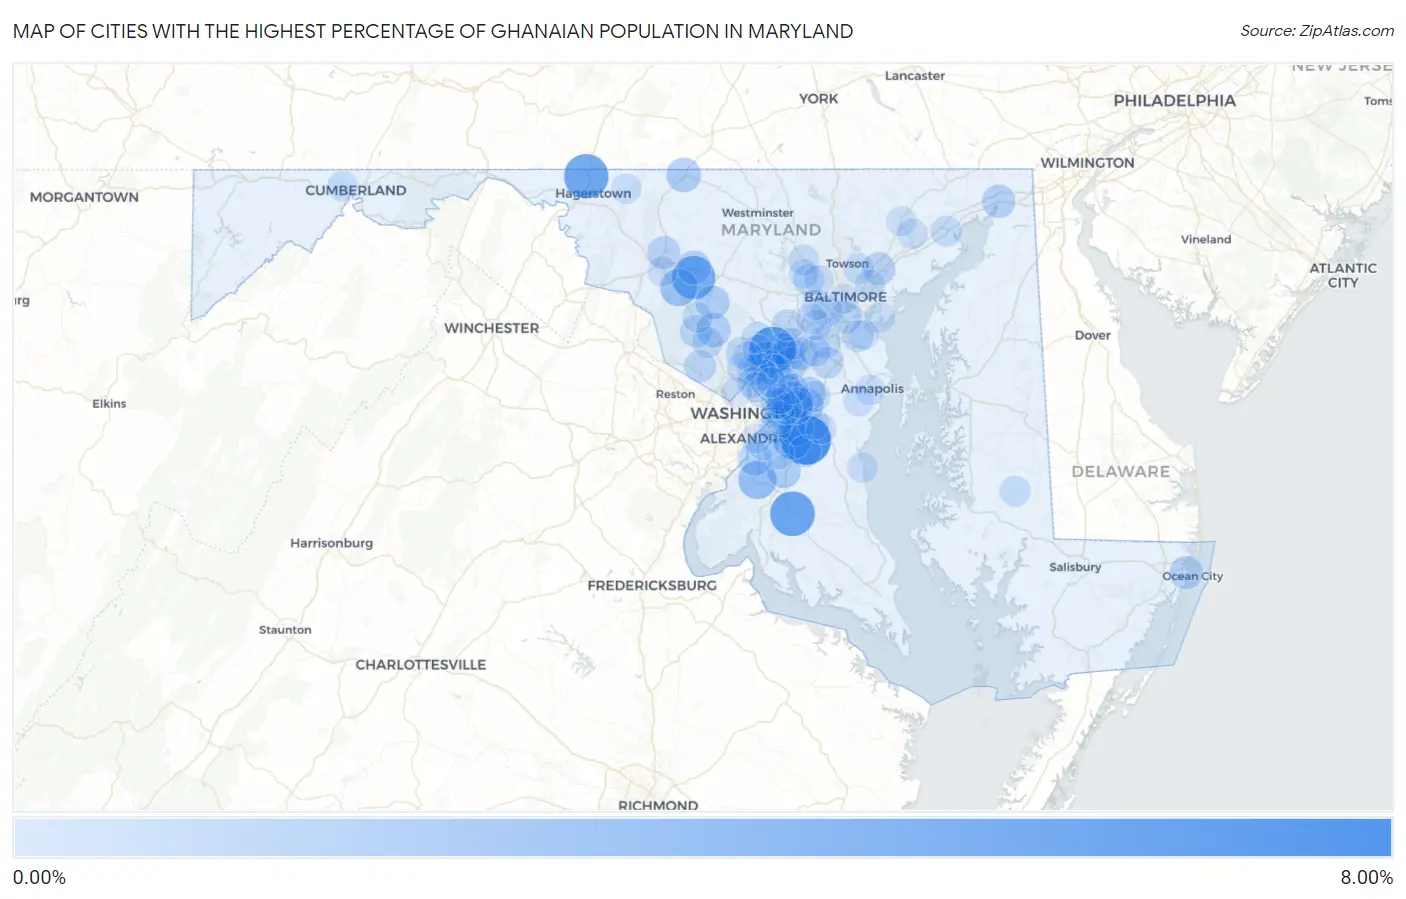
Map of Cities with the Highest Percentage of Ghanaian Population in Maryland
0.00%
8.00%
Cities with the Highest Percentage of Ghanaian Population in Maryland
| City | Ghanaian | vs State | vs National | |
| 1. | Queensland | 6.24% | 0.26%(+5.99)#1 | 0.056%(+6.19)#4 |
| 2. | Burtonsville | 5.23% | 0.26%(+4.98)#2 | 0.056%(+5.18)#12 |
| 3. | Bryantown | 4.68% | 0.26%(+4.42)#3 | 0.056%(+4.62)#16 |
| 4. | Maugansville | 4.62% | 0.26%(+4.36)#4 | 0.056%(+4.56)#18 |
| 5. | Monrovia | 4.19% | 0.26%(+3.94)#5 | 0.056%(+4.14)#20 |
| 6. | Melwood | 2.62% | 0.26%(+2.36)#6 | 0.056%(+2.56)#34 |
| 7. | Accokeek | 2.60% | 0.26%(+2.35)#7 | 0.056%(+2.55)#35 |
| 8. | Springdale | 2.53% | 0.26%(+2.27)#8 | 0.056%(+2.47)#37 |
| 9. | Urbana | 2.37% | 0.26%(+2.11)#9 | 0.056%(+2.31)#41 |
| 10. | New Carrollton | 2.13% | 0.26%(+1.87)#10 | 0.056%(+2.07)#46 |
| 11. | Fairland | 2.09% | 0.26%(+1.83)#11 | 0.056%(+2.04)#48 |
| 12. | Honeygo | 1.61% | 0.26%(+1.35)#12 | 0.056%(+1.55)#70 |
| 13. | Emmitsburg | 1.49% | 0.26%(+1.23)#13 | 0.056%(+1.43)#78 |
| 14. | New Market | 1.37% | 0.26%(+1.11)#14 | 0.056%(+1.31)#87 |
| 15. | Montgomery Village | 1.36% | 0.26%(+1.10)#15 | 0.056%(+1.30)#90 |
| 16. | Peppermill Village | 1.35% | 0.26%(+1.09)#16 | 0.056%(+1.29)#92 |
| 17. | Damascus | 1.32% | 0.26%(+1.07)#17 | 0.056%(+1.27)#94 |
| 18. | Westphalia | 1.31% | 0.26%(+1.05)#18 | 0.056%(+1.25)#96 |
| 19. | Woodmore | 1.30% | 0.26%(+1.04)#19 | 0.056%(+1.25)#97 |
| 20. | Fairwood | 1.29% | 0.26%(+1.04)#20 | 0.056%(+1.24)#100 |
| 21. | Brandywine | 1.29% | 0.26%(+1.03)#21 | 0.056%(+1.23)#101 |
| 22. | Fort Washington | 1.28% | 0.26%(+1.02)#22 | 0.056%(+1.23)#103 |
| 23. | Lake Arbor | 1.19% | 0.26%(+0.929)#23 | 0.056%(+1.13)#111 |
| 24. | Calverton | 1.17% | 0.26%(+0.915)#24 | 0.056%(+1.12)#113 |
| 25. | Capitol Heights | 1.17% | 0.26%(+0.907)#25 | 0.056%(+1.11)#114 |
| 26. | North East | 1.11% | 0.26%(+0.850)#26 | 0.056%(+1.05)#121 |
| 27. | Frederick | 1.07% | 0.26%(+0.813)#27 | 0.056%(+1.02)#123 |
| 28. | West Ocean City | 1.07% | 0.26%(+0.809)#28 | 0.056%(+1.01)#124 |
| 29. | Laurel | 1.03% | 0.26%(+0.776)#29 | 0.056%(+0.978)#126 |
| 30. | White Marsh | 1.02% | 0.26%(+0.757)#30 | 0.056%(+0.960)#128 |
| 31. | Greenbelt | 0.99% | 0.26%(+0.735)#31 | 0.056%(+0.938)#129 |
| 32. | Maryland City | 0.94% | 0.26%(+0.679)#32 | 0.056%(+0.882)#135 |
| 33. | Brooklyn Park | 0.89% | 0.26%(+0.634)#33 | 0.056%(+0.837)#144 |
| 34. | Germantown | 0.86% | 0.26%(+0.606)#34 | 0.056%(+0.809)#149 |
| 35. | South Laurel | 0.83% | 0.26%(+0.568)#35 | 0.056%(+0.771)#153 |
| 36. | Suitland | 0.78% | 0.26%(+0.523)#36 | 0.056%(+0.726)#163 |
| 37. | Marlton | 0.75% | 0.26%(+0.489)#37 | 0.056%(+0.691)#168 |
| 38. | Travilah | 0.74% | 0.26%(+0.479)#38 | 0.056%(+0.682)#171 |
| 39. | Severn | 0.74% | 0.26%(+0.477)#39 | 0.056%(+0.679)#173 |
| 40. | Burnt Mills | 0.70% | 0.26%(+0.442)#40 | 0.056%(+0.645)#182 |
| 41. | North Laurel | 0.68% | 0.26%(+0.425)#41 | 0.056%(+0.628)#185 |
| 42. | Landover | 0.68% | 0.26%(+0.425)#42 | 0.056%(+0.628)#186 |
| 43. | Odenton | 0.68% | 0.26%(+0.421)#43 | 0.056%(+0.624)#188 |
| 44. | White Oak | 0.63% | 0.26%(+0.374)#44 | 0.056%(+0.577)#205 |
| 45. | West Laurel | 0.60% | 0.26%(+0.342)#45 | 0.056%(+0.544)#219 |
| 46. | Pasadena | 0.60% | 0.26%(+0.338)#46 | 0.056%(+0.541)#223 |
| 47. | Columbia | 0.58% | 0.26%(+0.323)#47 | 0.056%(+0.526)#228 |
| 48. | Milford Mill | 0.57% | 0.26%(+0.313)#48 | 0.056%(+0.515)#234 |
| 49. | Beltsville | 0.57% | 0.26%(+0.310)#49 | 0.056%(+0.512)#235 |
| 50. | Hillandale | 0.56% | 0.26%(+0.301)#50 | 0.056%(+0.504)#237 |
| 51. | Brock Hall | 0.54% | 0.26%(+0.284)#51 | 0.056%(+0.487)#242 |
| 52. | Summerfield | 0.52% | 0.26%(+0.262)#52 | 0.056%(+0.465)#252 |
| 53. | Ten Mile Creek | 0.52% | 0.26%(+0.260)#53 | 0.056%(+0.463)#253 |
| 54. | Ashton Sandy Spring | 0.50% | 0.26%(+0.243)#54 | 0.056%(+0.446)#265 |
| 55. | Leisure World | 0.49% | 0.26%(+0.232)#55 | 0.056%(+0.434)#269 |
| 56. | Gaithersburg | 0.48% | 0.26%(+0.222)#56 | 0.056%(+0.425)#274 |
| 57. | Fort Meade | 0.48% | 0.26%(+0.221)#57 | 0.056%(+0.423)#275 |
| 58. | Arbutus | 0.48% | 0.26%(+0.218)#58 | 0.056%(+0.421)#276 |
| 59. | Kemp Mill | 0.47% | 0.26%(+0.210)#59 | 0.056%(+0.412)#281 |
| 60. | Wheaton | 0.45% | 0.26%(+0.196)#60 | 0.056%(+0.399)#289 |
| 61. | Hurlock | 0.44% | 0.26%(+0.179)#61 | 0.056%(+0.382)#296 |
| 62. | Chillum | 0.44% | 0.26%(+0.179)#62 | 0.056%(+0.381)#298 |
| 63. | Bowie | 0.42% | 0.26%(+0.161)#63 | 0.056%(+0.364)#306 |
| 64. | Oxon Hill | 0.40% | 0.26%(+0.146)#64 | 0.056%(+0.349)#316 |
| 65. | Clinton | 0.40% | 0.26%(+0.139)#65 | 0.056%(+0.342)#322 |
| 66. | Seabrook | 0.39% | 0.26%(+0.129)#66 | 0.056%(+0.331)#330 |
| 67. | Owings Mills | 0.39% | 0.26%(+0.127)#67 | 0.056%(+0.330)#332 |
| 68. | Wildewood | 0.38% | 0.26%(+0.118)#68 | 0.056%(+0.321)#336 |
| 69. | Cheverly | 0.38% | 0.26%(+0.117)#69 | 0.056%(+0.319)#337 |
| 70. | Aberdeen | 0.37% | 0.26%(+0.113)#70 | 0.056%(+0.315)#340 |
| 71. | Woodlawn Cdp Baltimore County | 0.34% | 0.26%(+0.080)#71 | 0.056%(+0.283)#361 |
| 72. | Ilchester | 0.33% | 0.26%(+0.071)#72 | 0.056%(+0.274)#362 |
| 73. | Elkridge | 0.33% | 0.26%(+0.070)#73 | 0.056%(+0.273)#364 |
| 74. | Parkville | 0.30% | 0.26%(+0.046)#74 | 0.056%(+0.249)#382 |
| 75. | Silver Spring | 0.30% | 0.26%(+0.040)#75 | 0.056%(+0.242)#387 |
| 76. | Rosedale | 0.29% | 0.26%(+0.031)#76 | 0.056%(+0.233)#393 |
| 77. | Mitchellville | 0.28% | 0.26%(+0.022)#77 | 0.056%(+0.225)#403 |
| 78. | Clarksburg | 0.26% | 0.26%(-0.001)#78 | 0.056%(+0.202)#427 |
| 79. | Friendship Heights Village | 0.25% | 0.26%(-0.004)#79 | 0.056%(+0.199)#428 |
| 80. | Edgewater | 0.25% | 0.26%(-0.012)#80 | 0.056%(+0.190)#437 |
| 81. | Bel Air South | 0.24% | 0.26%(-0.015)#81 | 0.056%(+0.187)#440 |
| 82. | Annapolis | 0.24% | 0.26%(-0.015)#82 | 0.056%(+0.187)#441 |
| 83. | Marlboro Meadows | 0.24% | 0.26%(-0.019)#83 | 0.056%(+0.184)#445 |
| 84. | Cloverly | 0.24% | 0.26%(-0.021)#84 | 0.056%(+0.181)#449 |
| 85. | Edgemere | 0.23% | 0.26%(-0.033)#85 | 0.056%(+0.169)#464 |
| 86. | Ballenger Creek | 0.21% | 0.26%(-0.045)#86 | 0.056%(+0.158)#486 |
| 87. | Takoma Park | 0.21% | 0.26%(-0.048)#87 | 0.056%(+0.155)#488 |
| 88. | Smithsburg | 0.20% | 0.26%(-0.060)#88 | 0.056%(+0.142)#507 |
| 89. | North Beach | 0.19% | 0.26%(-0.070)#89 | 0.056%(+0.133)#520 |
| 90. | Landover Hills | 0.19% | 0.26%(-0.070)#90 | 0.056%(+0.133)#521 |
| 91. | College Park | 0.19% | 0.26%(-0.073)#91 | 0.056%(+0.130)#524 |
| 92. | La Vale | 0.18% | 0.26%(-0.075)#92 | 0.056%(+0.128)#526 |
| 93. | Catonsville | 0.16% | 0.26%(-0.095)#93 | 0.056%(+0.108)#559 |
| 94. | Forest Heights | 0.15% | 0.26%(-0.107)#94 | 0.056%(+0.095)#583 |
| 95. | Layhill | 0.14% | 0.26%(-0.123)#95 | 0.056%(+0.080)#613 |
| 96. | Riviera Beach | 0.13% | 0.26%(-0.127)#96 | 0.056%(+0.076)#621 |
| 97. | Baltimore | 0.13% | 0.26%(-0.133)#97 | 0.056%(+0.069)#644 |
| 98. | Bel Air North | 0.12% | 0.26%(-0.134)#98 | 0.056%(+0.069)#645 |
| 99. | Randallstown | 0.12% | 0.26%(-0.143)#99 | 0.056%(+0.060)#671 |
| 100. | Lochearn | 0.11% | 0.26%(-0.151)#100 | 0.056%(+0.051)#689 |
Common Questions
What are the Top 10 Cities with the Highest Percentage of Ghanaian Population in Maryland?
Top 10 Cities with the Highest Percentage of Ghanaian Population in Maryland are:
#1
6.24%
#2
5.23%
#3
4.68%
#4
4.62%
#5
4.19%
#6
2.62%
#7
2.60%
#8
2.53%
#9
2.37%
#10
2.13%
What city has the Highest Percentage of Ghanaian Population in Maryland?
Queensland has the Highest Percentage of Ghanaian Population in Maryland with 6.24%.
What is the Percentage of Ghanaian Population in the State of Maryland?
Percentage of Ghanaian Population in Maryland is 0.26%.
What is the Percentage of Ghanaian Population in the United States?
Percentage of Ghanaian Population in the United States is 0.056%.