Cities with the Highest Percentage of Ghanaian Population in Virginia
RELATED REPORTS & OPTIONS
Ghanaian
Virginia
Compare Cities
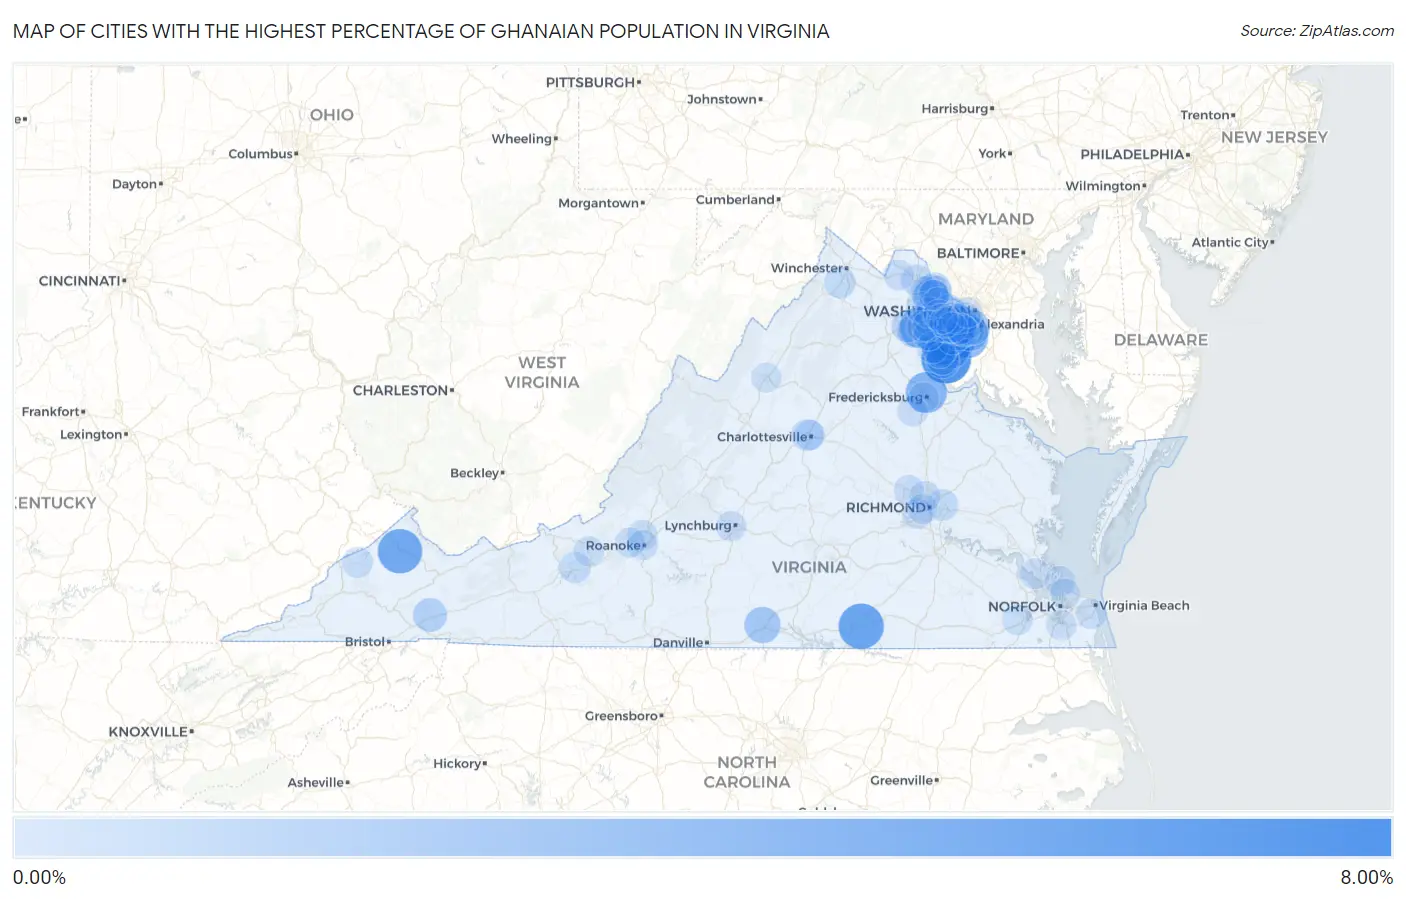
Map of Cities with the Highest Percentage of Ghanaian Population in Virginia
0.00%
8.00%
Cities with the Highest Percentage of Ghanaian Population in Virginia
| City | Ghanaian | vs State | vs National | |
| 1. | Leesylvania | 6.21% | 0.20%(+6.01)#1 | 0.056%(+6.15)#5 |
| 2. | Cherry Hill | 6.00% | 0.20%(+5.80)#2 | 0.056%(+5.95)#7 |
| 3. | Brodnax | 4.66% | 0.20%(+4.45)#3 | 0.056%(+4.60)#17 |
| 4. | Vansant | 4.37% | 0.20%(+4.16)#4 | 0.056%(+4.31)#19 |
| 5. | Woodlawn Cdp Fairfax County | 3.64% | 0.20%(+3.44)#5 | 0.056%(+3.58)#21 |
| 6. | Bull Run | 3.35% | 0.20%(+3.14)#6 | 0.056%(+3.29)#23 |
| 7. | County Center | 3.33% | 0.20%(+3.13)#7 | 0.056%(+3.27)#24 |
| 8. | Falmouth | 3.33% | 0.20%(+3.12)#8 | 0.056%(+3.27)#25 |
| 9. | Mount Vernon | 3.32% | 0.20%(+3.12)#9 | 0.056%(+3.27)#26 |
| 10. | Lorton | 3.28% | 0.20%(+3.08)#10 | 0.056%(+3.22)#27 |
| 11. | Woodbridge | 3.02% | 0.20%(+2.81)#11 | 0.056%(+2.96)#30 |
| 12. | Hybla Valley | 2.01% | 0.20%(+1.80)#12 | 0.056%(+1.95)#54 |
| 13. | Oak Grove | 1.93% | 0.20%(+1.73)#13 | 0.056%(+1.88)#56 |
| 14. | Dale City | 1.87% | 0.20%(+1.67)#14 | 0.056%(+1.82)#57 |
| 15. | South Boston | 1.84% | 0.20%(+1.63)#15 | 0.056%(+1.78)#61 |
| 16. | Lake Ridge | 1.60% | 0.20%(+1.40)#16 | 0.056%(+1.54)#71 |
| 17. | Belle Haven | 1.43% | 0.20%(+1.23)#17 | 0.056%(+1.38)#81 |
| 18. | Triangle | 1.19% | 0.20%(+0.981)#18 | 0.056%(+1.13)#112 |
| 19. | Emory | 1.14% | 0.20%(+0.937)#19 | 0.056%(+1.08)#118 |
| 20. | Newington | 0.98% | 0.20%(+0.777)#20 | 0.056%(+0.925)#130 |
| 21. | Springfield | 0.89% | 0.20%(+0.689)#21 | 0.056%(+0.837)#145 |
| 22. | Dulles Town Center | 0.88% | 0.20%(+0.680)#22 | 0.056%(+0.828)#147 |
| 23. | Linton Hall | 0.79% | 0.20%(+0.588)#23 | 0.056%(+0.736)#159 |
| 24. | Gainesville | 0.63% | 0.20%(+0.427)#24 | 0.056%(+0.574)#207 |
| 25. | Rose Hill Cdp Fairfax County | 0.63% | 0.20%(+0.424)#25 | 0.056%(+0.571)#208 |
| 26. | Dumfries | 0.61% | 0.20%(+0.411)#26 | 0.056%(+0.558)#212 |
| 27. | Cascades | 0.61% | 0.20%(+0.402)#27 | 0.056%(+0.550)#215 |
| 28. | Lincolnia | 0.60% | 0.20%(+0.397)#28 | 0.056%(+0.545)#218 |
| 29. | Burke Centre | 0.56% | 0.20%(+0.354)#29 | 0.056%(+0.502)#238 |
| 30. | Merrifield | 0.53% | 0.20%(+0.323)#30 | 0.056%(+0.471)#246 |
| 31. | University Of Virginia | 0.51% | 0.20%(+0.304)#31 | 0.056%(+0.452)#263 |
| 32. | Alexandria | 0.50% | 0.20%(+0.301)#32 | 0.056%(+0.448)#264 |
| 33. | Stephens City | 0.47% | 0.20%(+0.271)#33 | 0.056%(+0.419)#278 |
| 34. | Centreville | 0.46% | 0.20%(+0.257)#34 | 0.056%(+0.405)#286 |
| 35. | Highland Springs | 0.46% | 0.20%(+0.253)#35 | 0.056%(+0.401)#288 |
| 36. | Independent Hill | 0.41% | 0.20%(+0.202)#36 | 0.056%(+0.350)#315 |
| 37. | Laurel Hill | 0.38% | 0.20%(+0.178)#37 | 0.056%(+0.326)#333 |
| 38. | Vienna | 0.38% | 0.20%(+0.174)#38 | 0.056%(+0.322)#334 |
| 39. | Radford | 0.37% | 0.20%(+0.163)#39 | 0.056%(+0.310)#342 |
| 40. | Navy | 0.36% | 0.20%(+0.154)#40 | 0.056%(+0.301)#349 |
| 41. | Fairfax Station | 0.32% | 0.20%(+0.114)#41 | 0.056%(+0.262)#374 |
| 42. | Sugarland Run | 0.31% | 0.20%(+0.108)#42 | 0.056%(+0.256)#377 |
| 43. | Sudley | 0.29% | 0.20%(+0.082)#43 | 0.056%(+0.229)#397 |
| 44. | South Riding | 0.26% | 0.20%(+0.057)#44 | 0.056%(+0.205)#422 |
| 45. | Groveton | 0.26% | 0.20%(+0.056)#45 | 0.056%(+0.204)#424 |
| 46. | Montclair | 0.26% | 0.20%(+0.054)#46 | 0.056%(+0.202)#426 |
| 47. | Leesburg | 0.25% | 0.20%(+0.050)#47 | 0.056%(+0.198)#429 |
| 48. | Buckhall | 0.22% | 0.20%(+0.020)#48 | 0.056%(+0.168)#468 |
| 49. | Clintwood | 0.22% | 0.20%(+0.014)#49 | 0.056%(+0.161)#477 |
| 50. | Bailey S Crossroads | 0.21% | 0.20%(+0.002)#50 | 0.056%(+0.150)#495 |
| 51. | Hutchison | 0.20% | 0.20%(-0.002)#51 | 0.056%(+0.146)#499 |
| 52. | Chantilly | 0.17% | 0.20%(-0.035)#52 | 0.056%(+0.113)#547 |
| 53. | Kingstowne | 0.16% | 0.20%(-0.039)#53 | 0.056%(+0.109)#558 |
| 54. | Burke | 0.14% | 0.20%(-0.059)#54 | 0.056%(+0.089)#594 |
| 55. | Manchester | 0.14% | 0.20%(-0.061)#55 | 0.056%(+0.087)#601 |
| 56. | Ashburn | 0.14% | 0.20%(-0.063)#56 | 0.056%(+0.085)#606 |
| 57. | Hollins | 0.13% | 0.20%(-0.069)#57 | 0.056%(+0.078)#616 |
| 58. | Lakeside | 0.13% | 0.20%(-0.072)#58 | 0.056%(+0.076)#622 |
| 59. | Fredericksburg | 0.12% | 0.20%(-0.080)#59 | 0.056%(+0.068)#646 |
| 60. | Yorkshire | 0.12% | 0.20%(-0.081)#60 | 0.056%(+0.067)#648 |
| 61. | Spotsylvania Courthouse | 0.12% | 0.20%(-0.083)#61 | 0.056%(+0.065)#652 |
| 62. | Reston | 0.12% | 0.20%(-0.087)#62 | 0.056%(+0.061)#665 |
| 63. | Fair Oaks | 0.11% | 0.20%(-0.098)#63 | 0.056%(+0.049)#695 |
| 64. | Hampton | 0.10% | 0.20%(-0.100)#64 | 0.056%(+0.047)#700 |
| 65. | Newport News | 0.098% | 0.20%(-0.106)#65 | 0.056%(+0.042)#714 |
| 66. | Annandale | 0.094% | 0.20%(-0.109)#66 | 0.056%(+0.039)#727 |
| 67. | Chesapeake | 0.094% | 0.20%(-0.110)#67 | 0.056%(+0.038)#733 |
| 68. | Hayfield | 0.091% | 0.20%(-0.113)#68 | 0.056%(+0.035)#749 |
| 69. | Suffolk | 0.091% | 0.20%(-0.113)#69 | 0.056%(+0.035)#752 |
| 70. | Purcellville | 0.090% | 0.20%(-0.114)#70 | 0.056%(+0.034)#756 |
| 71. | Short Pump | 0.088% | 0.20%(-0.116)#71 | 0.056%(+0.032)#761 |
| 72. | Lynchburg | 0.085% | 0.20%(-0.119)#72 | 0.056%(+0.029)#779 |
| 73. | Roanoke | 0.084% | 0.20%(-0.120)#73 | 0.056%(+0.028)#781 |
| 74. | Virginia Beach | 0.079% | 0.20%(-0.125)#74 | 0.056%(+0.023)#803 |
| 75. | Woodburn | 0.070% | 0.20%(-0.133)#75 | 0.056%(+0.014)#839 |
| 76. | Long Branch | 0.065% | 0.20%(-0.138)#76 | 0.056%(+0.010)#863 |
| 77. | Charlottesville | 0.065% | 0.20%(-0.139)#77 | 0.056%(+0.009)#865 |
| 78. | Arlington | 0.063% | 0.20%(-0.140)#78 | 0.056%(+0.007)#873 |
| 79. | Richmond | 0.062% | 0.20%(-0.142)#79 | 0.056%(+0.006)#879 |
| 80. | Kings Park West | 0.060% | 0.20%(-0.143)#80 | 0.056%(+0.004)#887 |
| 81. | Norfolk | 0.055% | 0.20%(-0.148)#81 | 0.056%(-0.001)#906 |
| 82. | Sterling | 0.048% | 0.20%(-0.155)#82 | 0.056%(-0.008)#937 |
| 83. | Blacksburg | 0.040% | 0.20%(-0.164)#83 | 0.056%(-0.016)#990 |
| 84. | Franconia | 0.039% | 0.20%(-0.165)#84 | 0.056%(-0.017)#996 |
| 85. | Salem | 0.028% | 0.20%(-0.176)#85 | 0.056%(-0.028)#1,080 |
| 86. | Harrisonburg | 0.019% | 0.20%(-0.184)#86 | 0.056%(-0.037)#1,139 |
| 87. | West Springfield | 0.017% | 0.20%(-0.187)#87 | 0.056%(-0.039)#1,158 |
| 88. | George Mason | 0.0100% | 0.20%(-0.194)#88 | 0.056%(-0.046)#1,221 |
Common Questions
What are the Top 10 Cities with the Highest Percentage of Ghanaian Population in Virginia?
Top 10 Cities with the Highest Percentage of Ghanaian Population in Virginia are:
#1
6.00%
#2
4.66%
#3
4.37%
#4
3.35%
#5
3.33%
#6
3.33%
#7
3.32%
#8
3.28%
#9
3.02%
#10
2.01%
What city has the Highest Percentage of Ghanaian Population in Virginia?
Cherry Hill has the Highest Percentage of Ghanaian Population in Virginia with 6.00%.
What is the Percentage of Ghanaian Population in the State of Virginia?
Percentage of Ghanaian Population in Virginia is 0.20%.
What is the Percentage of Ghanaian Population in the United States?
Percentage of Ghanaian Population in the United States is 0.056%.