Cities with the Highest Percentage of Burmese Population in Oregon
RELATED REPORTS & OPTIONS
Burmese
Oregon
Compare Cities
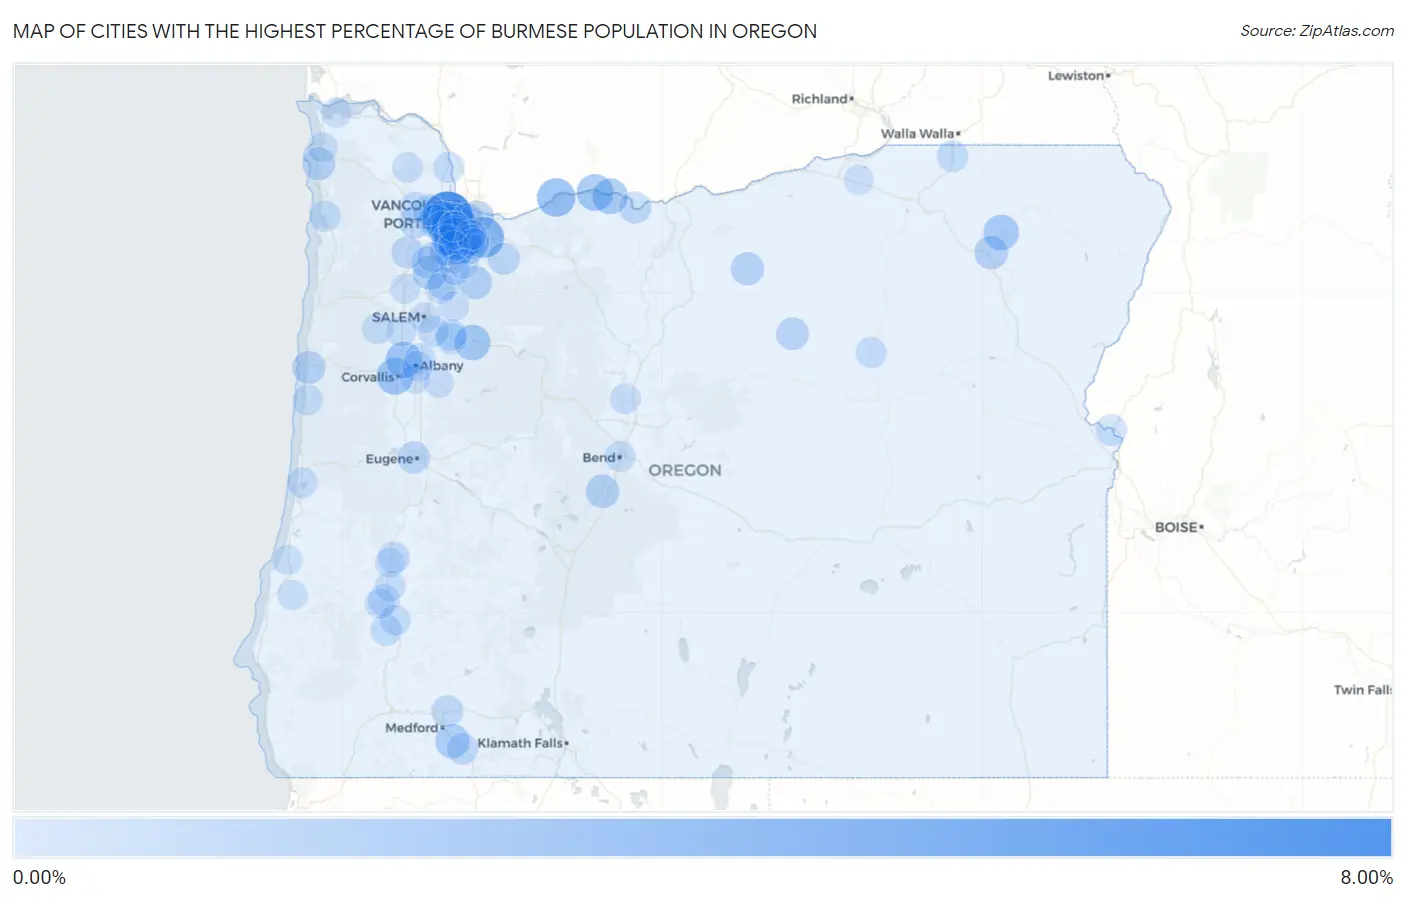
Map of Cities with the Highest Percentage of Burmese Population in Oregon
0.00%
8.00%
Cities with the Highest Percentage of Burmese Population in Oregon
| City | Burmese | vs State | vs National | |
| 1. | Bethany | 6.17% | 0.62%(+5.55)#1 | 0.60%(+5.57)#177 |
| 2. | West Haven Sylvan | 3.53% | 0.62%(+2.92)#2 | 0.60%(+2.94)#437 |
| 3. | Happy Valley | 3.42% | 0.62%(+2.80)#3 | 0.60%(+2.82)#457 |
| 4. | Rivergrove | 2.87% | 0.62%(+2.25)#4 | 0.60%(+2.27)#579 |
| 5. | Cascade Locks | 2.68% | 0.62%(+2.06)#5 | 0.60%(+2.08)#621 |
| 6. | Lake Oswego | 2.63% | 0.62%(+2.02)#6 | 0.60%(+2.04)#630 |
| 7. | Cedar Hills | 2.32% | 0.62%(+1.71)#7 | 0.60%(+1.73)#754 |
| 8. | Corvallis | 2.20% | 0.62%(+1.58)#8 | 0.60%(+1.60)#806 |
| 9. | Hood River | 2.16% | 0.62%(+1.54)#9 | 0.60%(+1.56)#826 |
| 10. | Adair Village | 2.11% | 0.62%(+1.49)#10 | 0.60%(+1.51)#853 |
| 11. | Cedar Mill | 2.01% | 0.62%(+1.39)#11 | 0.60%(+1.41)#918 |
| 12. | Beaverton | 1.99% | 0.62%(+1.37)#12 | 0.60%(+1.39)#935 |
| 13. | Mosier | 1.90% | 0.62%(+1.29)#13 | 0.60%(+1.31)#978 |
| 14. | Lyons | 1.87% | 0.62%(+1.26)#14 | 0.60%(+1.28)#1,000 |
| 15. | Imbler | 1.79% | 0.62%(+1.17)#15 | 0.60%(+1.19)#1,054 |
| 16. | Tigard | 1.76% | 0.62%(+1.14)#16 | 0.60%(+1.16)#1,080 |
| 17. | Raleigh Hills | 1.57% | 0.62%(+0.957)#17 | 0.60%(+0.976)#1,234 |
| 18. | St Paul | 1.50% | 0.62%(+0.879)#18 | 0.60%(+0.899)#1,306 |
| 19. | Talent | 1.47% | 0.62%(+0.854)#19 | 0.60%(+0.873)#1,326 |
| 20. | Wilsonville | 1.35% | 0.62%(+0.734)#20 | 0.60%(+0.753)#1,449 |
| 21. | Oak Hills | 1.32% | 0.62%(+0.699)#21 | 0.60%(+0.719)#1,488 |
| 22. | Island City | 1.23% | 0.62%(+0.617)#22 | 0.60%(+0.636)#1,596 |
| 23. | Molalla | 1.23% | 0.62%(+0.615)#23 | 0.60%(+0.635)#1,597 |
| 24. | Three Rivers | 1.22% | 0.62%(+0.606)#24 | 0.60%(+0.626)#1,604 |
| 25. | Rockcreek | 1.20% | 0.62%(+0.582)#25 | 0.60%(+0.602)#1,636 |
| 26. | Hillsboro | 1.19% | 0.62%(+0.574)#26 | 0.60%(+0.593)#1,647 |
| 27. | West Linn | 1.18% | 0.62%(+0.565)#27 | 0.60%(+0.584)#1,658 |
| 28. | Maywood Park | 1.15% | 0.62%(+0.534)#28 | 0.60%(+0.553)#1,708 |
| 29. | Condon | 1.15% | 0.62%(+0.531)#29 | 0.60%(+0.551)#1,709 |
| 30. | Newport | 1.14% | 0.62%(+0.527)#30 | 0.60%(+0.546)#1,717 |
| 31. | Sherwood | 1.08% | 0.62%(+0.468)#31 | 0.60%(+0.487)#1,802 |
| 32. | Durham | 1.08% | 0.62%(+0.458)#32 | 0.60%(+0.478)#1,820 |
| 33. | King City | 1.03% | 0.62%(+0.410)#33 | 0.60%(+0.430)#1,925 |
| 34. | Cannon Beach | 1.02% | 0.62%(+0.406)#34 | 0.60%(+0.426)#1,933 |
| 35. | River Road | 1.01% | 0.62%(+0.398)#35 | 0.60%(+0.417)#1,949 |
| 36. | Spray | 1.01% | 0.62%(+0.388)#36 | 0.60%(+0.408)#1,966 |
| 37. | Aloha | 0.95% | 0.62%(+0.328)#37 | 0.60%(+0.348)#2,099 |
| 38. | Eugene | 0.89% | 0.62%(+0.278)#38 | 0.60%(+0.297)#2,209 |
| 39. | Dundee | 0.87% | 0.62%(+0.252)#39 | 0.60%(+0.271)#2,268 |
| 40. | Estacada | 0.87% | 0.62%(+0.249)#40 | 0.60%(+0.269)#2,273 |
| 41. | Woodburn | 0.85% | 0.62%(+0.234)#41 | 0.60%(+0.253)#2,310 |
| 42. | Yamhill | 0.84% | 0.62%(+0.228)#42 | 0.60%(+0.247)#2,329 |
| 43. | Garden Home Whitford | 0.83% | 0.62%(+0.216)#43 | 0.60%(+0.235)#2,354 |
| 44. | The Dalles | 0.83% | 0.62%(+0.215)#44 | 0.60%(+0.235)#2,358 |
| 45. | Metzger | 0.81% | 0.62%(+0.197)#45 | 0.60%(+0.217)#2,396 |
| 46. | Marlene | 0.81% | 0.62%(+0.197)#46 | 0.60%(+0.216)#2,399 |
| 47. | Juniper Canyon | 0.77% | 0.62%(+0.155)#47 | 0.60%(+0.175)#2,519 |
| 48. | Ashland | 0.72% | 0.62%(+0.107)#48 | 0.60%(+0.127)#2,650 |
| 49. | Forest Grove | 0.71% | 0.62%(+0.094)#49 | 0.60%(+0.114)#2,701 |
| 50. | White City | 0.71% | 0.62%(+0.093)#50 | 0.60%(+0.113)#2,704 |
| 51. | Oakland | 0.70% | 0.62%(+0.082)#51 | 0.60%(+0.102)#2,743 |
| 52. | Oatfield | 0.67% | 0.62%(+0.049)#52 | 0.60%(+0.068)#2,862 |
| 53. | Stayton | 0.66% | 0.62%(+0.041)#53 | 0.60%(+0.060)#2,895 |
| 54. | Banks | 0.64% | 0.62%(+0.018)#54 | 0.60%(+0.038)#2,982 |
| 55. | Milton Freewater | 0.63% | 0.62%(+0.014)#55 | 0.60%(+0.033)#3,005 |
| 56. | Portland | 0.63% | 0.62%(+0.011)#56 | 0.60%(+0.031)#3,017 |
| 57. | North Plains | 0.62% | 0.62%(+0.007)#57 | 0.60%(+0.027)#3,028 |
| 58. | Heceta Beach | 0.61% | 0.62%(-0.004)#58 | 0.60%(+0.015)#3,071 |
| 59. | Sublimity | 0.61% | 0.62%(-0.006)#59 | 0.60%(+0.014)#3,082 |
| 60. | Riddle | 0.61% | 0.62%(-0.012)#60 | 0.60%(+0.008)#3,100 |
| 61. | Annex | 0.60% | 0.62%(-0.016)#61 | 0.60%(+0.003)#3,118 |
| 62. | Green | 0.58% | 0.62%(-0.040)#62 | 0.60%(-0.021)#3,211 |
| 63. | St Helens | 0.57% | 0.62%(-0.046)#63 | 0.60%(-0.026)#3,235 |
| 64. | Garibaldi | 0.56% | 0.62%(-0.058)#64 | 0.60%(-0.039)#3,285 |
| 65. | Long Creek | 0.53% | 0.62%(-0.090)#65 | 0.60%(-0.071)#3,433 |
| 66. | Myrtle Creek | 0.52% | 0.62%(-0.101)#66 | 0.60%(-0.081)#3,475 |
| 67. | Millersburg | 0.51% | 0.62%(-0.111)#67 | 0.60%(-0.091)#3,533 |
| 68. | Turner | 0.50% | 0.62%(-0.115)#68 | 0.60%(-0.096)#3,556 |
| 69. | Oak Grove | 0.48% | 0.62%(-0.132)#69 | 0.60%(-0.112)#3,642 |
| 70. | Bull Mountain | 0.48% | 0.62%(-0.134)#70 | 0.60%(-0.114)#3,653 |
| 71. | Gladstone | 0.48% | 0.62%(-0.142)#71 | 0.60%(-0.122)#3,683 |
| 72. | Waldport | 0.46% | 0.62%(-0.155)#72 | 0.60%(-0.136)#3,752 |
| 73. | Bend | 0.46% | 0.62%(-0.161)#73 | 0.60%(-0.142)#3,786 |
| 74. | Falls City | 0.45% | 0.62%(-0.163)#74 | 0.60%(-0.143)#3,799 |
| 75. | Tualatin | 0.45% | 0.62%(-0.171)#75 | 0.60%(-0.151)#3,835 |
| 76. | Roseburg | 0.44% | 0.62%(-0.173)#76 | 0.60%(-0.153)#3,844 |
| 77. | Crooked River Ranch | 0.43% | 0.62%(-0.191)#77 | 0.60%(-0.172)#3,950 |
| 78. | Monmouth | 0.42% | 0.62%(-0.201)#78 | 0.60%(-0.181)#4,001 |
| 79. | Albany | 0.42% | 0.62%(-0.202)#79 | 0.60%(-0.182)#4,006 |
| 80. | Dunes City | 0.41% | 0.62%(-0.208)#80 | 0.60%(-0.188)#4,032 |
| 81. | Salem | 0.40% | 0.62%(-0.218)#81 | 0.60%(-0.199)#4,091 |
| 82. | Dunthorpe | 0.40% | 0.62%(-0.221)#82 | 0.60%(-0.201)#4,102 |
| 83. | Vernonia | 0.39% | 0.62%(-0.223)#83 | 0.60%(-0.203)#4,114 |
| 84. | Gervais | 0.35% | 0.62%(-0.271)#84 | 0.60%(-0.252)#4,409 |
| 85. | Lebanon | 0.34% | 0.62%(-0.278)#85 | 0.60%(-0.258)#4,465 |
| 86. | Winston | 0.34% | 0.62%(-0.279)#86 | 0.60%(-0.259)#4,472 |
| 87. | Silverton | 0.32% | 0.62%(-0.301)#87 | 0.60%(-0.281)#4,617 |
| 88. | Coquille | 0.30% | 0.62%(-0.317)#88 | 0.60%(-0.298)#4,731 |
| 89. | Milwaukie | 0.30% | 0.62%(-0.320)#89 | 0.60%(-0.300)#4,750 |
| 90. | Newberg | 0.30% | 0.62%(-0.321)#90 | 0.60%(-0.302)#4,763 |
| 91. | Astoria | 0.28% | 0.62%(-0.332)#91 | 0.60%(-0.312)#4,842 |
| 92. | Aurora | 0.28% | 0.62%(-0.332)#92 | 0.60%(-0.313)#4,848 |
| 93. | Amity | 0.28% | 0.62%(-0.333)#93 | 0.60%(-0.314)#4,855 |
| 94. | North Bend | 0.28% | 0.62%(-0.334)#94 | 0.60%(-0.314)#4,860 |
| 95. | West Slope | 0.27% | 0.62%(-0.347)#95 | 0.60%(-0.327)#4,958 |
| 96. | Seaside | 0.27% | 0.62%(-0.351)#96 | 0.60%(-0.331)#4,980 |
| 97. | Canby | 0.25% | 0.62%(-0.363)#97 | 0.60%(-0.343)#5,066 |
| 98. | Sutherlin | 0.25% | 0.62%(-0.370)#98 | 0.60%(-0.351)#5,121 |
| 99. | Stanfield | 0.23% | 0.62%(-0.382)#99 | 0.60%(-0.362)#5,208 |
| 100. | Tangent | 0.23% | 0.62%(-0.386)#100 | 0.60%(-0.366)#5,249 |
Common Questions
What are the Top 10 Cities with the Highest Percentage of Burmese Population in Oregon?
Top 10 Cities with the Highest Percentage of Burmese Population in Oregon are:
#1
6.17%
#2
3.53%
#3
3.42%
#4
2.87%
#5
2.68%
#6
2.63%
#7
2.32%
#8
2.20%
#9
2.16%
#10
2.11%
What city has the Highest Percentage of Burmese Population in Oregon?
Bethany has the Highest Percentage of Burmese Population in Oregon with 6.17%.
What is the Percentage of Burmese Population in the State of Oregon?
Percentage of Burmese Population in Oregon is 0.62%.
What is the Percentage of Burmese Population in the United States?
Percentage of Burmese Population in the United States is 0.60%.