Cities with the Highest Percentage of Burmese Population in Michigan
RELATED REPORTS & OPTIONS
Burmese
Michigan
Compare Cities
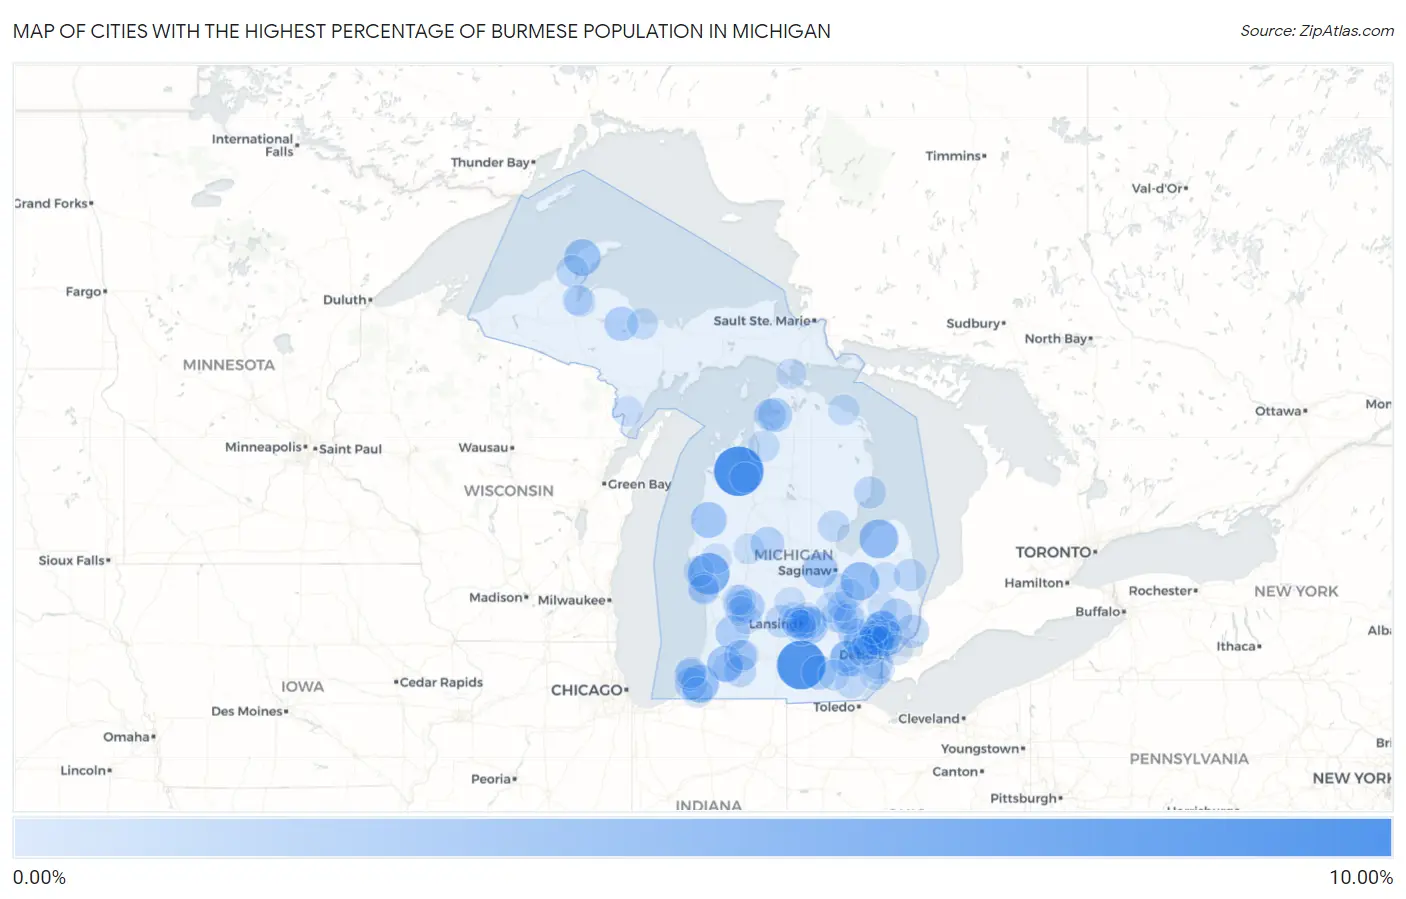
Map of Cities with the Highest Percentage of Burmese Population in Michigan
0.00%
10.00%
Cities with the Highest Percentage of Burmese Population in Michigan
| City | Burmese | vs State | vs National | |
| 1. | Chums Corner | 8.66% | 0.39%(+8.27)#1 | 0.60%(+8.07)#110 |
| 2. | Spring Arbor | 8.22% | 0.39%(+7.83)#2 | 0.60%(+7.62)#123 |
| 3. | Twin Lake | 5.20% | 0.39%(+4.81)#3 | 0.60%(+4.60)#224 |
| 4. | Elkton | 4.02% | 0.39%(+3.63)#4 | 0.60%(+3.42)#348 |
| 5. | Millington | 3.83% | 0.39%(+3.44)#5 | 0.60%(+3.23)#384 |
| 6. | Berrien Springs | 3.56% | 0.39%(+3.17)#6 | 0.60%(+2.96)#430 |
| 7. | Copper City | 3.06% | 0.39%(+2.67)#7 | 0.60%(+2.46)#521 |
| 8. | Fountain | 2.80% | 0.39%(+2.41)#8 | 0.60%(+2.21)#596 |
| 9. | Paw Paw | 2.68% | 0.39%(+2.29)#9 | 0.60%(+2.09)#620 |
| 10. | Ann Arbor | 2.61% | 0.39%(+2.22)#10 | 0.60%(+2.02)#637 |
| 11. | Hemlock | 2.61% | 0.39%(+2.22)#11 | 0.60%(+2.01)#638 |
| 12. | Okemos | 2.51% | 0.39%(+2.12)#12 | 0.60%(+1.91)#681 |
| 13. | Troy | 2.29% | 0.39%(+1.90)#13 | 0.60%(+1.69)#768 |
| 14. | Brooklyn | 2.12% | 0.39%(+1.73)#14 | 0.60%(+1.52)#846 |
| 15. | Rochester Hills | 2.11% | 0.39%(+1.72)#15 | 0.60%(+1.51)#851 |
| 16. | Petoskey | 2.10% | 0.39%(+1.71)#16 | 0.60%(+1.50)#861 |
| 17. | Hopkins | 2.09% | 0.39%(+1.70)#17 | 0.60%(+1.49)#867 |
| 18. | Rochester | 2.03% | 0.39%(+1.64)#18 | 0.60%(+1.43)#908 |
| 19. | West Ishpeming | 1.99% | 0.39%(+1.60)#19 | 0.60%(+1.39)#934 |
| 20. | Forest Hills | 1.97% | 0.39%(+1.58)#20 | 0.60%(+1.37)#944 |
| 21. | Birmingham | 1.87% | 0.39%(+1.48)#21 | 0.60%(+1.27)#1,005 |
| 22. | Novi | 1.85% | 0.39%(+1.46)#22 | 0.60%(+1.25)#1,021 |
| 23. | Barryton | 1.82% | 0.39%(+1.43)#23 | 0.60%(+1.22)#1,038 |
| 24. | Mass | 1.68% | 0.39%(+1.29)#24 | 0.60%(+1.08)#1,148 |
| 25. | Pearl Beach | 1.63% | 0.39%(+1.24)#25 | 0.60%(+1.03)#1,191 |
| 26. | Armada | 1.52% | 0.39%(+1.13)#26 | 0.60%(+0.923)#1,288 |
| 27. | Edgemont Park | 1.51% | 0.39%(+1.12)#27 | 0.60%(+0.917)#1,295 |
| 28. | Westwood | 1.47% | 0.39%(+1.08)#28 | 0.60%(+0.877)#1,323 |
| 29. | Haslett | 1.46% | 0.39%(+1.07)#29 | 0.60%(+0.859)#1,342 |
| 30. | Baroda | 1.45% | 0.39%(+1.06)#30 | 0.60%(+0.854)#1,351 |
| 31. | Milford | 1.45% | 0.39%(+1.06)#31 | 0.60%(+0.853)#1,352 |
| 32. | Mulliken | 1.33% | 0.39%(+0.944)#32 | 0.60%(+0.736)#1,470 |
| 33. | Bay Shore | 1.31% | 0.39%(+0.924)#33 | 0.60%(+0.716)#1,493 |
| 34. | Applegate | 1.29% | 0.39%(+0.898)#34 | 0.60%(+0.690)#1,525 |
| 35. | Houghton | 1.28% | 0.39%(+0.887)#35 | 0.60%(+0.679)#1,542 |
| 36. | Schoolcraft | 1.21% | 0.39%(+0.817)#36 | 0.60%(+0.609)#1,627 |
| 37. | Au Sable | 1.20% | 0.39%(+0.810)#37 | 0.60%(+0.603)#1,634 |
| 38. | East Lansing | 1.16% | 0.39%(+0.767)#38 | 0.60%(+0.559)#1,703 |
| 39. | Dundee | 1.13% | 0.39%(+0.738)#39 | 0.60%(+0.531)#1,742 |
| 40. | Shoreham | 1.09% | 0.39%(+0.696)#40 | 0.60%(+0.489)#1,798 |
| 41. | Farmington Hills | 1.04% | 0.39%(+0.650)#41 | 0.60%(+0.443)#1,890 |
| 42. | Standish | 1.03% | 0.39%(+0.641)#42 | 0.60%(+0.434)#1,913 |
| 43. | Bellaire | 0.94% | 0.39%(+0.553)#43 | 0.60%(+0.345)#2,104 |
| 44. | Roosevelt Park | 0.94% | 0.39%(+0.553)#44 | 0.60%(+0.345)#2,105 |
| 45. | Barton Hills | 0.90% | 0.39%(+0.511)#45 | 0.60%(+0.304)#2,189 |
| 46. | Ferndale | 0.89% | 0.39%(+0.503)#46 | 0.60%(+0.296)#2,215 |
| 47. | Wixom | 0.87% | 0.39%(+0.481)#47 | 0.60%(+0.273)#2,265 |
| 48. | Trenton | 0.85% | 0.39%(+0.463)#48 | 0.60%(+0.255)#2,306 |
| 49. | Royal Oak | 0.85% | 0.39%(+0.461)#49 | 0.60%(+0.254)#2,308 |
| 50. | Byron | 0.83% | 0.39%(+0.438)#50 | 0.60%(+0.231)#2,365 |
| 51. | Ypsilanti | 0.83% | 0.39%(+0.437)#51 | 0.60%(+0.229)#2,369 |
| 52. | Farmington | 0.82% | 0.39%(+0.429)#52 | 0.60%(+0.221)#2,384 |
| 53. | Harvey | 0.81% | 0.39%(+0.420)#53 | 0.60%(+0.212)#2,410 |
| 54. | Rogers City | 0.80% | 0.39%(+0.413)#54 | 0.60%(+0.205)#2,438 |
| 55. | L Anse | 0.77% | 0.39%(+0.383)#55 | 0.60%(+0.175)#2,518 |
| 56. | St Joseph | 0.76% | 0.39%(+0.375)#56 | 0.60%(+0.167)#2,539 |
| 57. | Clinton | 0.75% | 0.39%(+0.362)#57 | 0.60%(+0.154)#2,583 |
| 58. | Southgate | 0.74% | 0.39%(+0.355)#58 | 0.60%(+0.147)#2,603 |
| 59. | Lake Fenton | 0.73% | 0.39%(+0.339)#59 | 0.60%(+0.131)#2,641 |
| 60. | Grand Rapids | 0.72% | 0.39%(+0.330)#60 | 0.60%(+0.123)#2,666 |
| 61. | Holt | 0.72% | 0.39%(+0.328)#61 | 0.60%(+0.120)#2,676 |
| 62. | Montrose | 0.72% | 0.39%(+0.326)#62 | 0.60%(+0.118)#2,687 |
| 63. | Argentine | 0.69% | 0.39%(+0.304)#63 | 0.60%(+0.096)#2,761 |
| 64. | Big Rapids | 0.68% | 0.39%(+0.293)#64 | 0.60%(+0.085)#2,800 |
| 65. | Montague | 0.68% | 0.39%(+0.287)#65 | 0.60%(+0.079)#2,819 |
| 66. | Wacousta | 0.67% | 0.39%(+0.282)#66 | 0.60%(+0.074)#2,839 |
| 67. | Marlette | 0.67% | 0.39%(+0.278)#67 | 0.60%(+0.071)#2,852 |
| 68. | Caledonia | 0.66% | 0.39%(+0.274)#68 | 0.60%(+0.066)#2,869 |
| 69. | Bloomfield Hills | 0.66% | 0.39%(+0.269)#69 | 0.60%(+0.062)#2,891 |
| 70. | Beverly Hills | 0.64% | 0.39%(+0.255)#70 | 0.60%(+0.047)#2,943 |
| 71. | Vernon | 0.64% | 0.39%(+0.252)#71 | 0.60%(+0.044)#2,955 |
| 72. | Northview | 0.62% | 0.39%(+0.233)#72 | 0.60%(+0.025)#3,031 |
| 73. | Fowler | 0.61% | 0.39%(+0.224)#73 | 0.60%(+0.017)#3,063 |
| 74. | Buchanan | 0.61% | 0.39%(+0.219)#74 | 0.60%(+0.011)#3,090 |
| 75. | Madison Heights | 0.60% | 0.39%(+0.210)#75 | 0.60%(+0.002)#3,119 |
| 76. | Fenton | 0.56% | 0.39%(+0.170)#76 | 0.60%(-0.037)#3,276 |
| 77. | Baraga | 0.54% | 0.39%(+0.155)#77 | 0.60%(-0.053)#3,355 |
| 78. | Bath | 0.54% | 0.39%(+0.153)#78 | 0.60%(-0.055)#3,364 |
| 79. | South Rockwood | 0.54% | 0.39%(+0.152)#79 | 0.60%(-0.056)#3,369 |
| 80. | Grosse Pointe Farms | 0.54% | 0.39%(+0.150)#80 | 0.60%(-0.058)#3,382 |
| 81. | St Ignace | 0.54% | 0.39%(+0.148)#81 | 0.60%(-0.060)#3,389 |
| 82. | Stephenson | 0.54% | 0.39%(+0.146)#82 | 0.60%(-0.061)#3,394 |
| 83. | Lawton | 0.54% | 0.39%(+0.146)#83 | 0.60%(-0.062)#3,401 |
| 84. | Hesperia | 0.53% | 0.39%(+0.142)#84 | 0.60%(-0.066)#3,413 |
| 85. | Swartz Creek | 0.53% | 0.39%(+0.139)#85 | 0.60%(-0.069)#3,424 |
| 86. | Norton Shores | 0.52% | 0.39%(+0.127)#86 | 0.60%(-0.081)#3,473 |
| 87. | Kingsley | 0.50% | 0.39%(+0.113)#87 | 0.60%(-0.095)#3,547 |
| 88. | Comstock Park | 0.50% | 0.39%(+0.112)#88 | 0.60%(-0.096)#3,559 |
| 89. | Parchment | 0.49% | 0.39%(+0.100)#89 | 0.60%(-0.107)#3,613 |
| 90. | Waverly | 0.46% | 0.39%(+0.074)#90 | 0.60%(-0.134)#3,742 |
| 91. | Berkley | 0.46% | 0.39%(+0.066)#91 | 0.60%(-0.142)#3,788 |
| 92. | Franklin | 0.45% | 0.39%(+0.063)#92 | 0.60%(-0.145)#3,810 |
| 93. | Livonia | 0.44% | 0.39%(+0.048)#93 | 0.60%(-0.160)#3,878 |
| 94. | Lansing | 0.43% | 0.39%(+0.044)#94 | 0.60%(-0.164)#3,894 |
| 95. | Sterling Heights | 0.43% | 0.39%(+0.043)#95 | 0.60%(-0.164)#3,898 |
| 96. | Kentwood | 0.43% | 0.39%(+0.040)#96 | 0.60%(-0.168)#3,920 |
| 97. | Auburn Hills | 0.41% | 0.39%(+0.021)#97 | 0.60%(-0.187)#4,021 |
| 98. | Dryden | 0.41% | 0.39%(+0.021)#98 | 0.60%(-0.187)#4,022 |
| 99. | Plymouth | 0.40% | 0.39%(+0.008)#99 | 0.60%(-0.199)#4,092 |
| 100. | Mount Morris | 0.38% | 0.39%(-0.008)#100 | 0.60%(-0.216)#4,175 |
Common Questions
What are the Top 10 Cities with the Highest Percentage of Burmese Population in Michigan?
Top 10 Cities with the Highest Percentage of Burmese Population in Michigan are:
#1
8.66%
#2
8.22%
#3
5.20%
#4
4.02%
#5
3.83%
#6
3.56%
#7
3.06%
#8
2.80%
#9
2.68%
#10
2.61%
What city has the Highest Percentage of Burmese Population in Michigan?
Chums Corner has the Highest Percentage of Burmese Population in Michigan with 8.66%.
What is the Percentage of Burmese Population in the State of Michigan?
Percentage of Burmese Population in Michigan is 0.39%.
What is the Percentage of Burmese Population in the United States?
Percentage of Burmese Population in the United States is 0.60%.