Cities with the Highest Percentage of Burmese Population in Illinois
RELATED REPORTS & OPTIONS
Burmese
Illinois
Compare Cities
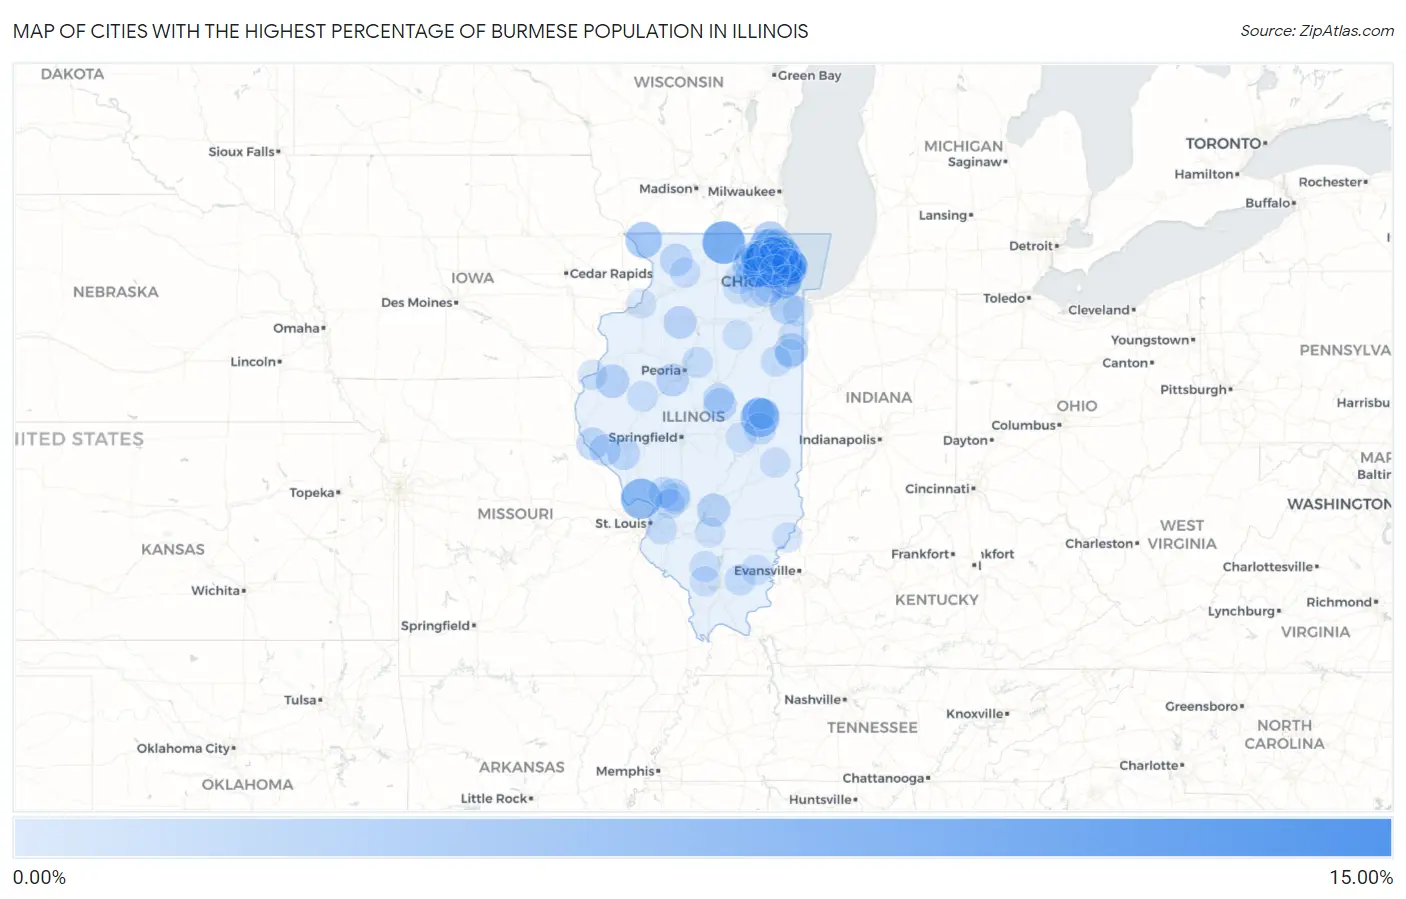
Map of Cities with the Highest Percentage of Burmese Population in Illinois
0.00%
15.00%
Cities with the Highest Percentage of Burmese Population in Illinois
| City | Burmese | vs State | vs National | |
| 1. | Inverness | 10.05% | 0.57%(+9.48)#1 | 0.60%(+9.45)#78 |
| 2. | South Barrington | 7.52% | 0.57%(+6.95)#2 | 0.60%(+6.92)#136 |
| 3. | Caledonia | 6.64% | 0.57%(+6.07)#3 | 0.60%(+6.04)#158 |
| 4. | Northbrook | 5.61% | 0.57%(+5.04)#4 | 0.60%(+5.01)#200 |
| 5. | Elsah | 5.56% | 0.57%(+4.99)#5 | 0.60%(+4.97)#203 |
| 6. | Glenview | 5.29% | 0.57%(+4.72)#6 | 0.60%(+4.69)#217 |
| 7. | Lincolnshire | 5.17% | 0.57%(+4.60)#7 | 0.60%(+4.58)#227 |
| 8. | Savoy | 4.87% | 0.57%(+4.30)#8 | 0.60%(+4.27)#254 |
| 9. | Buffalo Grove | 4.57% | 0.57%(+4.00)#9 | 0.60%(+3.98)#283 |
| 10. | Wheeling | 3.78% | 0.57%(+3.21)#10 | 0.60%(+3.19)#390 |
| 11. | Vernon Hills | 3.74% | 0.57%(+3.17)#11 | 0.60%(+3.14)#397 |
| 12. | The Galena Territory | 3.67% | 0.57%(+3.10)#12 | 0.60%(+3.08)#411 |
| 13. | Long Grove | 3.45% | 0.57%(+2.88)#13 | 0.60%(+2.86)#448 |
| 14. | Golf | 3.30% | 0.57%(+2.72)#14 | 0.60%(+2.70)#482 |
| 15. | Pingree Grove | 3.02% | 0.57%(+2.44)#15 | 0.60%(+2.42)#528 |
| 16. | Lake Villa | 2.95% | 0.57%(+2.38)#16 | 0.60%(+2.36)#549 |
| 17. | Morton Grove | 2.86% | 0.57%(+2.29)#17 | 0.60%(+2.26)#583 |
| 18. | Volo | 2.81% | 0.57%(+2.24)#18 | 0.60%(+2.21)#594 |
| 19. | Broadview | 2.69% | 0.57%(+2.12)#19 | 0.60%(+2.09)#618 |
| 20. | Wilmette | 2.53% | 0.57%(+1.96)#20 | 0.60%(+1.93)#669 |
| 21. | Papineau | 2.46% | 0.57%(+1.89)#21 | 0.60%(+1.86)#700 |
| 22. | Schaumburg | 2.43% | 0.57%(+1.86)#22 | 0.60%(+1.83)#706 |
| 23. | Frankfort Square | 2.38% | 0.57%(+1.81)#23 | 0.60%(+1.78)#726 |
| 24. | Blandinsville | 2.36% | 0.57%(+1.79)#24 | 0.60%(+1.76)#734 |
| 25. | West Dundee | 2.35% | 0.57%(+1.77)#25 | 0.60%(+1.75)#741 |
| 26. | Hainesville | 2.34% | 0.57%(+1.77)#26 | 0.60%(+1.74)#744 |
| 27. | Wapella | 2.31% | 0.57%(+1.73)#27 | 0.60%(+1.71)#757 |
| 28. | Niles | 2.29% | 0.57%(+1.72)#28 | 0.60%(+1.69)#767 |
| 29. | Vernon | 2.25% | 0.57%(+1.67)#29 | 0.60%(+1.65)#784 |
| 30. | Hoffman Estates | 2.22% | 0.57%(+1.65)#30 | 0.60%(+1.62)#795 |
| 31. | Glasford | 2.15% | 0.57%(+1.57)#31 | 0.60%(+1.55)#834 |
| 32. | Buda | 2.08% | 0.57%(+1.51)#32 | 0.60%(+1.48)#877 |
| 33. | Champaign | 2.06% | 0.57%(+1.48)#33 | 0.60%(+1.46)#891 |
| 34. | Mount Prospect | 2.03% | 0.57%(+1.45)#34 | 0.60%(+1.43)#907 |
| 35. | Fox River Grove | 2.02% | 0.57%(+1.45)#35 | 0.60%(+1.42)#910 |
| 36. | Shannon | 2.01% | 0.57%(+1.44)#36 | 0.60%(+1.41)#921 |
| 37. | Hull | 1.96% | 0.57%(+1.38)#37 | 0.60%(+1.36)#953 |
| 38. | Staunton | 1.92% | 0.57%(+1.35)#38 | 0.60%(+1.33)#966 |
| 39. | Skokie | 1.91% | 0.57%(+1.34)#39 | 0.60%(+1.31)#977 |
| 40. | Evanston | 1.89% | 0.57%(+1.32)#40 | 0.60%(+1.29)#986 |
| 41. | Milton | 1.86% | 0.57%(+1.29)#41 | 0.60%(+1.26)#1,011 |
| 42. | Indian Creek | 1.81% | 0.57%(+1.23)#42 | 0.60%(+1.21)#1,043 |
| 43. | Lake Zurich | 1.78% | 0.57%(+1.21)#43 | 0.60%(+1.19)#1,059 |
| 44. | Lincolnwood | 1.77% | 0.57%(+1.20)#44 | 0.60%(+1.17)#1,070 |
| 45. | Arlington Heights | 1.74% | 0.57%(+1.17)#45 | 0.60%(+1.14)#1,088 |
| 46. | Pesotum | 1.70% | 0.57%(+1.13)#46 | 0.60%(+1.10)#1,127 |
| 47. | Palatine | 1.70% | 0.57%(+1.12)#47 | 0.60%(+1.10)#1,131 |
| 48. | Bannockburn | 1.69% | 0.57%(+1.12)#48 | 0.60%(+1.09)#1,136 |
| 49. | Barrington | 1.66% | 0.57%(+1.09)#49 | 0.60%(+1.07)#1,155 |
| 50. | Kenilworth | 1.66% | 0.57%(+1.08)#50 | 0.60%(+1.06)#1,162 |
| 51. | North Riverside | 1.60% | 0.57%(+1.03)#51 | 0.60%(+1.00)#1,218 |
| 52. | El Dara | 1.57% | 0.57%(+1.00)#52 | 0.60%(+0.978)#1,233 |
| 53. | Naperville | 1.56% | 0.57%(+0.985)#53 | 0.60%(+0.960)#1,249 |
| 54. | Lake Forest | 1.48% | 0.57%(+0.909)#54 | 0.60%(+0.885)#1,316 |
| 55. | Swansea | 1.39% | 0.57%(+0.818)#55 | 0.60%(+0.793)#1,406 |
| 56. | Hawthorn Woods | 1.38% | 0.57%(+0.810)#56 | 0.60%(+0.786)#1,418 |
| 57. | Streamwood | 1.34% | 0.57%(+0.765)#57 | 0.60%(+0.740)#1,466 |
| 58. | Heyworth | 1.32% | 0.57%(+0.748)#58 | 0.60%(+0.724)#1,480 |
| 59. | Rolling Meadows | 1.31% | 0.57%(+0.737)#59 | 0.60%(+0.712)#1,496 |
| 60. | Campton Hills | 1.31% | 0.57%(+0.734)#60 | 0.60%(+0.710)#1,498 |
| 61. | Livingston | 1.30% | 0.57%(+0.726)#61 | 0.60%(+0.701)#1,514 |
| 62. | Bunker Hill | 1.29% | 0.57%(+0.719)#62 | 0.60%(+0.695)#1,519 |
| 63. | Urbana | 1.29% | 0.57%(+0.718)#63 | 0.60%(+0.693)#1,522 |
| 64. | Metamora | 1.28% | 0.57%(+0.706)#64 | 0.60%(+0.682)#1,536 |
| 65. | Danforth | 1.28% | 0.57%(+0.705)#65 | 0.60%(+0.680)#1,541 |
| 66. | Galatia | 1.24% | 0.57%(+0.672)#66 | 0.60%(+0.648)#1,580 |
| 67. | Gurnee | 1.20% | 0.57%(+0.629)#67 | 0.60%(+0.604)#1,632 |
| 68. | Huntley | 1.19% | 0.57%(+0.621)#68 | 0.60%(+0.596)#1,644 |
| 69. | St Johns | 1.16% | 0.57%(+0.590)#69 | 0.60%(+0.566)#1,693 |
| 70. | Prospect Heights | 1.15% | 0.57%(+0.575)#70 | 0.60%(+0.550)#1,711 |
| 71. | Itasca | 1.11% | 0.57%(+0.539)#71 | 0.60%(+0.514)#1,758 |
| 72. | Ipava | 1.11% | 0.57%(+0.533)#72 | 0.60%(+0.509)#1,768 |
| 73. | Hammond | 1.10% | 0.57%(+0.526)#73 | 0.60%(+0.502)#1,774 |
| 74. | Hinckley | 1.07% | 0.57%(+0.495)#74 | 0.60%(+0.471)#1,837 |
| 75. | Lisle | 1.06% | 0.57%(+0.491)#75 | 0.60%(+0.467)#1,848 |
| 76. | Algonquin | 1.05% | 0.57%(+0.481)#76 | 0.60%(+0.457)#1,864 |
| 77. | Norris City | 1.04% | 0.57%(+0.463)#77 | 0.60%(+0.438)#1,905 |
| 78. | Deerfield | 1.03% | 0.57%(+0.460)#78 | 0.60%(+0.435)#1,909 |
| 79. | Westfield | 0.99% | 0.57%(+0.421)#79 | 0.60%(+0.397)#1,989 |
| 80. | Kildeer | 0.99% | 0.57%(+0.419)#80 | 0.60%(+0.395)#1,994 |
| 81. | Mount Carmel | 0.99% | 0.57%(+0.416)#81 | 0.60%(+0.392)#2,002 |
| 82. | Maple Park | 0.98% | 0.57%(+0.406)#82 | 0.60%(+0.381)#2,029 |
| 83. | Deer Park | 0.97% | 0.57%(+0.402)#83 | 0.60%(+0.377)#2,036 |
| 84. | Pontoosuc | 0.96% | 0.57%(+0.389)#84 | 0.60%(+0.364)#2,064 |
| 85. | South Elgin | 0.96% | 0.57%(+0.388)#85 | 0.60%(+0.363)#2,067 |
| 86. | Polo | 0.95% | 0.57%(+0.380)#86 | 0.60%(+0.355)#2,083 |
| 87. | De Soto | 0.95% | 0.57%(+0.377)#87 | 0.60%(+0.353)#2,091 |
| 88. | Hamel | 0.95% | 0.57%(+0.377)#88 | 0.60%(+0.352)#2,092 |
| 89. | Northfield | 0.95% | 0.57%(+0.373)#89 | 0.60%(+0.349)#2,097 |
| 90. | Ransom | 0.94% | 0.57%(+0.368)#90 | 0.60%(+0.343)#2,107 |
| 91. | Montgomery | 0.93% | 0.57%(+0.362)#91 | 0.60%(+0.338)#2,118 |
| 92. | Lake In The Hills | 0.93% | 0.57%(+0.360)#92 | 0.60%(+0.335)#2,122 |
| 93. | Momence | 0.92% | 0.57%(+0.350)#93 | 0.60%(+0.326)#2,142 |
| 94. | Oak Park | 0.92% | 0.57%(+0.347)#94 | 0.60%(+0.322)#2,150 |
| 95. | Rapids City | 0.91% | 0.57%(+0.342)#95 | 0.60%(+0.317)#2,163 |
| 96. | Steger | 0.89% | 0.57%(+0.320)#96 | 0.60%(+0.296)#2,213 |
| 97. | Wamac | 0.89% | 0.57%(+0.320)#97 | 0.60%(+0.296)#2,216 |
| 98. | Martinton | 0.89% | 0.57%(+0.320)#98 | 0.60%(+0.296)#2,218 |
| 99. | Mundelein | 0.88% | 0.57%(+0.304)#99 | 0.60%(+0.280)#2,252 |
| 100. | Elk Grove Village | 0.86% | 0.57%(+0.289)#100 | 0.60%(+0.264)#2,286 |
Common Questions
What are the Top 10 Cities with the Highest Percentage of Burmese Population in Illinois?
Top 10 Cities with the Highest Percentage of Burmese Population in Illinois are:
#1
10.05%
#2
7.52%
#3
6.64%
#4
5.61%
#5
5.56%
#6
5.29%
#7
5.17%
#8
4.87%
#9
4.57%
#10
3.78%
What city has the Highest Percentage of Burmese Population in Illinois?
Inverness has the Highest Percentage of Burmese Population in Illinois with 10.05%.
What is the Percentage of Burmese Population in the State of Illinois?
Percentage of Burmese Population in Illinois is 0.57%.
What is the Percentage of Burmese Population in the United States?
Percentage of Burmese Population in the United States is 0.60%.