Cities with the Highest Percentage of Burmese Population in Connecticut
RELATED REPORTS & OPTIONS
Burmese
Connecticut
Compare Cities
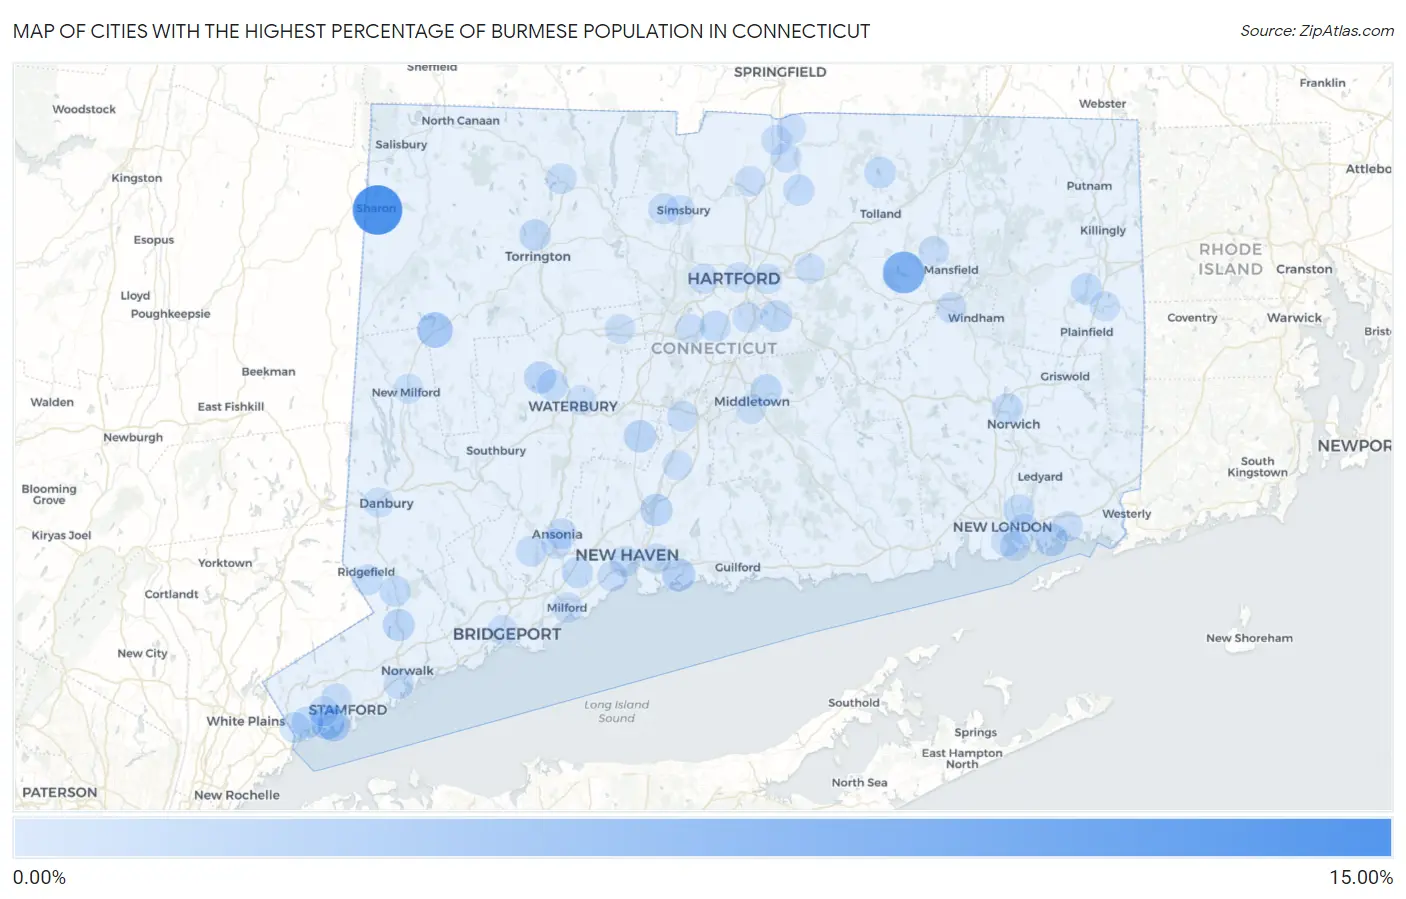
Map of Cities with the Highest Percentage of Burmese Population in Connecticut
0.00%
15.00%
Cities with the Highest Percentage of Burmese Population in Connecticut
| City | Burmese | vs State | vs National | |
| 1. | Sharon | 14.89% | 0.42%(+14.5)#1 | 0.60%(+14.3)#45 |
| 2. | South Coventry | 8.79% | 0.42%(+8.37)#2 | 0.60%(+8.19)#105 |
| 3. | New Preston | 4.00% | 0.42%(+3.58)#3 | 0.60%(+3.40)#351 |
| 4. | Ridgebury | 3.25% | 0.42%(+2.83)#4 | 0.60%(+2.65)#490 |
| 5. | Riverside | 3.06% | 0.42%(+2.64)#5 | 0.60%(+2.46)#520 |
| 6. | Stratford Downtown | 2.51% | 0.42%(+2.09)#6 | 0.60%(+1.92)#678 |
| 7. | Branford Center | 2.23% | 0.42%(+1.81)#7 | 0.60%(+1.63)#793 |
| 8. | Old Greenwich | 2.08% | 0.42%(+1.66)#8 | 0.60%(+1.48)#876 |
| 9. | Noroton | 1.96% | 0.42%(+1.54)#9 | 0.60%(+1.37)#949 |
| 10. | Westport | 1.91% | 0.42%(+1.49)#10 | 0.60%(+1.31)#976 |
| 11. | Noank | 1.87% | 0.42%(+1.45)#11 | 0.60%(+1.28)#999 |
| 12. | Bantam Borough | 1.72% | 0.42%(+1.30)#12 | 0.60%(+1.12)#1,110 |
| 13. | Cheshire Village | 1.68% | 0.42%(+1.26)#13 | 0.60%(+1.09)#1,143 |
| 14. | Staples | 1.67% | 0.42%(+1.25)#14 | 0.60%(+1.07)#1,152 |
| 15. | North Haven | 1.66% | 0.42%(+1.24)#15 | 0.60%(+1.06)#1,159 |
| 16. | Saugatuck | 1.63% | 0.42%(+1.21)#16 | 0.60%(+1.04)#1,186 |
| 17. | Watertown | 1.49% | 0.42%(+1.07)#17 | 0.60%(+0.890)#1,311 |
| 18. | Quinnipiac University | 1.44% | 0.42%(+1.02)#18 | 0.60%(+0.844)#1,359 |
| 19. | Wilton Center | 1.40% | 0.42%(+0.981)#19 | 0.60%(+0.803)#1,397 |
| 20. | Trumbull Center | 1.34% | 0.42%(+0.915)#20 | 0.60%(+0.738)#1,469 |
| 21. | Greenwich | 1.27% | 0.42%(+0.854)#21 | 0.60%(+0.677)#1,543 |
| 22. | Sacred Heart University | 1.26% | 0.42%(+0.841)#22 | 0.60%(+0.664)#1,563 |
| 23. | Torrington | 1.23% | 0.42%(+0.813)#23 | 0.60%(+0.636)#1,595 |
| 24. | Glastonbury Center | 1.23% | 0.42%(+0.811)#24 | 0.60%(+0.634)#1,598 |
| 25. | Crystal Lake | 1.11% | 0.42%(+0.686)#25 | 0.60%(+0.509)#1,770 |
| 26. | Portland | 1.08% | 0.42%(+0.655)#26 | 0.60%(+0.478)#1,819 |
| 27. | Wauregan | 0.93% | 0.42%(+0.511)#27 | 0.60%(+0.334)#2,123 |
| 28. | Daniels Farm | 0.89% | 0.42%(+0.470)#28 | 0.60%(+0.293)#2,223 |
| 29. | Newington | 0.89% | 0.42%(+0.470)#29 | 0.60%(+0.293)#2,227 |
| 30. | Tashua | 0.88% | 0.42%(+0.461)#30 | 0.60%(+0.284)#2,246 |
| 31. | Newtown Borough | 0.87% | 0.42%(+0.448)#31 | 0.60%(+0.271)#2,270 |
| 32. | Oakville | 0.86% | 0.42%(+0.443)#32 | 0.60%(+0.266)#2,281 |
| 33. | Stonington Borough | 0.85% | 0.42%(+0.429)#33 | 0.60%(+0.252)#2,313 |
| 34. | Georgetown | 0.85% | 0.42%(+0.425)#34 | 0.60%(+0.248)#2,325 |
| 35. | Broad Brook | 0.82% | 0.42%(+0.404)#35 | 0.60%(+0.227)#2,371 |
| 36. | Norwich | 0.77% | 0.42%(+0.351)#36 | 0.60%(+0.174)#2,520 |
| 37. | Orange | 0.76% | 0.42%(+0.339)#37 | 0.60%(+0.162)#2,559 |
| 38. | Pemberwick | 0.68% | 0.42%(+0.265)#38 | 0.60%(+0.088)#2,788 |
| 39. | Sandy Hook | 0.68% | 0.42%(+0.257)#39 | 0.60%(+0.080)#2,817 |
| 40. | Fairfield University | 0.66% | 0.42%(+0.242)#40 | 0.60%(+0.065)#2,878 |
| 41. | Conning Towers Nautilus Park | 0.66% | 0.42%(+0.240)#41 | 0.60%(+0.063)#2,886 |
| 42. | New Haven | 0.59% | 0.42%(+0.165)#42 | 0.60%(-0.012)#3,170 |
| 43. | Ansonia | 0.56% | 0.42%(+0.144)#43 | 0.60%(-0.033)#3,258 |
| 44. | Naugatuck Borough | 0.54% | 0.42%(+0.120)#44 | 0.60%(-0.057)#3,375 |
| 45. | Winsted | 0.54% | 0.42%(+0.118)#45 | 0.60%(-0.059)#3,387 |
| 46. | West Simsbury | 0.54% | 0.42%(+0.116)#46 | 0.60%(-0.061)#3,392 |
| 47. | Meriden | 0.53% | 0.42%(+0.112)#47 | 0.60%(-0.065)#3,412 |
| 48. | Coleytown | 0.50% | 0.42%(+0.081)#48 | 0.60%(-0.096)#3,554 |
| 49. | Norwalk | 0.47% | 0.42%(+0.051)#49 | 0.60%(-0.126)#3,699 |
| 50. | Ridgefield | 0.47% | 0.42%(+0.050)#50 | 0.60%(-0.127)#3,702 |
| 51. | Stamford | 0.46% | 0.42%(+0.041)#51 | 0.60%(-0.136)#3,760 |
| 52. | Shelton | 0.45% | 0.42%(+0.026)#52 | 0.60%(-0.151)#3,833 |
| 53. | Storrs | 0.37% | 0.42%(-0.051)#53 | 0.60%(-0.228)#4,263 |
| 54. | Milford City Balance | 0.32% | 0.42%(-0.098)#54 | 0.60%(-0.276)#4,576 |
| 55. | Willimantic | 0.31% | 0.42%(-0.111)#55 | 0.60%(-0.288)#4,665 |
| 56. | West Haven | 0.30% | 0.42%(-0.120)#56 | 0.60%(-0.297)#4,728 |
| 57. | Windsor Locks | 0.29% | 0.42%(-0.126)#57 | 0.60%(-0.303)#4,775 |
| 58. | Mystic | 0.29% | 0.42%(-0.126)#58 | 0.60%(-0.303)#4,778 |
| 59. | Compo | 0.27% | 0.42%(-0.145)#59 | 0.60%(-0.322)#4,914 |
| 60. | New Canaan | 0.26% | 0.42%(-0.158)#60 | 0.60%(-0.335)#5,004 |
| 61. | Thompsonville | 0.25% | 0.42%(-0.173)#61 | 0.60%(-0.350)#5,115 |
| 62. | New London | 0.22% | 0.42%(-0.196)#62 | 0.60%(-0.373)#5,291 |
| 63. | Southwood Acres | 0.21% | 0.42%(-0.206)#63 | 0.60%(-0.383)#5,378 |
| 64. | West Hartford | 0.21% | 0.42%(-0.208)#64 | 0.60%(-0.385)#5,398 |
| 65. | Wethersfield | 0.21% | 0.42%(-0.211)#65 | 0.60%(-0.388)#5,414 |
| 66. | East Haven | 0.18% | 0.42%(-0.241)#66 | 0.60%(-0.418)#5,691 |
| 67. | Long Hill | 0.18% | 0.42%(-0.243)#67 | 0.60%(-0.420)#5,710 |
| 68. | East Hartford | 0.17% | 0.42%(-0.253)#68 | 0.60%(-0.430)#5,816 |
| 69. | Derby | 0.16% | 0.42%(-0.259)#69 | 0.60%(-0.436)#5,861 |
| 70. | Cos Cob | 0.14% | 0.42%(-0.282)#70 | 0.60%(-0.459)#6,076 |
| 71. | New Britain | 0.13% | 0.42%(-0.294)#71 | 0.60%(-0.471)#6,179 |
| 72. | Middletown | 0.12% | 0.42%(-0.298)#72 | 0.60%(-0.475)#6,224 |
| 73. | Simsbury Center | 0.11% | 0.42%(-0.306)#73 | 0.60%(-0.483)#6,311 |
| 74. | Groton | 0.11% | 0.42%(-0.313)#74 | 0.60%(-0.490)#6,384 |
| 75. | Wallingford Center | 0.11% | 0.42%(-0.313)#75 | 0.60%(-0.491)#6,385 |
| 76. | Manchester | 0.095% | 0.42%(-0.326)#76 | 0.60%(-0.503)#6,506 |
| 77. | Danbury | 0.083% | 0.42%(-0.337)#77 | 0.60%(-0.514)#6,611 |
| 78. | Hartford | 0.074% | 0.42%(-0.346)#78 | 0.60%(-0.523)#6,696 |
| 79. | Bristol | 0.067% | 0.42%(-0.353)#79 | 0.60%(-0.530)#6,756 |
| 80. | Bridgeport | 0.060% | 0.42%(-0.360)#80 | 0.60%(-0.537)#6,813 |
| 81. | Waterbury | 0.048% | 0.42%(-0.372)#81 | 0.60%(-0.549)#6,915 |
| 82. | Sherwood Manor | 0.035% | 0.42%(-0.385)#82 | 0.60%(-0.562)#7,012 |
| 83. | Moosup | 0.031% | 0.42%(-0.389)#83 | 0.60%(-0.566)#7,045 |
| 84. | New Milford | 0.028% | 0.42%(-0.392)#84 | 0.60%(-0.569)#7,064 |
1
2Common Questions
What are the Top 10 Cities with the Highest Percentage of Burmese Population in Connecticut?
Top 10 Cities with the Highest Percentage of Burmese Population in Connecticut are:
#1
14.89%
#2
8.79%
#3
4.00%
#4
3.06%
#5
2.23%
#6
2.08%
#7
1.87%
#8
1.68%
#9
1.66%
#10
1.49%
What city has the Highest Percentage of Burmese Population in Connecticut?
Sharon has the Highest Percentage of Burmese Population in Connecticut with 14.89%.
What is the Percentage of Burmese Population in the State of Connecticut?
Percentage of Burmese Population in Connecticut is 0.42%.
What is the Percentage of Burmese Population in the United States?
Percentage of Burmese Population in the United States is 0.60%.