Cities with the Highest Percentage of Burmese Population in Massachusetts
RELATED REPORTS & OPTIONS
Burmese
Massachusetts
Compare Cities
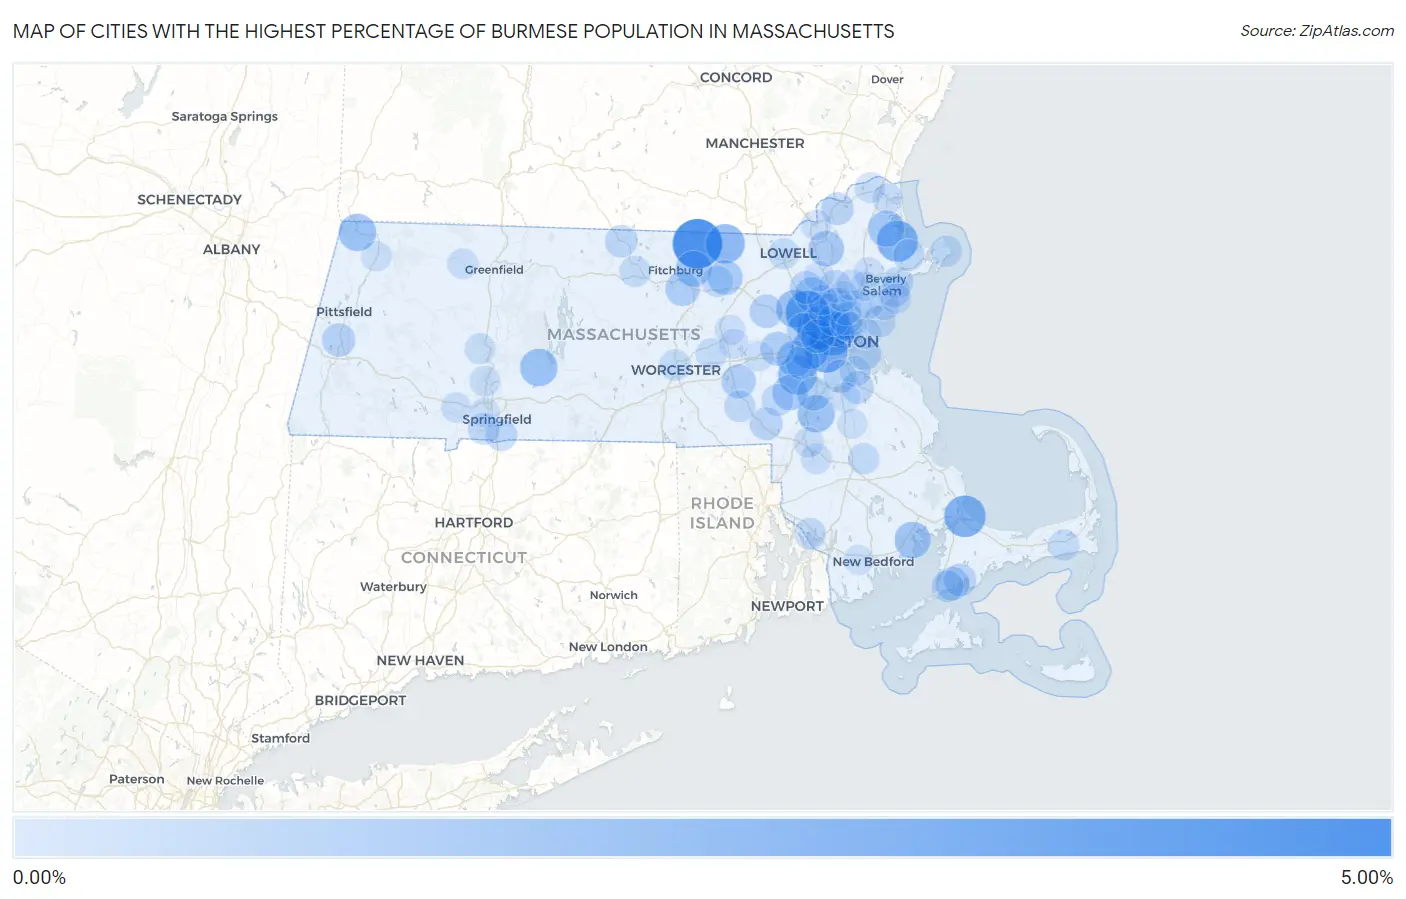
Map of Cities with the Highest Percentage of Burmese Population in Massachusetts
0.00%
5.00%
Cities with the Highest Percentage of Burmese Population in Massachusetts
| City | Burmese | vs State | vs National | |
| 1. | Townsend | 4.33% | 0.50%(+3.83)#1 | 0.60%(+3.74)#309 |
| 2. | Lexington | 2.98% | 0.50%(+2.48)#2 | 0.60%(+2.38)#543 |
| 3. | Cambridge | 2.89% | 0.50%(+2.40)#3 | 0.60%(+2.30)#567 |
| 4. | Brookline | 2.83% | 0.50%(+2.33)#4 | 0.60%(+2.23)#589 |
| 5. | Belmont | 2.57% | 0.50%(+2.08)#5 | 0.60%(+1.98)#655 |
| 6. | Sagamore | 2.57% | 0.50%(+2.07)#6 | 0.60%(+1.97)#656 |
| 7. | Ipswich | 2.42% | 0.50%(+1.92)#7 | 0.60%(+1.82)#710 |
| 8. | Pepperell | 2.09% | 0.50%(+1.59)#8 | 0.60%(+1.49)#871 |
| 9. | Dover | 1.99% | 0.50%(+1.49)#9 | 0.60%(+1.39)#933 |
| 10. | Newton | 1.83% | 0.50%(+1.33)#10 | 0.60%(+1.23)#1,030 |
| 11. | Hanscom Afb | 1.74% | 0.50%(+1.24)#11 | 0.60%(+1.14)#1,092 |
| 12. | Belchertown | 1.66% | 0.50%(+1.16)#12 | 0.60%(+1.06)#1,157 |
| 13. | Williamstown | 1.65% | 0.50%(+1.15)#13 | 0.60%(+1.05)#1,175 |
| 14. | Sharon | 1.60% | 0.50%(+1.11)#14 | 0.60%(+1.01)#1,214 |
| 15. | Amherst | 1.56% | 0.50%(+1.07)#15 | 0.60%(+0.966)#1,240 |
| 16. | Marion Center | 1.43% | 0.50%(+0.931)#16 | 0.60%(+0.831)#1,377 |
| 17. | Rowley | 1.40% | 0.50%(+0.903)#17 | 0.60%(+0.803)#1,396 |
| 18. | Wellesley | 1.38% | 0.50%(+0.885)#18 | 0.60%(+0.786)#1,417 |
| 19. | Lunenburg | 1.30% | 0.50%(+0.805)#19 | 0.60%(+0.706)#1,509 |
| 20. | Andover | 1.25% | 0.50%(+0.755)#20 | 0.60%(+0.656)#1,572 |
| 21. | Medfield | 1.20% | 0.50%(+0.705)#21 | 0.60%(+0.606)#1,629 |
| 22. | Burlington | 1.18% | 0.50%(+0.683)#22 | 0.60%(+0.584)#1,659 |
| 23. | Ayer | 1.15% | 0.50%(+0.647)#23 | 0.60%(+0.548)#1,715 |
| 24. | Somerville | 1.14% | 0.50%(+0.643)#24 | 0.60%(+0.544)#1,721 |
| 25. | Arlington | 1.04% | 0.50%(+0.541)#25 | 0.60%(+0.442)#1,895 |
| 26. | Leominster | 1.04% | 0.50%(+0.540)#26 | 0.60%(+0.441)#1,899 |
| 27. | Needham | 0.98% | 0.50%(+0.481)#27 | 0.60%(+0.382)#2,024 |
| 28. | Hopkinton | 0.97% | 0.50%(+0.472)#28 | 0.60%(+0.373)#2,044 |
| 29. | Cochituate | 0.92% | 0.50%(+0.425)#29 | 0.60%(+0.325)#2,144 |
| 30. | Norwood | 0.90% | 0.50%(+0.398)#30 | 0.60%(+0.299)#2,202 |
| 31. | Waltham | 0.87% | 0.50%(+0.367)#31 | 0.60%(+0.268)#2,275 |
| 32. | Stoneham | 0.85% | 0.50%(+0.350)#32 | 0.60%(+0.251)#2,316 |
| 33. | Teaticket | 0.83% | 0.50%(+0.335)#33 | 0.60%(+0.236)#2,353 |
| 34. | Watertown Town | 0.80% | 0.50%(+0.306)#34 | 0.60%(+0.207)#2,429 |
| 35. | Lenox | 0.80% | 0.50%(+0.302)#35 | 0.60%(+0.203)#2,444 |
| 36. | West Concord | 0.78% | 0.50%(+0.277)#36 | 0.60%(+0.178)#2,508 |
| 37. | Milton | 0.76% | 0.50%(+0.261)#37 | 0.60%(+0.162)#2,557 |
| 38. | Winchester | 0.72% | 0.50%(+0.225)#38 | 0.60%(+0.126)#2,653 |
| 39. | Boston | 0.72% | 0.50%(+0.221)#39 | 0.60%(+0.122)#2,671 |
| 40. | Pinehurst | 0.70% | 0.50%(+0.202)#40 | 0.60%(+0.103)#2,739 |
| 41. | Franklin Town | 0.66% | 0.50%(+0.164)#41 | 0.60%(+0.065)#2,879 |
| 42. | East Falmouth | 0.66% | 0.50%(+0.158)#42 | 0.60%(+0.058)#2,902 |
| 43. | Haverhill | 0.65% | 0.50%(+0.149)#43 | 0.60%(+0.049)#2,935 |
| 44. | Braintree Town | 0.62% | 0.50%(+0.126)#44 | 0.60%(+0.027)#3,026 |
| 45. | Malden | 0.60% | 0.50%(+0.104)#45 | 0.60%(+0.005)#3,112 |
| 46. | Winchendon | 0.58% | 0.50%(+0.085)#46 | 0.60%(-0.014)#3,184 |
| 47. | Reading | 0.55% | 0.50%(+0.057)#47 | 0.60%(-0.042)#3,298 |
| 48. | Falmouth | 0.52% | 0.50%(+0.017)#48 | 0.60%(-0.082)#3,481 |
| 49. | Salem | 0.51% | 0.50%(+0.014)#49 | 0.60%(-0.085)#3,501 |
| 50. | Longmeadow | 0.49% | 0.50%(-0.004)#50 | 0.60%(-0.103)#3,588 |
| 51. | Medford | 0.47% | 0.50%(-0.025)#51 | 0.60%(-0.124)#3,693 |
| 52. | Beverly | 0.47% | 0.50%(-0.031)#52 | 0.60%(-0.130)#3,723 |
| 53. | Millis Clicquot | 0.47% | 0.50%(-0.032)#53 | 0.60%(-0.131)#3,726 |
| 54. | Agawam Town | 0.46% | 0.50%(-0.037)#54 | 0.60%(-0.136)#3,754 |
| 55. | Nahant | 0.45% | 0.50%(-0.048)#55 | 0.60%(-0.148)#3,823 |
| 56. | Ocean Grove | 0.45% | 0.50%(-0.052)#56 | 0.60%(-0.151)#3,836 |
| 57. | Essex | 0.43% | 0.50%(-0.073)#57 | 0.60%(-0.172)#3,951 |
| 58. | Milford | 0.42% | 0.50%(-0.074)#58 | 0.60%(-0.173)#3,960 |
| 59. | Devens | 0.40% | 0.50%(-0.101)#59 | 0.60%(-0.200)#4,095 |
| 60. | Rockport | 0.38% | 0.50%(-0.114)#60 | 0.60%(-0.213)#4,162 |
| 61. | Worcester | 0.37% | 0.50%(-0.123)#61 | 0.60%(-0.223)#4,221 |
| 62. | Saugus | 0.37% | 0.50%(-0.123)#62 | 0.60%(-0.223)#4,222 |
| 63. | Bridgewater Town | 0.36% | 0.50%(-0.137)#63 | 0.60%(-0.236)#4,302 |
| 64. | Gardner | 0.36% | 0.50%(-0.142)#64 | 0.60%(-0.242)#4,331 |
| 65. | Everett | 0.35% | 0.50%(-0.145)#65 | 0.60%(-0.244)#4,351 |
| 66. | Northwest Harwich | 0.34% | 0.50%(-0.155)#66 | 0.60%(-0.254)#4,427 |
| 67. | Lowell | 0.33% | 0.50%(-0.169)#67 | 0.60%(-0.269)#4,533 |
| 68. | Northborough | 0.31% | 0.50%(-0.184)#68 | 0.60%(-0.283)#4,630 |
| 69. | Quincy | 0.30% | 0.50%(-0.199)#69 | 0.60%(-0.298)#4,734 |
| 70. | Holyoke | 0.26% | 0.50%(-0.234)#70 | 0.60%(-0.333)#4,991 |
| 71. | Northampton | 0.25% | 0.50%(-0.243)#71 | 0.60%(-0.342)#5,060 |
| 72. | Melrose | 0.25% | 0.50%(-0.247)#72 | 0.60%(-0.346)#5,092 |
| 73. | Shelburne Falls | 0.24% | 0.50%(-0.263)#73 | 0.60%(-0.362)#5,203 |
| 74. | Norton Center | 0.23% | 0.50%(-0.265)#74 | 0.60%(-0.365)#5,226 |
| 75. | Amesbury Town | 0.23% | 0.50%(-0.267)#75 | 0.60%(-0.366)#5,239 |
| 76. | Methuen Town | 0.23% | 0.50%(-0.267)#76 | 0.60%(-0.366)#5,248 |
| 77. | Wakefield | 0.22% | 0.50%(-0.280)#77 | 0.60%(-0.379)#5,353 |
| 78. | Lynnfield | 0.21% | 0.50%(-0.289)#78 | 0.60%(-0.388)#5,417 |
| 79. | Mansfield Center | 0.21% | 0.50%(-0.290)#79 | 0.60%(-0.389)#5,426 |
| 80. | Winthrop Town | 0.20% | 0.50%(-0.293)#80 | 0.60%(-0.392)#5,461 |
| 81. | North Attleborough | 0.20% | 0.50%(-0.296)#81 | 0.60%(-0.396)#5,489 |
| 82. | Newburyport | 0.20% | 0.50%(-0.296)#82 | 0.60%(-0.396)#5,490 |
| 83. | Danvers | 0.20% | 0.50%(-0.297)#83 | 0.60%(-0.397)#5,498 |
| 84. | Chelsea | 0.20% | 0.50%(-0.298)#84 | 0.60%(-0.397)#5,499 |
| 85. | Marblehead | 0.18% | 0.50%(-0.316)#85 | 0.60%(-0.415)#5,673 |
| 86. | Hudson | 0.17% | 0.50%(-0.324)#86 | 0.60%(-0.423)#5,735 |
| 87. | Westfield | 0.17% | 0.50%(-0.326)#87 | 0.60%(-0.426)#5,766 |
| 88. | Woburn | 0.17% | 0.50%(-0.330)#88 | 0.60%(-0.429)#5,802 |
| 89. | Adams | 0.16% | 0.50%(-0.341)#89 | 0.60%(-0.440)#5,908 |
| 90. | Greenfield | 0.15% | 0.50%(-0.345)#90 | 0.60%(-0.444)#5,951 |
| 91. | Randolph Town | 0.14% | 0.50%(-0.363)#91 | 0.60%(-0.462)#6,100 |
| 92. | Smith Mills | 0.13% | 0.50%(-0.366)#92 | 0.60%(-0.466)#6,127 |
| 93. | Framingham | 0.13% | 0.50%(-0.367)#93 | 0.60%(-0.466)#6,136 |
| 94. | Wilmington | 0.13% | 0.50%(-0.369)#94 | 0.60%(-0.468)#6,153 |
| 95. | Marlborough | 0.12% | 0.50%(-0.380)#95 | 0.60%(-0.479)#6,275 |
| 96. | Swampscott | 0.11% | 0.50%(-0.386)#96 | 0.60%(-0.485)#6,329 |
| 97. | Brockton | 0.11% | 0.50%(-0.386)#97 | 0.60%(-0.486)#6,336 |
| 98. | Lynn | 0.11% | 0.50%(-0.389)#98 | 0.60%(-0.488)#6,360 |
| 99. | West Springfield Town | 0.10% | 0.50%(-0.394)#99 | 0.60%(-0.493)#6,407 |
| 100. | Peabody | 0.10% | 0.50%(-0.397)#100 | 0.60%(-0.496)#6,438 |
Common Questions
What are the Top 10 Cities with the Highest Percentage of Burmese Population in Massachusetts?
Top 10 Cities with the Highest Percentage of Burmese Population in Massachusetts are:
What city has the Highest Percentage of Burmese Population in Massachusetts?
Townsend has the Highest Percentage of Burmese Population in Massachusetts with 4.33%.
What is the Percentage of Burmese Population in the State of Massachusetts?
Percentage of Burmese Population in Massachusetts is 0.50%.
What is the Percentage of Burmese Population in the United States?
Percentage of Burmese Population in the United States is 0.60%.