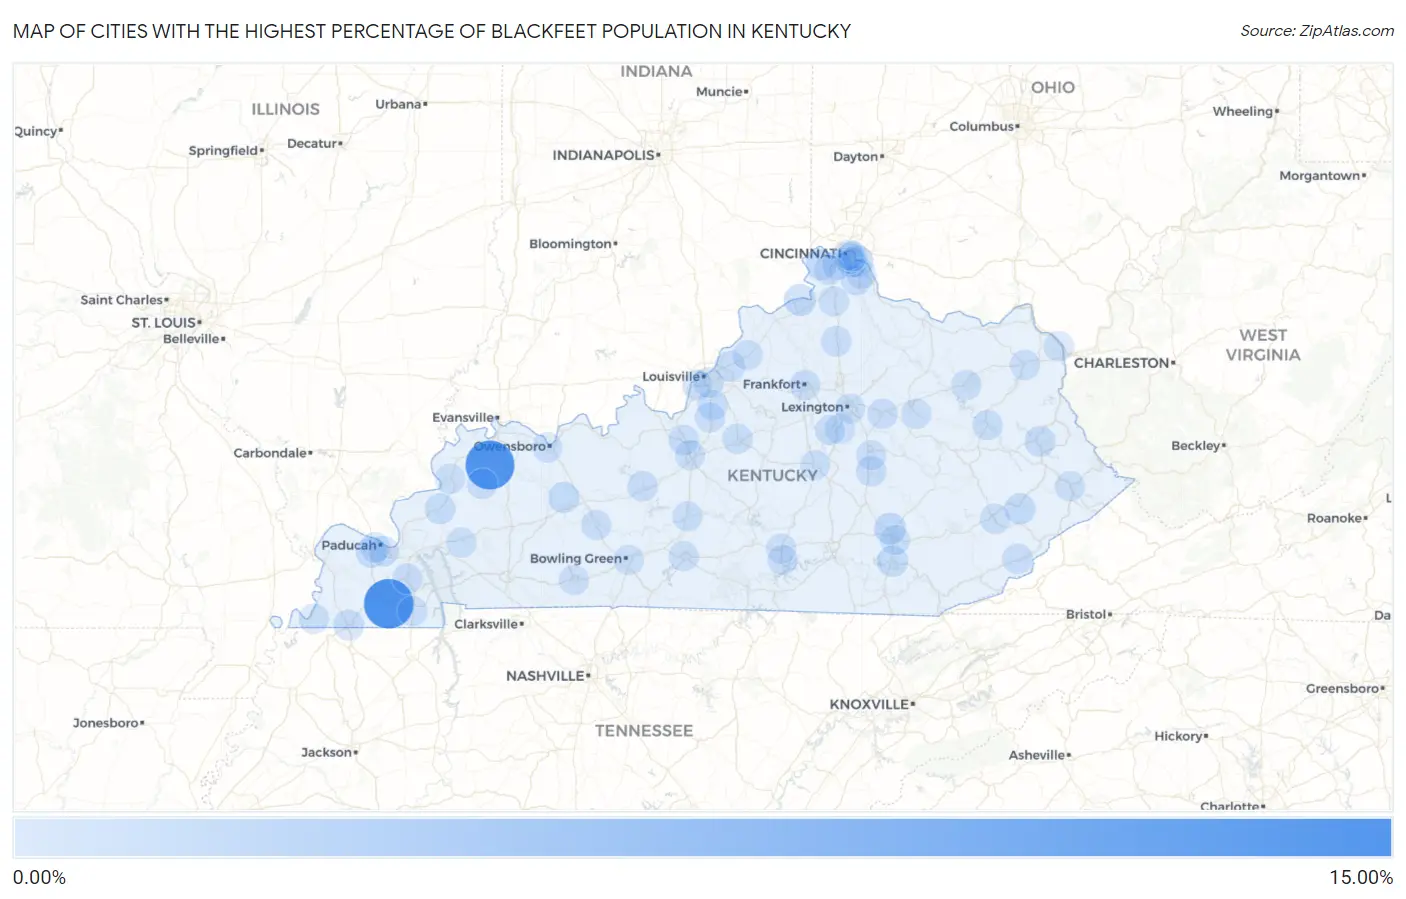
Cities with the Highest Percentage of Blackfeet Population in Kentucky
RELATED REPORTS & OPTIONS
Blackfeet
Kentucky
Compare Cities
Map of Cities with the Highest Percentage of Blackfeet Population in Kentucky
0.00%
15.00%

Cities with the Highest Percentage of Blackfeet Population in Kentucky
| City | Blackfeet | vs State | vs National | |
| 1. | Farmington | 14.37% | 0.047%(+14.3)#1 | 0.062%(+14.3)#27 |
| 2. | Poole | 13.89% | 0.047%(+13.8)#2 | 0.062%(+13.8)#28 |
| 3. | Warsaw | 1.24% | 0.047%(+1.19)#3 | 0.062%(+1.18)#409 |
| 4. | East Bernstadt | 1.18% | 0.047%(+1.13)#4 | 0.062%(+1.11)#426 |
| 5. | Silver Grove | 0.97% | 0.047%(+0.927)#5 | 0.062%(+0.912)#504 |
| 6. | North Corbin | 0.82% | 0.047%(+0.772)#6 | 0.062%(+0.757)#604 |
| 7. | Centertown | 0.69% | 0.047%(+0.641)#7 | 0.062%(+0.626)#714 |
| 8. | Hindman | 0.62% | 0.047%(+0.572)#8 | 0.062%(+0.557)#793 |
| 9. | Paintsville | 0.51% | 0.047%(+0.468)#9 | 0.062%(+0.453)#926 |
| 10. | Fulton | 0.48% | 0.047%(+0.436)#10 | 0.062%(+0.421)#988 |
| 11. | Marion | 0.45% | 0.047%(+0.401)#11 | 0.062%(+0.386)#1,038 |
| 12. | Massac | 0.44% | 0.047%(+0.398)#12 | 0.062%(+0.383)#1,042 |
| 13. | Corinth | 0.36% | 0.047%(+0.314)#13 | 0.062%(+0.299)#1,225 |
| 14. | Burlington | 0.34% | 0.047%(+0.293)#14 | 0.062%(+0.278)#1,296 |
| 15. | Benton | 0.34% | 0.047%(+0.290)#15 | 0.062%(+0.275)#1,312 |
| 16. | Frankfort | 0.31% | 0.047%(+0.263)#16 | 0.062%(+0.248)#1,396 |
| 17. | Dixon | 0.26% | 0.047%(+0.218)#17 | 0.062%(+0.203)#1,555 |
| 18. | Leitchfield | 0.25% | 0.047%(+0.202)#18 | 0.062%(+0.187)#1,625 |
| 19. | Radcliff | 0.23% | 0.047%(+0.188)#19 | 0.062%(+0.173)#1,670 |
| 20. | West Liberty | 0.22% | 0.047%(+0.169)#20 | 0.062%(+0.154)#1,758 |
| 21. | Cumberland | 0.21% | 0.047%(+0.163)#21 | 0.062%(+0.148)#1,784 |
| 22. | Winchester | 0.20% | 0.047%(+0.152)#22 | 0.062%(+0.138)#1,834 |
| 23. | Farley | 0.20% | 0.047%(+0.151)#23 | 0.062%(+0.136)#1,842 |
| 24. | Bardstown | 0.19% | 0.047%(+0.145)#24 | 0.062%(+0.130)#1,877 |
| 25. | Berea | 0.19% | 0.047%(+0.142)#25 | 0.062%(+0.127)#1,888 |
| 26. | Claryville | 0.18% | 0.047%(+0.132)#26 | 0.062%(+0.117)#1,954 |
| 27. | Orchard Grass Hills | 0.15% | 0.047%(+0.108)#27 | 0.062%(+0.093)#2,076 |
| 28. | Pioneer Village | 0.15% | 0.047%(+0.102)#28 | 0.062%(+0.087)#2,125 |
| 29. | Bowling Green | 0.13% | 0.047%(+0.083)#29 | 0.062%(+0.068)#2,274 |
| 30. | Paducah | 0.12% | 0.047%(+0.072)#30 | 0.062%(+0.058)#2,373 |
| 31. | Sturgis | 0.12% | 0.047%(+0.071)#31 | 0.062%(+0.057)#2,383 |
| 32. | Hazard | 0.12% | 0.047%(+0.069)#32 | 0.062%(+0.054)#2,423 |
| 33. | Nicholasville | 0.11% | 0.047%(+0.062)#33 | 0.062%(+0.047)#2,490 |
| 34. | Hickman | 0.11% | 0.047%(+0.059)#34 | 0.062%(+0.045)#2,508 |
| 35. | London | 0.11% | 0.047%(+0.058)#35 | 0.062%(+0.044)#2,518 |
| 36. | Wilmore | 0.100% | 0.047%(+0.053)#36 | 0.062%(+0.038)#2,568 |
| 37. | Crittenden | 0.099% | 0.047%(+0.053)#37 | 0.062%(+0.038)#2,575 |
| 38. | Camargo | 0.098% | 0.047%(+0.052)#38 | 0.062%(+0.037)#2,584 |
| 39. | Highland Heights | 0.091% | 0.047%(+0.045)#39 | 0.062%(+0.030)#2,643 |
| 40. | La Grange | 0.089% | 0.047%(+0.043)#40 | 0.062%(+0.028)#2,661 |
| 41. | Alexandria | 0.087% | 0.047%(+0.041)#41 | 0.062%(+0.026)#2,681 |
| 42. | Louisville | 0.082% | 0.047%(+0.035)#42 | 0.062%(+0.020)#2,751 |
| 43. | Murray | 0.080% | 0.047%(+0.034)#43 | 0.062%(+0.019)#2,765 |
| 44. | Elizabethtown | 0.080% | 0.047%(+0.033)#44 | 0.062%(+0.018)#2,776 |
| 45. | Pikeville | 0.079% | 0.047%(+0.033)#45 | 0.062%(+0.018)#2,780 |
| 46. | Grayson | 0.078% | 0.047%(+0.031)#46 | 0.062%(+0.017)#2,792 |
| 47. | Russell Springs | 0.074% | 0.047%(+0.027)#47 | 0.062%(+0.012)#2,845 |
| 48. | Morgantown | 0.073% | 0.047%(+0.026)#48 | 0.062%(+0.012)#2,855 |
| 49. | Richmond | 0.066% | 0.047%(+0.019)#49 | 0.062%(+0.004)#2,947 |
| 50. | Munfordville | 0.057% | 0.047%(+0.011)#50 | 0.062%(-0.004)#3,082 |
| 51. | Shepherdsville | 0.057% | 0.047%(+0.010)#51 | 0.062%(-0.005)#3,092 |
| 52. | Southgate | 0.054% | 0.047%(+0.008)#52 | 0.062%(-0.007)#3,119 |
| 53. | Glasgow | 0.053% | 0.047%(+0.007)#53 | 0.062%(-0.008)#3,138 |
| 54. | Danville | 0.047% | 0.047%(-0.000)#54 | 0.062%(-0.015)#3,238 |
| 55. | Ashland | 0.046% | 0.047%(-0.000)#55 | 0.062%(-0.015)#3,240 |
| 56. | Morehead | 0.043% | 0.047%(-0.004)#56 | 0.062%(-0.019)#3,304 |
| 57. | Jamestown | 0.043% | 0.047%(-0.004)#57 | 0.062%(-0.019)#3,306 |
| 58. | Russellville | 0.042% | 0.047%(-0.005)#58 | 0.062%(-0.020)#3,324 |
| 59. | Newport | 0.035% | 0.047%(-0.011)#59 | 0.062%(-0.026)#3,453 |
| 60. | Owensboro | 0.033% | 0.047%(-0.013)#60 | 0.062%(-0.028)#3,490 |
| 61. | Shively | 0.032% | 0.047%(-0.015)#61 | 0.062%(-0.030)#3,519 |
| 62. | Erlanger | 0.031% | 0.047%(-0.016)#62 | 0.062%(-0.031)#3,547 |
| 63. | Florence | 0.028% | 0.047%(-0.019)#63 | 0.062%(-0.033)#3,602 |
| 64. | Fort Thomas | 0.017% | 0.047%(-0.029)#64 | 0.062%(-0.044)#3,801 |
| 65. | Lexington | 0.017% | 0.047%(-0.030)#65 | 0.062%(-0.044)#3,803 |
| 66. | Princeton | 0.016% | 0.047%(-0.031)#66 | 0.062%(-0.046)#3,823 |
Common Questions
What are the Top 10 Cities with the Highest Percentage of Blackfeet Population in Kentucky?
Top 10 Cities with the Highest Percentage of Blackfeet Population in Kentucky are:
#1
14.37%
#2
13.89%
#3
1.24%
#4
1.18%
#5
0.97%
#6
0.82%
#7
0.69%
#8
0.62%
#9
0.51%
#10
0.48%
What city has the Highest Percentage of Blackfeet Population in Kentucky?
Farmington has the Highest Percentage of Blackfeet Population in Kentucky with 14.37%.
What is the Percentage of Blackfeet Population in the State of Kentucky?
Percentage of Blackfeet Population in Kentucky is 0.047%.
What is the Percentage of Blackfeet Population in the United States?
Percentage of Blackfeet Population in the United States is 0.062%.