Cities with the Highest Percentage of Blackfeet Population in Connecticut
RELATED REPORTS & OPTIONS
Blackfeet
Connecticut
Compare Cities
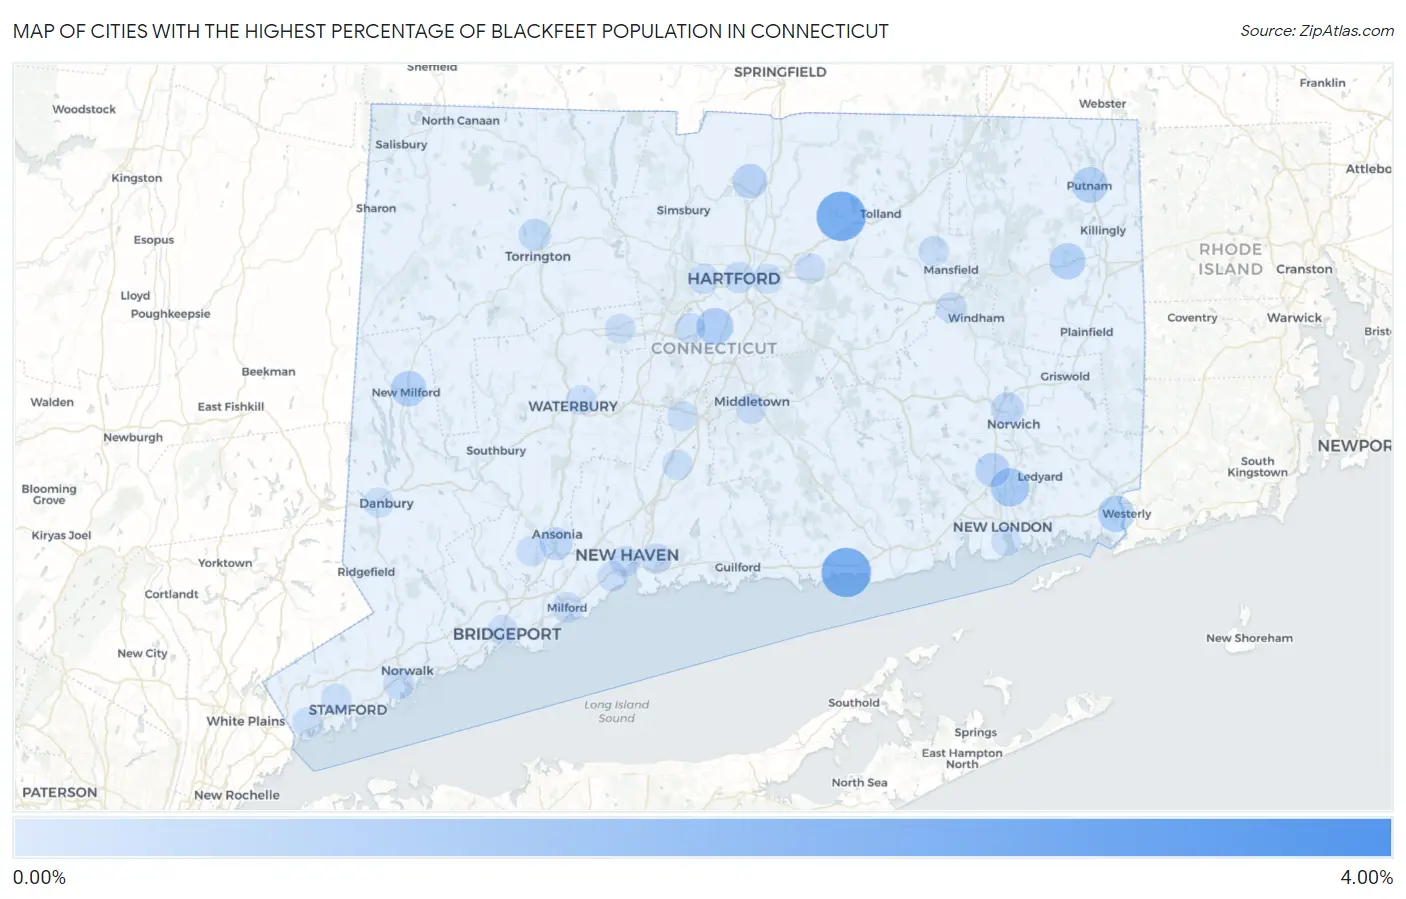
Map of Cities with the Highest Percentage of Blackfeet Population in Connecticut
0.00%
4.00%
Cities with the Highest Percentage of Blackfeet Population in Connecticut
| City | Blackfeet | vs State | vs National | |
| 1. | Gaylordsville | 3.53% | 0.063%(+3.47)#1 | 0.062%(+3.47)#121 |
| 2. | Rockville | 2.16% | 0.063%(+2.09)#2 | 0.062%(+2.10)#204 |
| 3. | Westbrook Center | 2.16% | 0.063%(+2.09)#3 | 0.062%(+2.10)#205 |
| 4. | Woodmont Borough | 1.67% | 0.063%(+1.60)#4 | 0.062%(+1.61)#283 |
| 5. | Gales Ferry | 0.90% | 0.063%(+0.835)#5 | 0.062%(+0.837)#555 |
| 6. | Newington | 0.73% | 0.063%(+0.663)#6 | 0.062%(+0.664)#685 |
| 7. | Pawcatuck | 0.68% | 0.063%(+0.619)#7 | 0.062%(+0.621)#719 |
| 8. | Brooklyn | 0.68% | 0.063%(+0.614)#8 | 0.062%(+0.616)#726 |
| 9. | Putnam | 0.61% | 0.063%(+0.547)#9 | 0.062%(+0.549)#800 |
| 10. | New Milford | 0.61% | 0.063%(+0.543)#10 | 0.062%(+0.544)#805 |
| 11. | Westport | 0.56% | 0.063%(+0.499)#11 | 0.062%(+0.501)#860 |
| 12. | Windsor Locks | 0.50% | 0.063%(+0.438)#12 | 0.062%(+0.440)#950 |
| 13. | Oxoboxo River | 0.45% | 0.063%(+0.390)#13 | 0.062%(+0.391)#1,029 |
| 14. | Norwich | 0.32% | 0.063%(+0.254)#14 | 0.062%(+0.255)#1,370 |
| 15. | Derby | 0.31% | 0.063%(+0.244)#15 | 0.062%(+0.246)#1,407 |
| 16. | Danielson Borough | 0.29% | 0.063%(+0.225)#16 | 0.062%(+0.227)#1,481 |
| 17. | Torrington | 0.27% | 0.063%(+0.210)#17 | 0.062%(+0.212)#1,520 |
| 18. | Hartford | 0.14% | 0.063%(+0.074)#18 | 0.062%(+0.076)#2,214 |
| 19. | Norwalk | 0.13% | 0.063%(+0.070)#19 | 0.062%(+0.071)#2,250 |
| 20. | Quinnipiac University | 0.12% | 0.063%(+0.059)#20 | 0.062%(+0.060)#2,345 |
| 21. | New Britain | 0.10% | 0.063%(+0.041)#21 | 0.062%(+0.042)#2,527 |
| 22. | Willimantic | 0.096% | 0.063%(+0.033)#22 | 0.062%(+0.034)#2,611 |
| 23. | New Haven | 0.077% | 0.063%(+0.014)#23 | 0.062%(+0.015)#2,809 |
| 24. | Storrs | 0.074% | 0.063%(+0.011)#24 | 0.062%(+0.012)#2,842 |
| 25. | East Haven | 0.068% | 0.063%(+0.005)#25 | 0.062%(+0.007)#2,911 |
| 26. | Milford City Balance | 0.061% | 0.063%(-0.002)#26 | 0.062%(-0.000)#3,014 |
| 27. | Manchester | 0.059% | 0.063%(-0.004)#27 | 0.062%(-0.002)#3,042 |
| 28. | West Hartford | 0.056% | 0.063%(-0.007)#28 | 0.062%(-0.005)#3,099 |
| 29. | Wallingford Center | 0.048% | 0.063%(-0.015)#29 | 0.062%(-0.014)#3,208 |
| 30. | Middletown | 0.042% | 0.063%(-0.022)#30 | 0.062%(-0.020)#3,328 |
| 31. | Greenwich | 0.028% | 0.063%(-0.035)#31 | 0.062%(-0.033)#3,591 |
| 32. | West Haven | 0.027% | 0.063%(-0.036)#32 | 0.062%(-0.034)#3,620 |
| 33. | East Hartford | 0.026% | 0.063%(-0.038)#33 | 0.062%(-0.036)#3,652 |
| 34. | Danbury | 0.017% | 0.063%(-0.046)#34 | 0.062%(-0.044)#3,800 |
| 35. | Waterbury | 0.016% | 0.063%(-0.047)#35 | 0.062%(-0.046)#3,825 |
| 36. | Bridgeport | 0.015% | 0.063%(-0.048)#36 | 0.062%(-0.046)#3,831 |
| 37. | Bristol | 0.015% | 0.063%(-0.048)#37 | 0.062%(-0.047)#3,853 |
| 38. | Shelton | 0.012% | 0.063%(-0.051)#38 | 0.062%(-0.049)#3,900 |
| 39. | New London | 0.011% | 0.063%(-0.052)#39 | 0.062%(-0.051)#3,921 |
| 40. | Stamford | 0.010% | 0.063%(-0.053)#40 | 0.062%(-0.051)#3,935 |
| 41. | Meriden | 0.0099% | 0.063%(-0.053)#41 | 0.062%(-0.052)#3,943 |
1
Common Questions
What are the Top 10 Cities with the Highest Percentage of Blackfeet Population in Connecticut?
Top 10 Cities with the Highest Percentage of Blackfeet Population in Connecticut are:
#1
2.16%
#2
2.16%
#3
0.90%
#4
0.73%
#5
0.68%
#6
0.68%
#7
0.61%
#8
0.61%
#9
0.50%
#10
0.45%
What city has the Highest Percentage of Blackfeet Population in Connecticut?
Rockville has the Highest Percentage of Blackfeet Population in Connecticut with 2.16%.
What is the Percentage of Blackfeet Population in the State of Connecticut?
Percentage of Blackfeet Population in Connecticut is 0.063%.
What is the Percentage of Blackfeet Population in the United States?
Percentage of Blackfeet Population in the United States is 0.062%.