Cities with the Highest Percentage of Blackfeet Population in Michigan
RELATED REPORTS & OPTIONS
Blackfeet
Michigan
Compare Cities
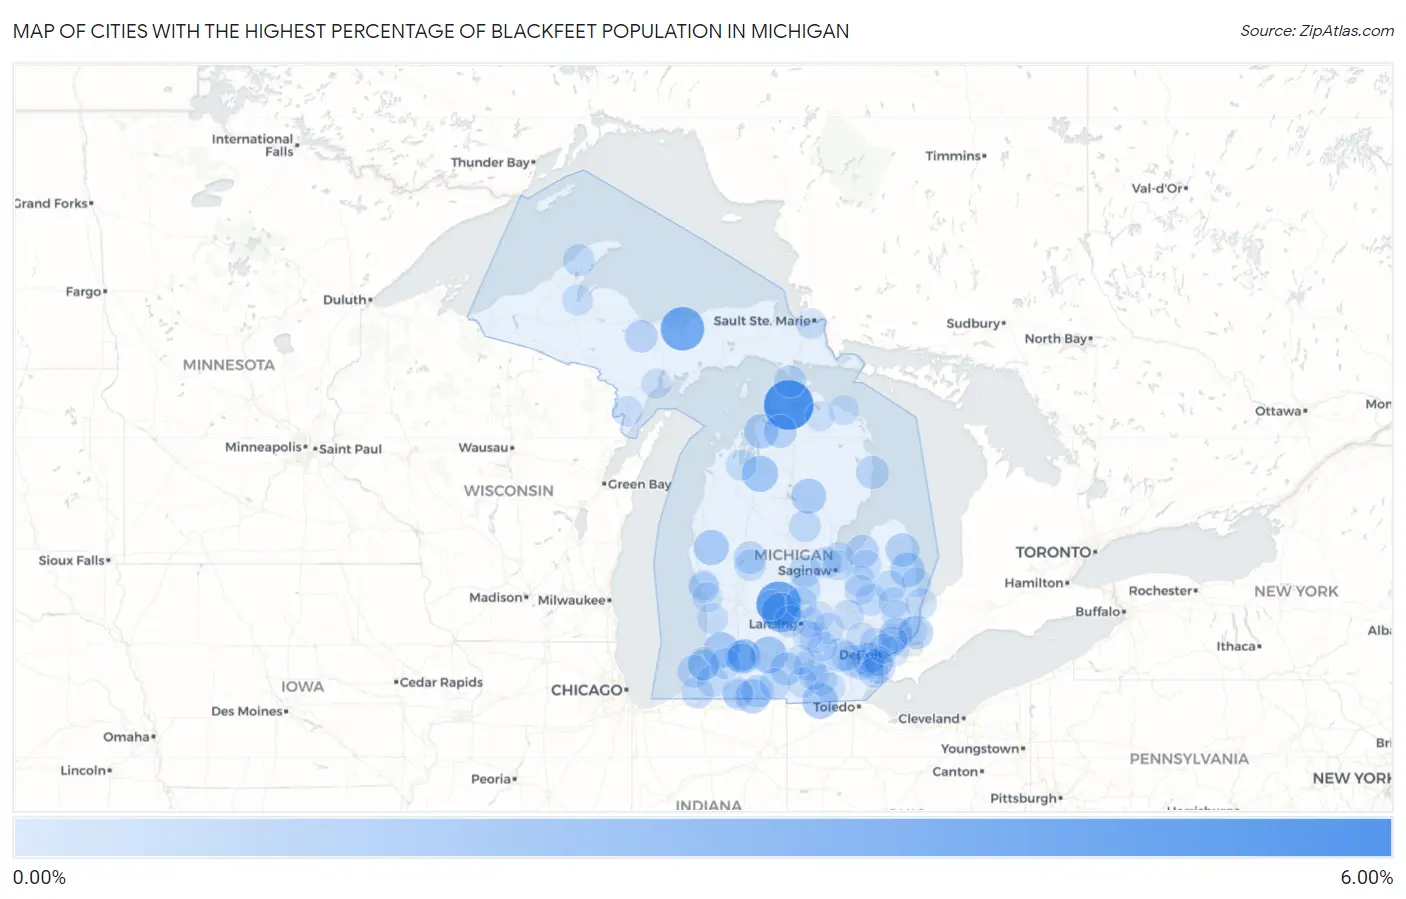
Map of Cities with the Highest Percentage of Blackfeet Population in Michigan
0.00%
6.00%
Cities with the Highest Percentage of Blackfeet Population in Michigan
| City | Blackfeet | vs State | vs National | |
| 1. | Brutus | 5.21% | 0.079%(+5.13)#1 | 0.062%(+5.15)#82 |
| 2. | Lyons | 3.87% | 0.079%(+3.79)#2 | 0.062%(+3.80)#111 |
| 3. | Munising | 3.59% | 0.079%(+3.52)#3 | 0.062%(+3.53)#119 |
| 4. | Tower | 3.19% | 0.079%(+3.12)#4 | 0.062%(+3.13)#139 |
| 5. | Portland | 2.54% | 0.079%(+2.46)#5 | 0.062%(+2.48)#167 |
| 6. | Brownlee Park | 1.76% | 0.079%(+1.68)#6 | 0.062%(+1.70)#264 |
| 7. | South Boardman | 1.63% | 0.079%(+1.55)#7 | 0.062%(+1.57)#292 |
| 8. | Bloomingdale | 1.56% | 0.079%(+1.48)#8 | 0.062%(+1.50)#308 |
| 9. | Morenci | 1.45% | 0.079%(+1.37)#9 | 0.062%(+1.39)#340 |
| 10. | Walkerville | 1.42% | 0.079%(+1.34)#10 | 0.062%(+1.35)#350 |
| 11. | St Helen | 1.35% | 0.079%(+1.27)#11 | 0.062%(+1.28)#371 |
| 12. | Carsonville | 1.25% | 0.079%(+1.17)#12 | 0.062%(+1.19)#403 |
| 13. | Ellsworth | 1.20% | 0.079%(+1.13)#13 | 0.062%(+1.14)#417 |
| 14. | Sturgis | 1.15% | 0.079%(+1.07)#14 | 0.062%(+1.09)#432 |
| 15. | Algonac | 1.01% | 0.079%(+0.929)#15 | 0.062%(+0.946)#483 |
| 16. | Minden City | 0.99% | 0.079%(+0.906)#16 | 0.062%(+0.924)#498 |
| 17. | Eastwood | 0.99% | 0.079%(+0.906)#17 | 0.062%(+0.923)#499 |
| 18. | Boyne Falls | 0.88% | 0.079%(+0.801)#18 | 0.062%(+0.818)#569 |
| 19. | Dexter | 0.87% | 0.079%(+0.787)#19 | 0.062%(+0.804)#578 |
| 20. | Homer | 0.84% | 0.079%(+0.763)#20 | 0.062%(+0.780)#586 |
| 21. | Unionville | 0.84% | 0.079%(+0.762)#21 | 0.062%(+0.779)#590 |
| 22. | Harrisville | 0.80% | 0.079%(+0.721)#22 | 0.062%(+0.738)#618 |
| 23. | Paw Paw Lake | 0.80% | 0.079%(+0.717)#23 | 0.062%(+0.734)#621 |
| 24. | Mount Clemens | 0.78% | 0.079%(+0.699)#24 | 0.062%(+0.717)#639 |
| 25. | K I Sawyer | 0.78% | 0.079%(+0.698)#25 | 0.062%(+0.715)#640 |
| 26. | Wayne | 0.75% | 0.079%(+0.667)#26 | 0.062%(+0.684)#664 |
| 27. | Burr Oak | 0.73% | 0.079%(+0.653)#27 | 0.062%(+0.670)#679 |
| 28. | Benton Harbor | 0.68% | 0.079%(+0.602)#28 | 0.062%(+0.620)#721 |
| 29. | Stanwood | 0.66% | 0.079%(+0.583)#29 | 0.062%(+0.601)#746 |
| 30. | Riverview | 0.65% | 0.079%(+0.575)#30 | 0.062%(+0.592)#754 |
| 31. | Breckenridge | 0.64% | 0.079%(+0.558)#31 | 0.062%(+0.575)#771 |
| 32. | Mackinaw City | 0.61% | 0.079%(+0.532)#32 | 0.062%(+0.549)#798 |
| 33. | Grand Ledge | 0.58% | 0.079%(+0.499)#33 | 0.062%(+0.516)#840 |
| 34. | Buchanan | 0.56% | 0.079%(+0.483)#34 | 0.062%(+0.500)#862 |
| 35. | Vandercook Lake | 0.56% | 0.079%(+0.482)#35 | 0.062%(+0.499)#863 |
| 36. | Calumet | 0.56% | 0.079%(+0.478)#36 | 0.062%(+0.495)#868 |
| 37. | Ypsilanti | 0.54% | 0.079%(+0.466)#37 | 0.062%(+0.483)#883 |
| 38. | Parchment | 0.54% | 0.079%(+0.460)#38 | 0.062%(+0.477)#889 |
| 39. | Westwood | 0.53% | 0.079%(+0.453)#39 | 0.062%(+0.470)#901 |
| 40. | Gladwin | 0.52% | 0.079%(+0.443)#40 | 0.062%(+0.460)#919 |
| 41. | Morley | 0.46% | 0.079%(+0.383)#41 | 0.062%(+0.401)#1,015 |
| 42. | Lapeer | 0.44% | 0.079%(+0.364)#42 | 0.062%(+0.381)#1,049 |
| 43. | Brown City | 0.44% | 0.079%(+0.363)#43 | 0.062%(+0.381)#1,051 |
| 44. | Dowagiac | 0.42% | 0.079%(+0.344)#44 | 0.062%(+0.361)#1,092 |
| 45. | Freeland | 0.42% | 0.079%(+0.343)#45 | 0.062%(+0.360)#1,096 |
| 46. | Ashley | 0.42% | 0.079%(+0.342)#46 | 0.062%(+0.359)#1,098 |
| 47. | St Johns | 0.40% | 0.079%(+0.323)#47 | 0.062%(+0.340)#1,132 |
| 48. | Paw Paw | 0.39% | 0.079%(+0.313)#48 | 0.062%(+0.330)#1,154 |
| 49. | Dansville | 0.38% | 0.079%(+0.299)#49 | 0.062%(+0.316)#1,190 |
| 50. | Traverse City | 0.37% | 0.079%(+0.290)#50 | 0.062%(+0.307)#1,210 |
| 51. | Millington | 0.36% | 0.079%(+0.286)#51 | 0.062%(+0.303)#1,217 |
| 52. | Port Huron | 0.36% | 0.079%(+0.281)#52 | 0.062%(+0.299)#1,226 |
| 53. | Southfield | 0.36% | 0.079%(+0.277)#53 | 0.062%(+0.295)#1,243 |
| 54. | Kalamazoo | 0.35% | 0.079%(+0.274)#54 | 0.062%(+0.292)#1,249 |
| 55. | Coldwater | 0.35% | 0.079%(+0.271)#55 | 0.062%(+0.289)#1,260 |
| 56. | Bay City | 0.35% | 0.079%(+0.270)#56 | 0.062%(+0.287)#1,266 |
| 57. | Onsted | 0.35% | 0.079%(+0.270)#57 | 0.062%(+0.287)#1,268 |
| 58. | White Pigeon | 0.32% | 0.079%(+0.245)#58 | 0.062%(+0.262)#1,351 |
| 59. | Watervliet | 0.32% | 0.079%(+0.240)#59 | 0.062%(+0.257)#1,364 |
| 60. | Romulus | 0.32% | 0.079%(+0.237)#60 | 0.062%(+0.254)#1,378 |
| 61. | Capac | 0.31% | 0.079%(+0.234)#61 | 0.062%(+0.251)#1,384 |
| 62. | Fowlerville | 0.30% | 0.079%(+0.226)#62 | 0.062%(+0.243)#1,421 |
| 63. | Baraga | 0.30% | 0.079%(+0.218)#63 | 0.062%(+0.235)#1,449 |
| 64. | Beechwood | 0.29% | 0.079%(+0.207)#64 | 0.062%(+0.224)#1,488 |
| 65. | Constantine | 0.27% | 0.079%(+0.192)#65 | 0.062%(+0.209)#1,526 |
| 66. | Grosse Pointe Park | 0.27% | 0.079%(+0.190)#66 | 0.062%(+0.208)#1,532 |
| 67. | Lake Fenton | 0.27% | 0.079%(+0.190)#67 | 0.062%(+0.208)#1,534 |
| 68. | Fraser | 0.27% | 0.079%(+0.187)#68 | 0.062%(+0.204)#1,549 |
| 69. | Caro | 0.26% | 0.079%(+0.177)#69 | 0.062%(+0.195)#1,584 |
| 70. | Inkster | 0.25% | 0.079%(+0.173)#70 | 0.062%(+0.190)#1,607 |
| 71. | Roosevelt Park | 0.24% | 0.079%(+0.163)#71 | 0.062%(+0.180)#1,653 |
| 72. | Belleville | 0.23% | 0.079%(+0.147)#72 | 0.062%(+0.165)#1,709 |
| 73. | Barton Hills | 0.23% | 0.079%(+0.146)#73 | 0.062%(+0.164)#1,719 |
| 74. | Otisville | 0.22% | 0.079%(+0.141)#74 | 0.062%(+0.158)#1,743 |
| 75. | Stephenson | 0.21% | 0.079%(+0.136)#75 | 0.062%(+0.153)#1,760 |
| 76. | Sault Ste Marie | 0.21% | 0.079%(+0.130)#76 | 0.062%(+0.147)#1,788 |
| 77. | Escanaba | 0.20% | 0.079%(+0.123)#77 | 0.062%(+0.140)#1,819 |
| 78. | North Adams | 0.20% | 0.079%(+0.117)#78 | 0.062%(+0.135)#1,847 |
| 79. | Cement City | 0.18% | 0.079%(+0.103)#79 | 0.062%(+0.120)#1,932 |
| 80. | Zilwaukee | 0.18% | 0.079%(+0.101)#80 | 0.062%(+0.118)#1,946 |
| 81. | Rogers City | 0.17% | 0.079%(+0.096)#81 | 0.062%(+0.113)#1,974 |
| 82. | Ionia | 0.17% | 0.079%(+0.089)#82 | 0.062%(+0.107)#1,999 |
| 83. | Southgate | 0.17% | 0.079%(+0.088)#83 | 0.062%(+0.105)#2,006 |
| 84. | Flat Rock | 0.16% | 0.079%(+0.084)#84 | 0.062%(+0.101)#2,023 |
| 85. | Stockbridge | 0.16% | 0.079%(+0.080)#85 | 0.062%(+0.097)#2,040 |
| 86. | Haslett | 0.15% | 0.079%(+0.073)#86 | 0.062%(+0.090)#2,099 |
| 87. | Parma | 0.15% | 0.079%(+0.072)#87 | 0.062%(+0.089)#2,103 |
| 88. | Lexington | 0.15% | 0.079%(+0.072)#88 | 0.062%(+0.089)#2,106 |
| 89. | Muskegon | 0.15% | 0.079%(+0.070)#89 | 0.062%(+0.087)#2,124 |
| 90. | Armada | 0.15% | 0.079%(+0.068)#90 | 0.062%(+0.086)#2,141 |
| 91. | Roseville | 0.15% | 0.079%(+0.067)#91 | 0.062%(+0.084)#2,150 |
| 92. | Adrian | 0.14% | 0.079%(+0.057)#92 | 0.062%(+0.074)#2,225 |
| 93. | Wolverine Lake | 0.13% | 0.079%(+0.055)#93 | 0.062%(+0.072)#2,248 |
| 94. | Perry | 0.13% | 0.079%(+0.053)#94 | 0.062%(+0.070)#2,257 |
| 95. | Lincoln Park | 0.13% | 0.079%(+0.049)#95 | 0.062%(+0.067)#2,290 |
| 96. | Onaway | 0.12% | 0.079%(+0.044)#96 | 0.062%(+0.061)#2,333 |
| 97. | Highland Park | 0.12% | 0.079%(+0.043)#97 | 0.062%(+0.060)#2,346 |
| 98. | Mason | 0.12% | 0.079%(+0.042)#98 | 0.062%(+0.059)#2,353 |
| 99. | Spring Lake | 0.12% | 0.079%(+0.040)#99 | 0.062%(+0.057)#2,380 |
| 100. | Pearl Beach | 0.12% | 0.079%(+0.038)#100 | 0.062%(+0.055)#2,406 |
Common Questions
What are the Top 10 Cities with the Highest Percentage of Blackfeet Population in Michigan?
Top 10 Cities with the Highest Percentage of Blackfeet Population in Michigan are:
#1
5.21%
#2
3.87%
#3
3.59%
#4
2.54%
#5
1.76%
#6
1.63%
#7
1.56%
#8
1.45%
#9
1.42%
#10
1.35%
What city has the Highest Percentage of Blackfeet Population in Michigan?
Brutus has the Highest Percentage of Blackfeet Population in Michigan with 5.21%.
What is the Percentage of Blackfeet Population in the State of Michigan?
Percentage of Blackfeet Population in Michigan is 0.079%.
What is the Percentage of Blackfeet Population in the United States?
Percentage of Blackfeet Population in the United States is 0.062%.