Cities with the Highest Percentage of Blackfeet Population in New York
RELATED REPORTS & OPTIONS
Blackfeet
New York
Compare Cities
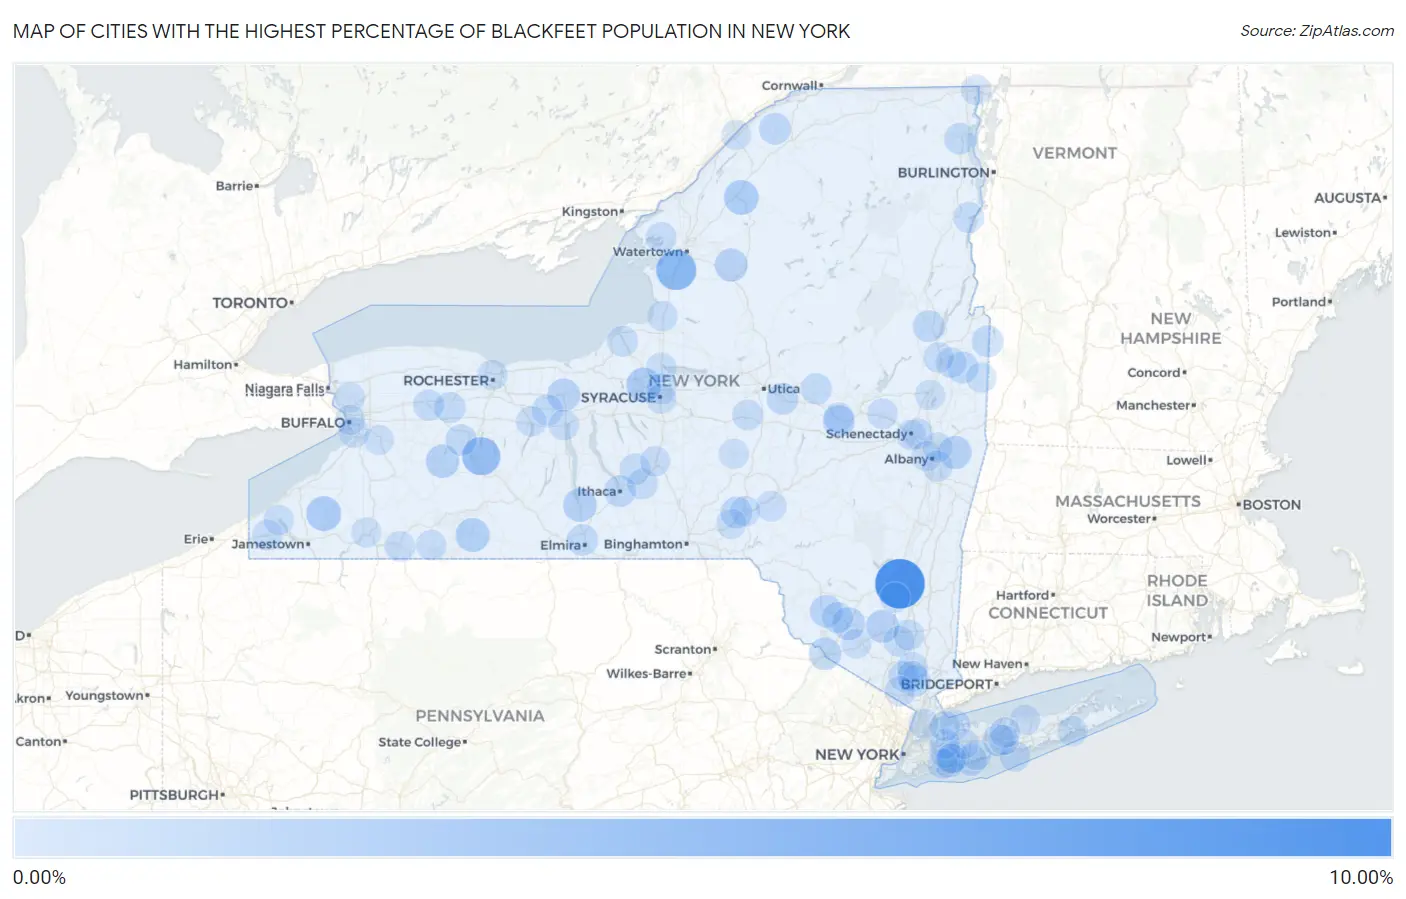
Map of Cities with the Highest Percentage of Blackfeet Population in New York
0.00%
10.00%
Cities with the Highest Percentage of Blackfeet Population in New York
| City | Blackfeet | vs State | vs National | |
| 1. | Rifton | 8.39% | 0.039%(+8.36)#1 | 0.062%(+8.33)#48 |
| 2. | Adams Center | 4.21% | 0.039%(+4.17)#2 | 0.062%(+4.15)#106 |
| 3. | Scottsburg | 3.37% | 0.039%(+3.33)#3 | 0.062%(+3.31)#131 |
| 4. | Cherry Creek | 1.94% | 0.039%(+1.90)#4 | 0.062%(+1.88)#234 |
| 5. | Seneca Knolls | 1.92% | 0.039%(+1.88)#5 | 0.062%(+1.86)#238 |
| 6. | Hailesboro | 1.91% | 0.039%(+1.88)#6 | 0.062%(+1.85)#240 |
| 7. | Andover | 1.57% | 0.039%(+1.53)#7 | 0.062%(+1.51)#303 |
| 8. | Montour Falls | 1.48% | 0.039%(+1.44)#8 | 0.062%(+1.41)#334 |
| 9. | Castile | 1.36% | 0.039%(+1.32)#9 | 0.062%(+1.30)#365 |
| 10. | Poestenkill | 1.33% | 0.039%(+1.29)#10 | 0.062%(+1.26)#376 |
| 11. | Walden | 1.27% | 0.039%(+1.23)#11 | 0.062%(+1.21)#391 |
| 12. | Castorland | 1.24% | 0.039%(+1.20)#12 | 0.062%(+1.18)#406 |
| 13. | Lyons | 1.11% | 0.039%(+1.07)#13 | 0.062%(+1.05)#441 |
| 14. | Wurtsboro | 1.07% | 0.039%(+1.03)#14 | 0.062%(+1.01)#459 |
| 15. | Monticello | 1.01% | 0.039%(+0.972)#15 | 0.062%(+0.949)#479 |
| 16. | Port Jervis | 0.97% | 0.039%(+0.936)#16 | 0.062%(+0.913)#503 |
| 17. | Islandia | 0.92% | 0.039%(+0.886)#17 | 0.062%(+0.863)#530 |
| 18. | Canajoharie | 0.89% | 0.039%(+0.849)#18 | 0.062%(+0.826)#562 |
| 19. | Argyle | 0.82% | 0.039%(+0.781)#19 | 0.062%(+0.758)#602 |
| 20. | Warrensburg | 0.76% | 0.039%(+0.717)#20 | 0.062%(+0.694)#652 |
| 21. | Ithaca | 0.74% | 0.039%(+0.704)#21 | 0.062%(+0.681)#667 |
| 22. | Madrid | 0.73% | 0.039%(+0.691)#22 | 0.062%(+0.668)#683 |
| 23. | Frankfort | 0.72% | 0.039%(+0.680)#23 | 0.062%(+0.657)#693 |
| 24. | Bainbridge | 0.71% | 0.039%(+0.672)#24 | 0.062%(+0.650)#698 |
| 25. | Granville | 0.68% | 0.039%(+0.636)#25 | 0.062%(+0.614)#729 |
| 26. | Plattsburgh West | 0.61% | 0.039%(+0.573)#26 | 0.062%(+0.551)#797 |
| 27. | Elmira Heights | 0.59% | 0.039%(+0.551)#27 | 0.062%(+0.528)#829 |
| 28. | Leicester | 0.59% | 0.039%(+0.551)#28 | 0.062%(+0.528)#830 |
| 29. | Amityville | 0.59% | 0.039%(+0.550)#29 | 0.062%(+0.527)#831 |
| 30. | Dolgeville | 0.50% | 0.039%(+0.466)#30 | 0.062%(+0.443)#944 |
| 31. | Rock Hill | 0.50% | 0.039%(+0.465)#31 | 0.062%(+0.442)#945 |
| 32. | North Merrick | 0.50% | 0.039%(+0.462)#32 | 0.062%(+0.439)#955 |
| 33. | Clifton Springs | 0.49% | 0.039%(+0.451)#33 | 0.062%(+0.428)#975 |
| 34. | Le Roy | 0.44% | 0.039%(+0.400)#34 | 0.062%(+0.377)#1,059 |
| 35. | Batavia | 0.44% | 0.039%(+0.400)#35 | 0.062%(+0.377)#1,061 |
| 36. | Croton On Hudson | 0.41% | 0.039%(+0.374)#36 | 0.062%(+0.351)#1,115 |
| 37. | Westport | 0.40% | 0.039%(+0.360)#37 | 0.062%(+0.337)#1,140 |
| 38. | Groton | 0.39% | 0.039%(+0.354)#38 | 0.062%(+0.331)#1,148 |
| 39. | Niskayuna | 0.39% | 0.039%(+0.354)#39 | 0.062%(+0.331)#1,151 |
| 40. | Stony Point | 0.38% | 0.039%(+0.336)#40 | 0.062%(+0.313)#1,199 |
| 41. | Sherman | 0.35% | 0.039%(+0.314)#41 | 0.062%(+0.291)#1,252 |
| 42. | East Greenbush | 0.35% | 0.039%(+0.311)#42 | 0.062%(+0.288)#1,261 |
| 43. | Minetto | 0.35% | 0.039%(+0.311)#43 | 0.062%(+0.288)#1,262 |
| 44. | Vails Gate | 0.35% | 0.039%(+0.308)#44 | 0.062%(+0.286)#1,275 |
| 45. | Waterville | 0.34% | 0.039%(+0.305)#45 | 0.062%(+0.282)#1,283 |
| 46. | Fire Island | 0.34% | 0.039%(+0.297)#46 | 0.062%(+0.274)#1,316 |
| 47. | Beacon | 0.33% | 0.039%(+0.293)#47 | 0.062%(+0.270)#1,324 |
| 48. | Dryden | 0.33% | 0.039%(+0.288)#48 | 0.062%(+0.265)#1,339 |
| 49. | Peekskill | 0.31% | 0.039%(+0.268)#49 | 0.062%(+0.246)#1,408 |
| 50. | Chaumont | 0.29% | 0.039%(+0.253)#50 | 0.062%(+0.230)#1,470 |
| 51. | Crugers | 0.27% | 0.039%(+0.234)#51 | 0.062%(+0.211)#1,522 |
| 52. | Canandaigua | 0.27% | 0.039%(+0.226)#52 | 0.062%(+0.204)#1,553 |
| 53. | Geneva | 0.26% | 0.039%(+0.222)#53 | 0.062%(+0.199)#1,569 |
| 54. | Franklin | 0.26% | 0.039%(+0.221)#54 | 0.062%(+0.198)#1,571 |
| 55. | Amsterdam | 0.25% | 0.039%(+0.208)#55 | 0.062%(+0.185)#1,636 |
| 56. | Olean | 0.22% | 0.039%(+0.185)#56 | 0.062%(+0.162)#1,723 |
| 57. | Lackawanna | 0.22% | 0.039%(+0.184)#57 | 0.062%(+0.161)#1,727 |
| 58. | Bayville | 0.22% | 0.039%(+0.183)#58 | 0.062%(+0.160)#1,731 |
| 59. | Homer | 0.22% | 0.039%(+0.182)#59 | 0.062%(+0.159)#1,739 |
| 60. | Mattydale | 0.21% | 0.039%(+0.167)#60 | 0.062%(+0.144)#1,798 |
| 61. | Rouses Point | 0.20% | 0.039%(+0.159)#61 | 0.062%(+0.136)#1,841 |
| 62. | Rochester | 0.19% | 0.039%(+0.156)#62 | 0.062%(+0.133)#1,861 |
| 63. | Fort Edward | 0.19% | 0.039%(+0.150)#63 | 0.062%(+0.127)#1,890 |
| 64. | Sidney | 0.19% | 0.039%(+0.148)#64 | 0.062%(+0.125)#1,903 |
| 65. | Hillcrest | 0.18% | 0.039%(+0.145)#65 | 0.062%(+0.122)#1,920 |
| 66. | Rocky Point | 0.18% | 0.039%(+0.144)#66 | 0.062%(+0.121)#1,926 |
| 67. | Richburg | 0.17% | 0.039%(+0.136)#67 | 0.062%(+0.113)#1,973 |
| 68. | West Glens Falls | 0.17% | 0.039%(+0.129)#68 | 0.062%(+0.106)#2,003 |
| 69. | Garden City | 0.17% | 0.039%(+0.128)#69 | 0.062%(+0.105)#2,012 |
| 70. | Baldwin | 0.16% | 0.039%(+0.121)#70 | 0.062%(+0.098)#2,036 |
| 71. | Lake Grove | 0.15% | 0.039%(+0.115)#71 | 0.062%(+0.092)#2,086 |
| 72. | Mayville | 0.15% | 0.039%(+0.109)#72 | 0.062%(+0.086)#2,138 |
| 73. | Pulaski | 0.14% | 0.039%(+0.105)#73 | 0.062%(+0.082)#2,164 |
| 74. | Palatine Bridge | 0.14% | 0.039%(+0.104)#74 | 0.062%(+0.081)#2,171 |
| 75. | Schenectady | 0.14% | 0.039%(+0.099)#75 | 0.062%(+0.076)#2,213 |
| 76. | Albany | 0.13% | 0.039%(+0.090)#76 | 0.062%(+0.067)#2,288 |
| 77. | Rochester Institute Of Technology | 0.12% | 0.039%(+0.080)#77 | 0.062%(+0.057)#2,379 |
| 78. | Salem | 0.12% | 0.039%(+0.078)#78 | 0.062%(+0.056)#2,396 |
| 79. | West Babylon | 0.12% | 0.039%(+0.078)#79 | 0.062%(+0.055)#2,398 |
| 80. | East Aurora | 0.12% | 0.039%(+0.078)#80 | 0.062%(+0.055)#2,400 |
| 81. | Plainview | 0.12% | 0.039%(+0.078)#81 | 0.062%(+0.055)#2,404 |
| 82. | Roslyn Heights | 0.12% | 0.039%(+0.077)#82 | 0.062%(+0.054)#2,422 |
| 83. | North Tonawanda | 0.11% | 0.039%(+0.073)#83 | 0.062%(+0.050)#2,460 |
| 84. | Ogdensburg | 0.11% | 0.039%(+0.072)#84 | 0.062%(+0.050)#2,465 |
| 85. | Saratoga Springs | 0.11% | 0.039%(+0.070)#85 | 0.062%(+0.047)#2,486 |
| 86. | Hampton Bays | 0.11% | 0.039%(+0.068)#86 | 0.062%(+0.045)#2,506 |
| 87. | New Paltz | 0.10% | 0.039%(+0.065)#87 | 0.062%(+0.042)#2,530 |
| 88. | Salamanca | 0.10% | 0.039%(+0.063)#88 | 0.062%(+0.040)#2,547 |
| 89. | East Rockaway | 0.099% | 0.039%(+0.061)#89 | 0.062%(+0.038)#2,574 |
| 90. | Glen Cove | 0.096% | 0.039%(+0.057)#90 | 0.062%(+0.034)#2,608 |
| 91. | Watervliet | 0.087% | 0.039%(+0.049)#91 | 0.062%(+0.026)#2,683 |
| 92. | Afton | 0.086% | 0.039%(+0.048)#92 | 0.062%(+0.025)#2,691 |
| 93. | Sherburne | 0.084% | 0.039%(+0.046)#93 | 0.062%(+0.023)#2,718 |
| 94. | Syracuse | 0.079% | 0.039%(+0.041)#94 | 0.062%(+0.018)#2,779 |
| 95. | Buffalo | 0.075% | 0.039%(+0.036)#95 | 0.062%(+0.013)#2,830 |
| 96. | Ronkonkoma | 0.069% | 0.039%(+0.030)#96 | 0.062%(+0.007)#2,903 |
| 97. | Roosevelt | 0.068% | 0.039%(+0.029)#97 | 0.062%(+0.006)#2,921 |
| 98. | Middletown | 0.066% | 0.039%(+0.028)#98 | 0.062%(+0.005)#2,942 |
| 99. | Brewerton | 0.064% | 0.039%(+0.025)#99 | 0.062%(+0.002)#2,982 |
| 100. | Mount Vernon | 0.060% | 0.039%(+0.022)#100 | 0.062%(-0.001)#3,025 |
Common Questions
What are the Top 10 Cities with the Highest Percentage of Blackfeet Population in New York?
Top 10 Cities with the Highest Percentage of Blackfeet Population in New York are:
#1
8.39%
#2
4.21%
#3
3.37%
#4
1.94%
#5
1.92%
#6
1.91%
#7
1.57%
#8
1.48%
#9
1.36%
#10
1.33%
What city has the Highest Percentage of Blackfeet Population in New York?
Rifton has the Highest Percentage of Blackfeet Population in New York with 8.39%.
What is the Percentage of Blackfeet Population in the State of New York?
Percentage of Blackfeet Population in New York is 0.039%.
What is the Percentage of Blackfeet Population in the United States?
Percentage of Blackfeet Population in the United States is 0.062%.