Cities with the Highest Percentage of Blackfeet Population in Montana
RELATED REPORTS & OPTIONS
Blackfeet
Montana
Compare Cities
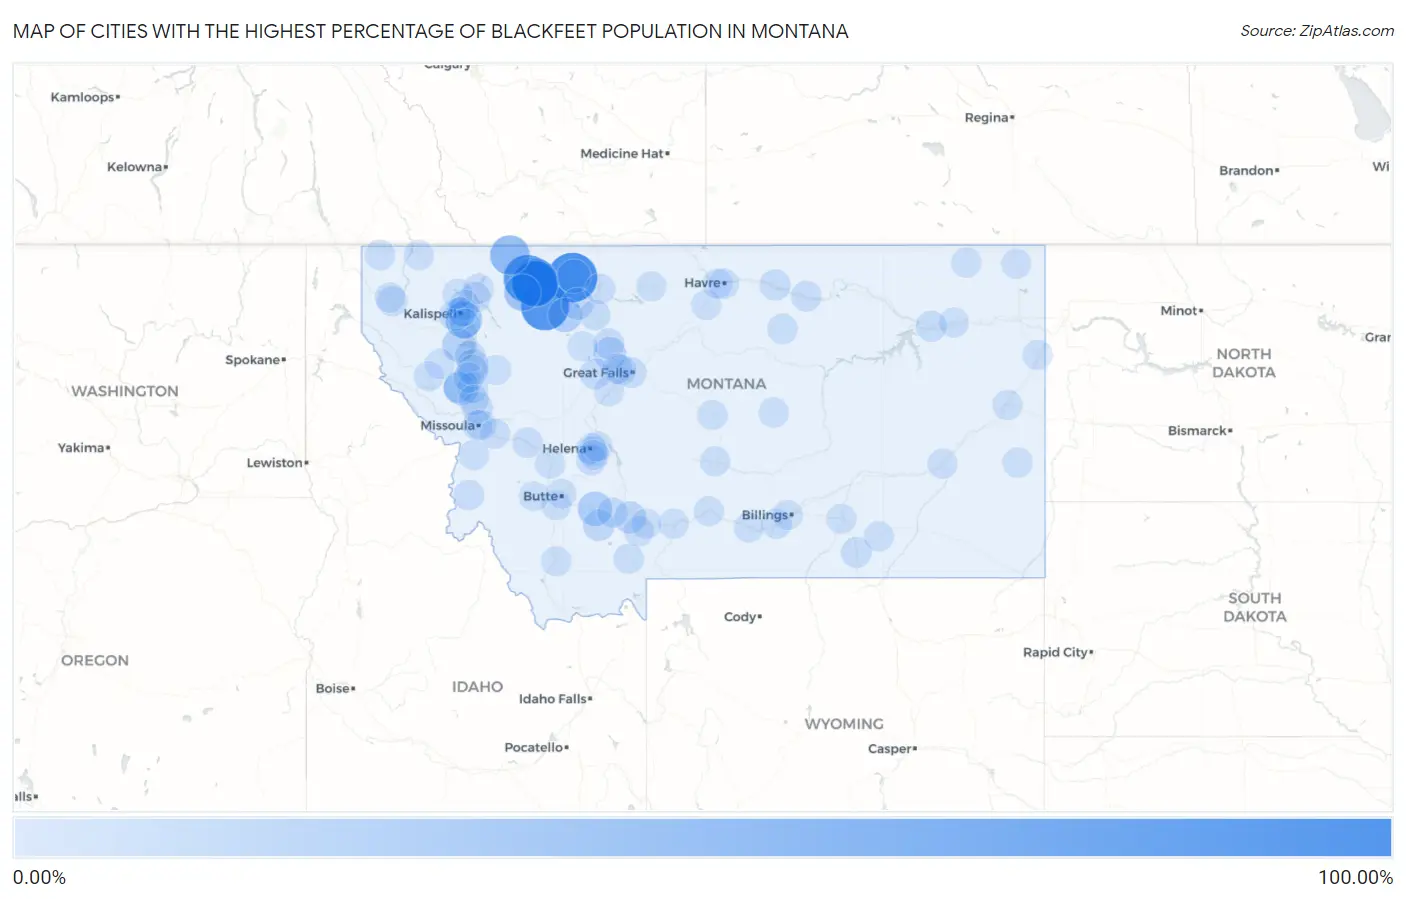
Map of Cities with the Highest Percentage of Blackfeet Population in Montana
0.00%
100.00%
Cities with the Highest Percentage of Blackfeet Population in Montana
| City | Blackfeet | vs State | vs National | |
| 1. | Little Browning | 100.00% | 1.35%(+98.6)#1 | 0.062%(+99.9)#2 |
| 2. | Heart Butte | 92.78% | 1.35%(+91.4)#2 | 0.062%(+92.7)#3 |
| 3. | Starr School | 89.96% | 1.35%(+88.6)#3 | 0.062%(+89.9)#4 |
| 4. | North Browning | 88.34% | 1.35%(+87.0)#4 | 0.062%(+88.3)#5 |
| 5. | Browning | 85.65% | 1.35%(+84.3)#5 | 0.062%(+85.6)#6 |
| 6. | South Browning | 82.35% | 1.35%(+81.0)#6 | 0.062%(+82.3)#7 |
| 7. | Blackfoot | 68.75% | 1.35%(+67.4)#7 | 0.062%(+68.7)#8 |
| 8. | Babb | 47.23% | 1.35%(+45.9)#8 | 0.062%(+47.2)#10 |
| 9. | Forest Hill Village | 33.61% | 1.35%(+32.3)#9 | 0.062%(+33.5)#12 |
| 10. | East Glacier Park Village | 32.06% | 1.35%(+30.7)#10 | 0.062%(+32.0)#14 |
| 11. | Old Agency | 23.53% | 1.35%(+22.2)#11 | 0.062%(+23.5)#18 |
| 12. | Cardwell | 20.83% | 1.35%(+19.5)#12 | 0.062%(+20.8)#20 |
| 13. | Dupuyer | 19.83% | 1.35%(+18.5)#13 | 0.062%(+19.8)#21 |
| 14. | Cut Bank | 17.94% | 1.35%(+16.6)#14 | 0.062%(+17.9)#22 |
| 15. | Elmo | 16.27% | 1.35%(+14.9)#15 | 0.062%(+16.2)#26 |
| 16. | Power | 13.20% | 1.35%(+11.8)#16 | 0.062%(+13.1)#30 |
| 17. | Amsterdam | 10.00% | 1.35%(+8.65)#17 | 0.062%(+9.94)#39 |
| 18. | St. Mary | 9.92% | 1.35%(+8.56)#18 | 0.062%(+9.86)#41 |
| 19. | Valier | 8.85% | 1.35%(+7.50)#19 | 0.062%(+8.79)#45 |
| 20. | Pablo | 8.45% | 1.35%(+7.09)#20 | 0.062%(+8.39)#47 |
| 21. | Montaqua | 8.16% | 1.35%(+6.81)#21 | 0.062%(+8.10)#50 |
| 22. | Pony | 8.03% | 1.35%(+6.67)#22 | 0.062%(+7.97)#51 |
| 23. | Batavia | 7.13% | 1.35%(+5.78)#23 | 0.062%(+7.07)#61 |
| 24. | Glacier Colony | 4.96% | 1.35%(+3.61)#24 | 0.062%(+4.90)#86 |
| 25. | St Ignatius | 4.32% | 1.35%(+2.96)#25 | 0.062%(+4.26)#101 |
| 26. | Harlem | 4.08% | 1.35%(+2.72)#26 | 0.062%(+4.02)#108 |
| 27. | Polson | 3.97% | 1.35%(+2.61)#27 | 0.062%(+3.91)#109 |
| 28. | Evaro | 3.76% | 1.35%(+2.41)#28 | 0.062%(+3.70)#115 |
| 29. | Simms | 3.34% | 1.35%(+1.99)#29 | 0.062%(+3.28)#133 |
| 30. | Dixon | 3.12% | 1.35%(+1.77)#30 | 0.062%(+3.06)#142 |
| 31. | Frazer | 3.01% | 1.35%(+1.66)#31 | 0.062%(+2.95)#144 |
| 32. | Ronan | 3.00% | 1.35%(+1.64)#32 | 0.062%(+2.94)#146 |
| 33. | Hungry Horse | 2.92% | 1.35%(+1.56)#33 | 0.062%(+2.86)#150 |
| 34. | Conrad | 2.69% | 1.35%(+1.33)#34 | 0.062%(+2.63)#156 |
| 35. | Dutton | 2.64% | 1.35%(+1.29)#35 | 0.062%(+2.58)#158 |
| 36. | Lodge Grass | 2.61% | 1.35%(+1.26)#36 | 0.062%(+2.55)#162 |
| 37. | Dodson | 2.52% | 1.35%(+1.17)#37 | 0.062%(+2.46)#169 |
| 38. | Clancy | 2.34% | 1.35%(+0.980)#38 | 0.062%(+2.27)#184 |
| 39. | Drummond | 2.17% | 1.35%(+0.811)#39 | 0.062%(+2.10)#203 |
| 40. | East Missoula | 2.09% | 1.35%(+0.735)#40 | 0.062%(+2.03)#210 |
| 41. | Willow Creek | 1.90% | 1.35%(+0.541)#41 | 0.062%(+1.83)#246 |
| 42. | Great Falls | 1.87% | 1.35%(+0.515)#42 | 0.062%(+1.81)#249 |
| 43. | Yaak | 1.82% | 1.35%(+0.463)#43 | 0.062%(+1.76)#254 |
| 44. | West Glacier | 1.72% | 1.35%(+0.369)#44 | 0.062%(+1.66)#267 |
| 45. | Charlo | 1.69% | 1.35%(+0.331)#45 | 0.062%(+1.62)#278 |
| 46. | Sun Prairie | 1.68% | 1.35%(+0.329)#46 | 0.062%(+1.62)#280 |
| 47. | Havre | 1.66% | 1.35%(+0.306)#47 | 0.062%(+1.60)#286 |
| 48. | Darby | 1.64% | 1.35%(+0.284)#48 | 0.062%(+1.58)#291 |
| 49. | White Haven | 1.43% | 1.35%(+0.076)#49 | 0.062%(+1.37)#348 |
| 50. | Laurel | 1.28% | 1.35%(-0.074)#50 | 0.062%(+1.22)#388 |
| 51. | Shelby | 1.24% | 1.35%(-0.112)#51 | 0.062%(+1.18)#405 |
| 52. | Hays | 1.10% | 1.35%(-0.259)#52 | 0.062%(+1.03)#447 |
| 53. | Helena Flats | 1.03% | 1.35%(-0.328)#53 | 0.062%(+0.966)#473 |
| 54. | Arlee | 1.01% | 1.35%(-0.345)#54 | 0.062%(+0.949)#480 |
| 55. | Helena | 0.99% | 1.35%(-0.365)#55 | 0.062%(+0.928)#496 |
| 56. | Missoula | 0.96% | 1.35%(-0.398)#56 | 0.062%(+0.895)#510 |
| 57. | Grass Range | 0.90% | 1.35%(-0.454)#57 | 0.062%(+0.839)#552 |
| 58. | Stevensville | 0.88% | 1.35%(-0.472)#58 | 0.062%(+0.822)#565 |
| 59. | Cascade | 0.88% | 1.35%(-0.476)#59 | 0.062%(+0.817)#570 |
| 60. | Big Timber | 0.82% | 1.35%(-0.532)#60 | 0.062%(+0.761)#601 |
| 61. | South Hills | 0.79% | 1.35%(-0.560)#61 | 0.062%(+0.733)#622 |
| 62. | Big Sky | 0.71% | 1.35%(-0.647)#62 | 0.062%(+0.646)#701 |
| 63. | Condon | 0.65% | 1.35%(-0.703)#63 | 0.062%(+0.590)#755 |
| 64. | Choteau | 0.64% | 1.35%(-0.713)#64 | 0.062%(+0.580)#764 |
| 65. | Rocky Boy West | 0.64% | 1.35%(-0.715)#65 | 0.062%(+0.579)#767 |
| 66. | Deer Lodge | 0.63% | 1.35%(-0.728)#66 | 0.062%(+0.565)#784 |
| 67. | Butte Silver Bow Balance | 0.60% | 1.35%(-0.754)#67 | 0.062%(+0.539)#812 |
| 68. | Hobson | 0.59% | 1.35%(-0.763)#68 | 0.062%(+0.530)#826 |
| 69. | Evergreen | 0.58% | 1.35%(-0.779)#69 | 0.062%(+0.514)#845 |
| 70. | Gallatin Gateway | 0.56% | 1.35%(-0.791)#70 | 0.062%(+0.503)#858 |
| 71. | Hardin | 0.53% | 1.35%(-0.829)#71 | 0.062%(+0.464)#912 |
| 72. | Hot Springs | 0.49% | 1.35%(-0.865)#72 | 0.062%(+0.428)#977 |
| 73. | Whitefish | 0.48% | 1.35%(-0.873)#73 | 0.062%(+0.420)#989 |
| 74. | Libby | 0.46% | 1.35%(-0.900)#74 | 0.062%(+0.393)#1,025 |
| 75. | Livingston | 0.45% | 1.35%(-0.907)#75 | 0.062%(+0.386)#1,037 |
| 76. | Busby | 0.42% | 1.35%(-0.933)#76 | 0.062%(+0.360)#1,094 |
| 77. | Clinton | 0.40% | 1.35%(-0.952)#77 | 0.062%(+0.341)#1,130 |
| 78. | Plevna | 0.40% | 1.35%(-0.955)#78 | 0.062%(+0.338)#1,137 |
| 79. | Plentywood | 0.39% | 1.35%(-0.962)#79 | 0.062%(+0.331)#1,147 |
| 80. | Kalispell | 0.38% | 1.35%(-0.970)#80 | 0.062%(+0.323)#1,168 |
| 81. | Eureka | 0.34% | 1.35%(-1.02)#81 | 0.062%(+0.274)#1,317 |
| 82. | Billings | 0.33% | 1.35%(-1.02)#82 | 0.062%(+0.272)#1,322 |
| 83. | Columbus | 0.31% | 1.35%(-1.04)#83 | 0.062%(+0.249)#1,392 |
| 84. | Vaughn | 0.31% | 1.35%(-1.05)#84 | 0.062%(+0.246)#1,399 |
| 85. | Dillon | 0.30% | 1.35%(-1.05)#85 | 0.062%(+0.242)#1,431 |
| 86. | Walkerville | 0.30% | 1.35%(-1.06)#86 | 0.062%(+0.238)#1,441 |
| 87. | Anaconda Deer Lodge County | 0.29% | 1.35%(-1.07)#87 | 0.062%(+0.225)#1,485 |
| 88. | Beaver Creek | 0.26% | 1.35%(-1.09)#88 | 0.062%(+0.200)#1,565 |
| 89. | Sidney | 0.26% | 1.35%(-1.10)#89 | 0.062%(+0.194)#1,589 |
| 90. | Miles City | 0.23% | 1.35%(-1.13)#90 | 0.062%(+0.164)#1,717 |
| 91. | Bozeman | 0.22% | 1.35%(-1.14)#91 | 0.062%(+0.155)#1,751 |
| 92. | Harlowton | 0.20% | 1.35%(-1.15)#92 | 0.062%(+0.139)#1,826 |
| 93. | Wolf Point | 0.15% | 1.35%(-1.20)#93 | 0.062%(+0.090)#2,100 |
| 94. | Chester | 0.13% | 1.35%(-1.23)#94 | 0.062%(+0.068)#2,281 |
| 95. | Helena Valley Southeast | 0.13% | 1.35%(-1.23)#95 | 0.062%(+0.066)#2,292 |
| 96. | Scobey | 0.13% | 1.35%(-1.23)#96 | 0.062%(+0.065)#2,300 |
| 97. | Montana City | 0.11% | 1.35%(-1.24)#97 | 0.062%(+0.049)#2,468 |
| 98. | Somers | 0.096% | 1.35%(-1.26)#98 | 0.062%(+0.035)#2,603 |
| 99. | Plains | 0.085% | 1.35%(-1.27)#99 | 0.062%(+0.023)#2,713 |
| 100. | Glendive | 0.082% | 1.35%(-1.27)#100 | 0.062%(+0.021)#2,748 |
Common Questions
What are the Top 10 Cities with the Highest Percentage of Blackfeet Population in Montana?
Top 10 Cities with the Highest Percentage of Blackfeet Population in Montana are:
#1
100.00%
#2
92.78%
#3
89.96%
#4
88.34%
#5
85.65%
#6
82.35%
#7
47.23%
#8
33.61%
#9
32.06%
#10
23.53%
What city has the Highest Percentage of Blackfeet Population in Montana?
Little Browning has the Highest Percentage of Blackfeet Population in Montana with 100.00%.
What is the Percentage of Blackfeet Population in the State of Montana?
Percentage of Blackfeet Population in Montana is 1.35%.
What is the Percentage of Blackfeet Population in the United States?
Percentage of Blackfeet Population in the United States is 0.062%.