Cities with the Highest Percentage of Blackfeet Population in Ohio
RELATED REPORTS & OPTIONS
Blackfeet
Ohio
Compare Cities
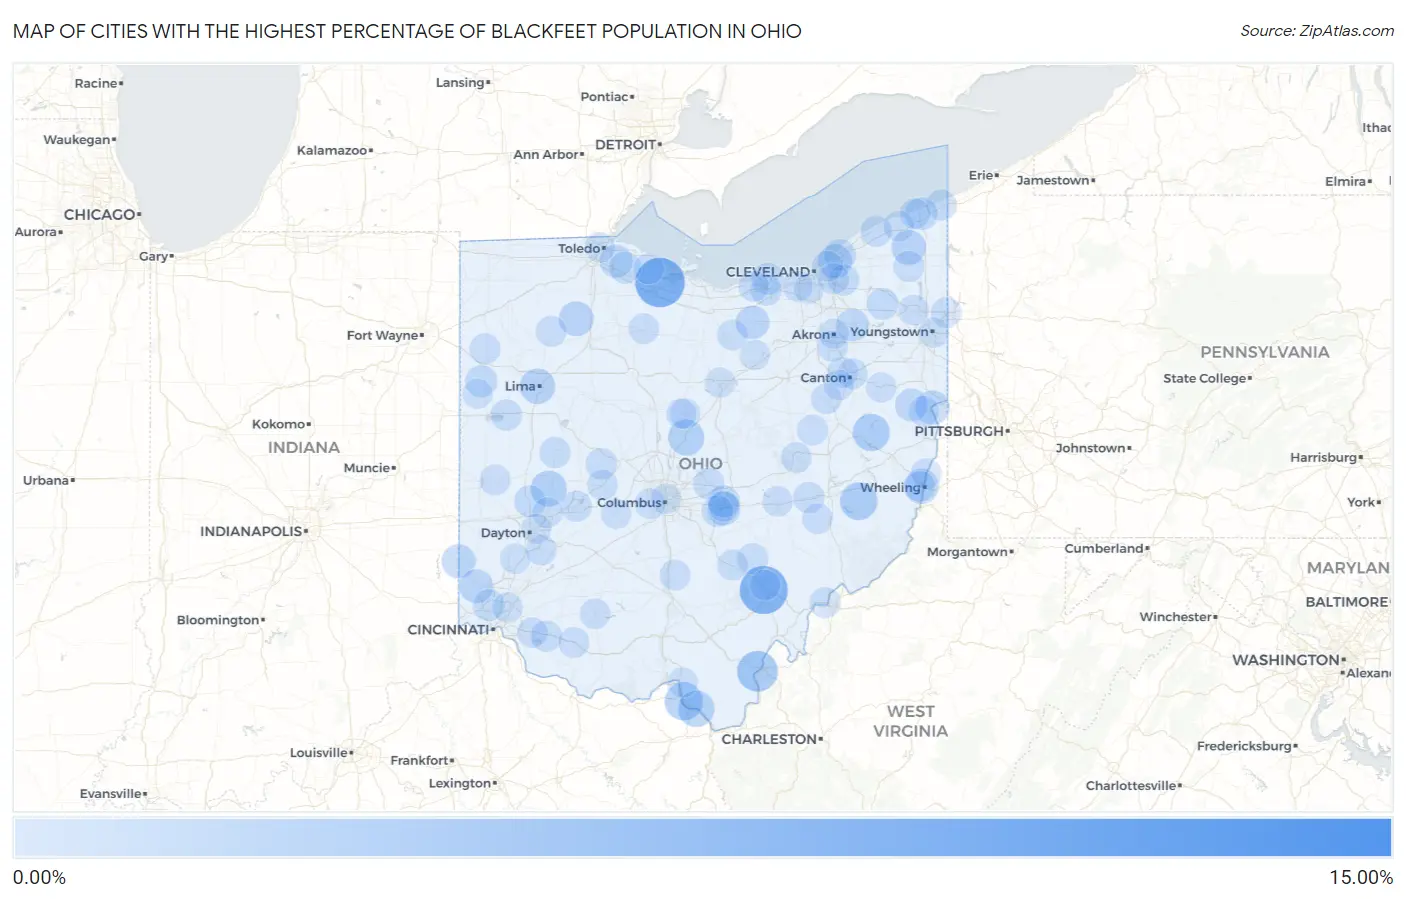
Map of Cities with the Highest Percentage of Blackfeet Population in Ohio
0.00%
15.00%
Cities with the Highest Percentage of Blackfeet Population in Ohio
| City | Blackfeet | vs State | vs National | |
| 1. | South Mount Vernon | 10.32% | 0.10%(+10.2)#1 | 0.062%(+10.3)#38 |
| 2. | Wightmans Grove | 6.25% | 0.10%(+6.15)#2 | 0.062%(+6.19)#69 |
| 3. | The Plains | 5.80% | 0.10%(+5.70)#3 | 0.062%(+5.74)#74 |
| 4. | Gallipolis | 3.45% | 0.10%(+3.34)#4 | 0.062%(+3.38)#127 |
| 5. | Franklin Furnace | 2.64% | 0.10%(+2.53)#5 | 0.062%(+2.58)#160 |
| 6. | Quaker City | 2.49% | 0.10%(+2.39)#6 | 0.062%(+2.43)#171 |
| 7. | Bowerston | 2.33% | 0.10%(+2.22)#7 | 0.062%(+2.26)#188 |
| 8. | Hanging Rock | 2.07% | 0.10%(+1.96)#8 | 0.062%(+2.01)#215 |
| 9. | Marengo | 2.04% | 0.10%(+1.94)#9 | 0.062%(+1.98)#218 |
| 10. | Christiansburg | 2.02% | 0.10%(+1.92)#10 | 0.062%(+1.96)#224 |
| 11. | Lima | 1.77% | 0.10%(+1.67)#11 | 0.062%(+1.71)#262 |
| 12. | Bridgeport | 1.66% | 0.10%(+1.55)#12 | 0.062%(+1.59)#288 |
| 13. | Hoytville | 1.63% | 0.10%(+1.53)#13 | 0.062%(+1.57)#293 |
| 14. | Rock Creek | 1.53% | 0.10%(+1.42)#14 | 0.062%(+1.46)#321 |
| 15. | Wellsville | 1.45% | 0.10%(+1.34)#15 | 0.062%(+1.39)#341 |
| 16. | Richmond Heights | 1.39% | 0.10%(+1.29)#16 | 0.062%(+1.33)#358 |
| 17. | College Corner | 1.36% | 0.10%(+1.25)#17 | 0.062%(+1.29)#370 |
| 18. | Millville | 1.31% | 0.10%(+1.20)#18 | 0.062%(+1.25)#379 |
| 19. | Wellington | 1.24% | 0.10%(+1.14)#19 | 0.062%(+1.18)#404 |
| 20. | Fairfield Beach | 1.20% | 0.10%(+1.10)#20 | 0.062%(+1.14)#419 |
| 21. | Millbury | 1.04% | 0.10%(+0.938)#21 | 0.062%(+0.981)#471 |
| 22. | Salineville | 1.00% | 0.10%(+0.900)#22 | 0.062%(+0.943)#484 |
| 23. | Kent | 1.00% | 0.10%(+0.890)#23 | 0.062%(+0.933)#488 |
| 24. | Edgewood | 0.94% | 0.10%(+0.831)#24 | 0.062%(+0.874)#518 |
| 25. | Ohio City | 0.81% | 0.10%(+0.710)#25 | 0.062%(+0.753)#607 |
| 26. | Genoa | 0.78% | 0.10%(+0.680)#26 | 0.062%(+0.723)#630 |
| 27. | Wickliffe | 0.78% | 0.10%(+0.677)#27 | 0.062%(+0.720)#631 |
| 28. | Sheffield | 0.73% | 0.10%(+0.629)#28 | 0.062%(+0.672)#677 |
| 29. | Hebron | 0.72% | 0.10%(+0.620)#29 | 0.062%(+0.663)#688 |
| 30. | Garrettsville | 0.69% | 0.10%(+0.590)#30 | 0.062%(+0.633)#709 |
| 31. | Tipp City | 0.68% | 0.10%(+0.577)#31 | 0.062%(+0.620)#720 |
| 32. | New Burlington | 0.66% | 0.10%(+0.553)#32 | 0.062%(+0.596)#750 |
| 33. | North Lewisburg | 0.62% | 0.10%(+0.518)#33 | 0.062%(+0.561)#789 |
| 34. | Millersport | 0.62% | 0.10%(+0.511)#34 | 0.062%(+0.554)#794 |
| 35. | Alexandria | 0.59% | 0.10%(+0.487)#35 | 0.062%(+0.530)#823 |
| 36. | Elyria | 0.57% | 0.10%(+0.464)#36 | 0.062%(+0.507)#853 |
| 37. | St Marys | 0.53% | 0.10%(+0.424)#37 | 0.062%(+0.467)#907 |
| 38. | New Straitsville | 0.52% | 0.10%(+0.419)#38 | 0.062%(+0.462)#917 |
| 39. | Springfield | 0.51% | 0.10%(+0.409)#39 | 0.062%(+0.452)#929 |
| 40. | Perry | 0.51% | 0.10%(+0.402)#40 | 0.062%(+0.445)#938 |
| 41. | New Concord | 0.50% | 0.10%(+0.397)#41 | 0.062%(+0.440)#952 |
| 42. | Belpre | 0.49% | 0.10%(+0.389)#42 | 0.062%(+0.432)#968 |
| 43. | Quincy | 0.49% | 0.10%(+0.388)#43 | 0.062%(+0.431)#971 |
| 44. | Conneaut | 0.48% | 0.10%(+0.380)#44 | 0.062%(+0.423)#984 |
| 45. | Moreland Hills | 0.47% | 0.10%(+0.361)#45 | 0.062%(+0.404)#1,011 |
| 46. | Williamsburg | 0.46% | 0.10%(+0.360)#46 | 0.062%(+0.403)#1,014 |
| 47. | Baltic | 0.45% | 0.10%(+0.342)#47 | 0.062%(+0.385)#1,040 |
| 48. | Orwell | 0.44% | 0.10%(+0.339)#48 | 0.062%(+0.382)#1,046 |
| 49. | Scott | 0.44% | 0.10%(+0.338)#49 | 0.062%(+0.381)#1,050 |
| 50. | Buckeye Lake | 0.44% | 0.10%(+0.332)#50 | 0.062%(+0.375)#1,063 |
| 51. | Oak Harbor | 0.44% | 0.10%(+0.332)#51 | 0.062%(+0.375)#1,065 |
| 52. | Logan | 0.43% | 0.10%(+0.328)#52 | 0.062%(+0.371)#1,070 |
| 53. | Highland Hills | 0.43% | 0.10%(+0.325)#53 | 0.062%(+0.368)#1,082 |
| 54. | West Leipsic | 0.40% | 0.10%(+0.300)#54 | 0.062%(+0.343)#1,126 |
| 55. | New London | 0.40% | 0.10%(+0.291)#55 | 0.062%(+0.334)#1,143 |
| 56. | Hills And Dales | 0.39% | 0.10%(+0.289)#56 | 0.062%(+0.332)#1,146 |
| 57. | Amherst | 0.39% | 0.10%(+0.288)#57 | 0.062%(+0.331)#1,153 |
| 58. | Kingston | 0.39% | 0.10%(+0.287)#58 | 0.062%(+0.330)#1,155 |
| 59. | Tiffin | 0.39% | 0.10%(+0.281)#59 | 0.062%(+0.324)#1,165 |
| 60. | East Cleveland | 0.38% | 0.10%(+0.276)#60 | 0.062%(+0.319)#1,180 |
| 61. | Sardinia | 0.38% | 0.10%(+0.272)#61 | 0.062%(+0.315)#1,192 |
| 62. | Mechanicsburg | 0.38% | 0.10%(+0.272)#62 | 0.062%(+0.315)#1,194 |
| 63. | Mount Gilead | 0.38% | 0.10%(+0.271)#63 | 0.062%(+0.314)#1,196 |
| 64. | Lincoln Village | 0.37% | 0.10%(+0.262)#64 | 0.062%(+0.305)#1,215 |
| 65. | West Hill | 0.36% | 0.10%(+0.254)#65 | 0.062%(+0.297)#1,231 |
| 66. | Portage Lakes | 0.36% | 0.10%(+0.253)#66 | 0.062%(+0.296)#1,235 |
| 67. | Geneva | 0.35% | 0.10%(+0.249)#67 | 0.062%(+0.292)#1,246 |
| 68. | Gettysburg | 0.35% | 0.10%(+0.244)#68 | 0.062%(+0.287)#1,270 |
| 69. | Chauncey | 0.34% | 0.10%(+0.239)#69 | 0.062%(+0.282)#1,284 |
| 70. | Irondale | 0.34% | 0.10%(+0.231)#70 | 0.062%(+0.274)#1,315 |
| 71. | Bellbrook | 0.33% | 0.10%(+0.223)#71 | 0.062%(+0.266)#1,336 |
| 72. | Ashtabula | 0.32% | 0.10%(+0.218)#72 | 0.062%(+0.261)#1,357 |
| 73. | Yorkville | 0.31% | 0.10%(+0.208)#73 | 0.062%(+0.251)#1,381 |
| 74. | Cumberland | 0.31% | 0.10%(+0.205)#74 | 0.062%(+0.248)#1,394 |
| 75. | Coshocton | 0.31% | 0.10%(+0.203)#75 | 0.062%(+0.246)#1,403 |
| 76. | Canton | 0.31% | 0.10%(+0.203)#76 | 0.062%(+0.246)#1,405 |
| 77. | Batavia | 0.31% | 0.10%(+0.202)#77 | 0.062%(+0.245)#1,409 |
| 78. | Beach City | 0.30% | 0.10%(+0.199)#78 | 0.062%(+0.242)#1,428 |
| 79. | Brookside | 0.30% | 0.10%(+0.196)#79 | 0.062%(+0.239)#1,436 |
| 80. | Richville | 0.30% | 0.10%(+0.193)#80 | 0.062%(+0.236)#1,444 |
| 81. | Brook Park | 0.30% | 0.10%(+0.193)#81 | 0.062%(+0.236)#1,448 |
| 82. | Hillsboro | 0.29% | 0.10%(+0.188)#82 | 0.062%(+0.231)#1,464 |
| 83. | Zanesville | 0.29% | 0.10%(+0.186)#83 | 0.062%(+0.229)#1,476 |
| 84. | Warren | 0.29% | 0.10%(+0.184)#84 | 0.062%(+0.227)#1,482 |
| 85. | Akron | 0.28% | 0.10%(+0.179)#85 | 0.062%(+0.222)#1,499 |
| 86. | Blue Ash | 0.28% | 0.10%(+0.173)#86 | 0.062%(+0.216)#1,509 |
| 87. | Park Layne | 0.28% | 0.10%(+0.172)#87 | 0.062%(+0.215)#1,511 |
| 88. | Carlisle | 0.27% | 0.10%(+0.169)#88 | 0.062%(+0.212)#1,519 |
| 89. | Parma | 0.27% | 0.10%(+0.163)#89 | 0.062%(+0.206)#1,538 |
| 90. | Youngstown | 0.26% | 0.10%(+0.159)#90 | 0.062%(+0.202)#1,561 |
| 91. | Wheelersburg | 0.26% | 0.10%(+0.153)#91 | 0.062%(+0.196)#1,579 |
| 92. | Mansfield | 0.23% | 0.10%(+0.126)#92 | 0.062%(+0.169)#1,689 |
| 93. | Columbus | 0.22% | 0.10%(+0.117)#93 | 0.062%(+0.160)#1,730 |
| 94. | Minerva | 0.22% | 0.10%(+0.111)#94 | 0.062%(+0.154)#1,756 |
| 95. | London | 0.21% | 0.10%(+0.109)#95 | 0.062%(+0.152)#1,765 |
| 96. | Polk | 0.21% | 0.10%(+0.108)#96 | 0.062%(+0.151)#1,768 |
| 97. | Toledo | 0.21% | 0.10%(+0.105)#97 | 0.062%(+0.148)#1,780 |
| 98. | Riverside | 0.20% | 0.10%(+0.100)#98 | 0.062%(+0.143)#1,803 |
| 99. | Rockford | 0.20% | 0.10%(+0.098)#99 | 0.062%(+0.141)#1,810 |
| 100. | Edison | 0.20% | 0.10%(+0.097)#100 | 0.062%(+0.140)#1,822 |
Common Questions
What are the Top 10 Cities with the Highest Percentage of Blackfeet Population in Ohio?
Top 10 Cities with the Highest Percentage of Blackfeet Population in Ohio are:
#1
6.25%
#2
5.80%
#3
3.45%
#4
2.64%
#5
2.49%
#6
2.33%
#7
2.07%
#8
2.04%
#9
2.02%
#10
1.77%
What city has the Highest Percentage of Blackfeet Population in Ohio?
Wightmans Grove has the Highest Percentage of Blackfeet Population in Ohio with 6.25%.
What is the Percentage of Blackfeet Population in the State of Ohio?
Percentage of Blackfeet Population in Ohio is 0.10%.
What is the Percentage of Blackfeet Population in the United States?
Percentage of Blackfeet Population in the United States is 0.062%.