Cities with the Highest Percentage of Blackfeet Population in Maryland
RELATED REPORTS & OPTIONS
Blackfeet
Maryland
Compare Cities
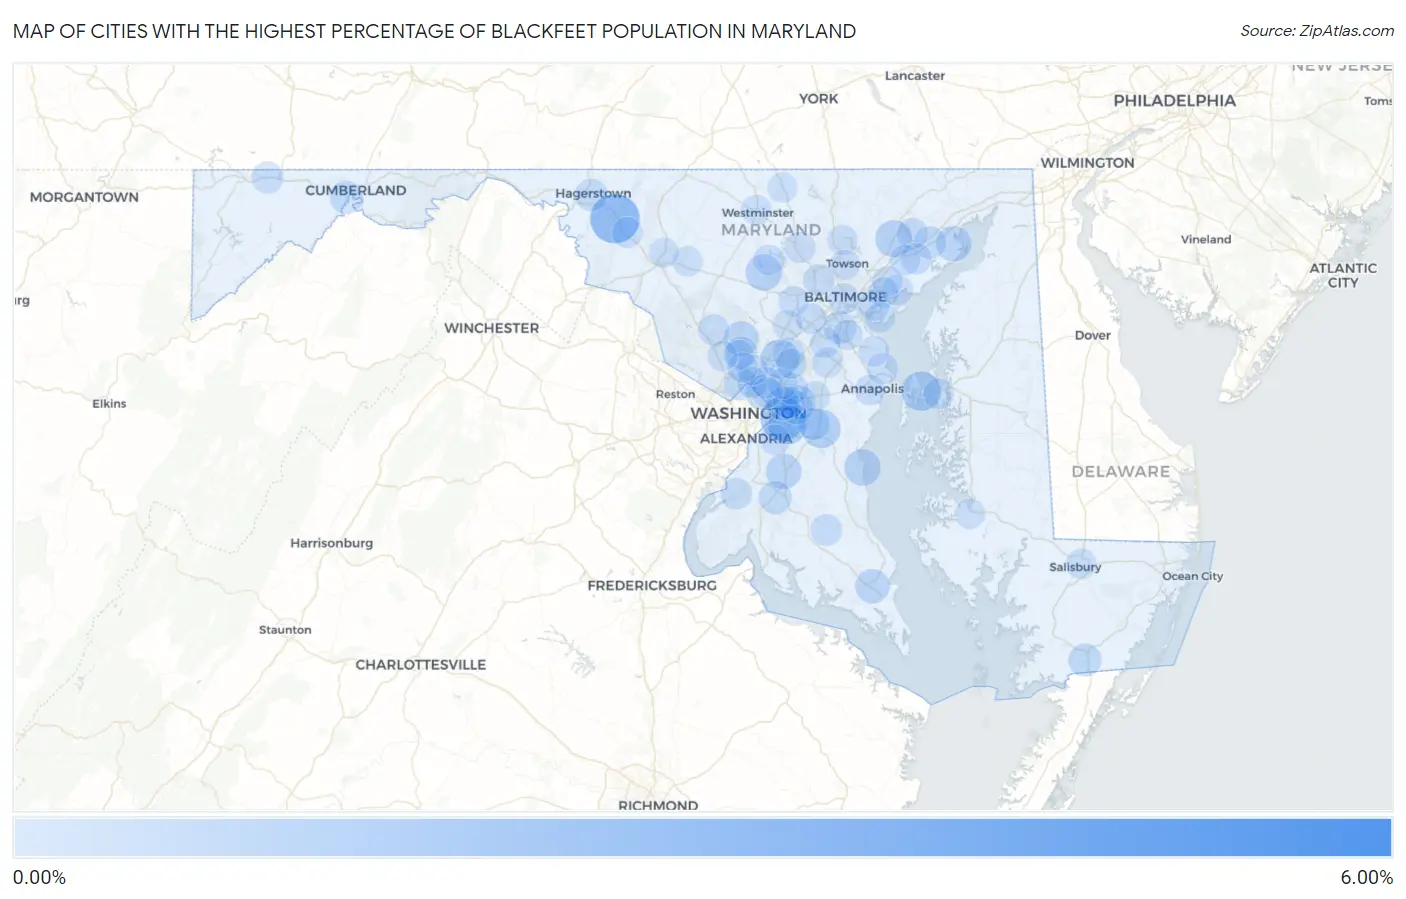
Map of Cities with the Highest Percentage of Blackfeet Population in Maryland
0.00%
6.00%
Cities with the Highest Percentage of Blackfeet Population in Maryland
| City | Blackfeet | vs State | vs National | |
| 1. | Graceham | 5.42% | 0.067%(+5.35)#1 | 0.062%(+5.36)#78 |
| 2. | Mount Lena | 2.33% | 0.067%(+2.27)#2 | 0.062%(+2.27)#186 |
| 3. | Walker Mill | 1.69% | 0.067%(+1.63)#3 | 0.062%(+1.63)#275 |
| 4. | Chester | 1.12% | 0.067%(+1.06)#4 | 0.062%(+1.06)#438 |
| 5. | Konterra | 1.03% | 0.067%(+0.964)#5 | 0.062%(+0.969)#472 |
| 6. | Marlboro Meadows | 1.01% | 0.067%(+0.945)#6 | 0.062%(+0.950)#477 |
| 7. | Forestville | 0.99% | 0.067%(+0.924)#7 | 0.062%(+0.930)#492 |
| 8. | Pleasant Hills | 0.82% | 0.067%(+0.749)#8 | 0.062%(+0.754)#606 |
| 9. | Sykesville | 0.77% | 0.067%(+0.700)#9 | 0.062%(+0.705)#645 |
| 10. | North Beach | 0.76% | 0.067%(+0.689)#10 | 0.062%(+0.694)#653 |
| 11. | Brandywine | 0.64% | 0.067%(+0.578)#11 | 0.062%(+0.583)#762 |
| 12. | Aberdeen Proving Ground | 0.63% | 0.067%(+0.562)#12 | 0.062%(+0.567)#782 |
| 13. | Olney | 0.59% | 0.067%(+0.525)#13 | 0.062%(+0.530)#828 |
| 14. | California | 0.53% | 0.067%(+0.461)#14 | 0.062%(+0.466)#908 |
| 15. | Mitchellville | 0.50% | 0.067%(+0.429)#15 | 0.062%(+0.434)#965 |
| 16. | Chillum | 0.49% | 0.067%(+0.426)#16 | 0.062%(+0.431)#970 |
| 17. | Woodlawn Cdp Prince George S County | 0.44% | 0.067%(+0.372)#17 | 0.062%(+0.378)#1,058 |
| 18. | Lake Arbor | 0.38% | 0.067%(+0.309)#18 | 0.062%(+0.314)#1,195 |
| 19. | Bowling Green | 0.36% | 0.067%(+0.296)#19 | 0.062%(+0.301)#1,220 |
| 20. | Landover | 0.36% | 0.067%(+0.289)#20 | 0.062%(+0.295)#1,241 |
| 21. | Waldorf | 0.35% | 0.067%(+0.282)#21 | 0.062%(+0.287)#1,265 |
| 22. | Ferndale | 0.35% | 0.067%(+0.281)#22 | 0.062%(+0.286)#1,272 |
| 23. | Chevy Chase | 0.34% | 0.067%(+0.270)#23 | 0.062%(+0.276)#1,308 |
| 24. | Pocomoke City | 0.32% | 0.067%(+0.258)#24 | 0.062%(+0.263)#1,348 |
| 25. | Hagerstown | 0.30% | 0.067%(+0.238)#25 | 0.062%(+0.243)#1,425 |
| 26. | Riverside | 0.30% | 0.067%(+0.237)#26 | 0.062%(+0.242)#1,429 |
| 27. | Brock Hall | 0.26% | 0.067%(+0.189)#27 | 0.062%(+0.194)#1,590 |
| 28. | Leisure World | 0.23% | 0.067%(+0.167)#28 | 0.062%(+0.172)#1,678 |
| 29. | Glenarden | 0.22% | 0.067%(+0.154)#29 | 0.062%(+0.159)#1,737 |
| 30. | Grantsville | 0.21% | 0.067%(+0.143)#30 | 0.062%(+0.148)#1,785 |
| 31. | Golden Beach | 0.20% | 0.067%(+0.137)#31 | 0.062%(+0.142)#1,805 |
| 32. | Laurel | 0.20% | 0.067%(+0.129)#32 | 0.062%(+0.134)#1,848 |
| 33. | Bryans Road | 0.17% | 0.067%(+0.108)#33 | 0.062%(+0.113)#1,971 |
| 34. | Lochearn | 0.17% | 0.067%(+0.100)#34 | 0.062%(+0.105)#2,011 |
| 35. | Montgomery Village | 0.16% | 0.067%(+0.097)#35 | 0.062%(+0.102)#2,022 |
| 36. | Seabrook | 0.15% | 0.067%(+0.088)#36 | 0.062%(+0.093)#2,075 |
| 37. | Dundalk | 0.15% | 0.067%(+0.084)#37 | 0.062%(+0.089)#2,104 |
| 38. | Woodlawn Cdp Baltimore County | 0.15% | 0.067%(+0.080)#38 | 0.062%(+0.085)#2,145 |
| 39. | Bel Air South | 0.14% | 0.067%(+0.077)#39 | 0.062%(+0.082)#2,163 |
| 40. | Myersville | 0.12% | 0.067%(+0.054)#40 | 0.062%(+0.059)#2,358 |
| 41. | Edgewood | 0.12% | 0.067%(+0.053)#41 | 0.062%(+0.058)#2,368 |
| 42. | Cape St Claire | 0.12% | 0.067%(+0.053)#42 | 0.062%(+0.058)#2,369 |
| 43. | Adelphi | 0.12% | 0.067%(+0.051)#43 | 0.062%(+0.056)#2,385 |
| 44. | Reisterstown | 0.12% | 0.067%(+0.049)#44 | 0.062%(+0.054)#2,417 |
| 45. | Baltimore | 0.11% | 0.067%(+0.039)#45 | 0.062%(+0.044)#2,515 |
| 46. | Silver Spring | 0.099% | 0.067%(+0.032)#46 | 0.062%(+0.037)#2,578 |
| 47. | Hyattsville | 0.091% | 0.067%(+0.024)#47 | 0.062%(+0.030)#2,646 |
| 48. | Grasonville | 0.090% | 0.067%(+0.023)#48 | 0.062%(+0.028)#2,657 |
| 49. | Eldersburg | 0.086% | 0.067%(+0.019)#49 | 0.062%(+0.024)#2,701 |
| 50. | Camp Springs | 0.082% | 0.067%(+0.015)#50 | 0.062%(+0.020)#2,755 |
| 51. | Bowleys Quarters | 0.074% | 0.067%(+0.007)#51 | 0.062%(+0.013)#2,837 |
| 52. | Annapolis | 0.074% | 0.067%(+0.007)#52 | 0.062%(+0.012)#2,846 |
| 53. | Essex | 0.073% | 0.067%(+0.007)#53 | 0.062%(+0.012)#2,850 |
| 54. | Severn | 0.067% | 0.067%(+0.001)#54 | 0.062%(+0.006)#2,925 |
| 55. | Lake Shore | 0.064% | 0.067%(-0.003)#55 | 0.062%(+0.002)#2,983 |
| 56. | Ilchester | 0.062% | 0.067%(-0.004)#56 | 0.062%(+0.001)#3,003 |
| 57. | Joppatowne | 0.060% | 0.067%(-0.007)#57 | 0.062%(-0.002)#3,036 |
| 58. | Ellicott City | 0.057% | 0.067%(-0.010)#58 | 0.062%(-0.005)#3,085 |
| 59. | Linganore | 0.051% | 0.067%(-0.016)#59 | 0.062%(-0.011)#3,169 |
| 60. | Greenbelt | 0.049% | 0.067%(-0.018)#60 | 0.062%(-0.013)#3,194 |
| 61. | Cambridge | 0.046% | 0.067%(-0.021)#61 | 0.062%(-0.016)#3,248 |
| 62. | Columbia | 0.044% | 0.067%(-0.023)#62 | 0.062%(-0.017)#3,283 |
| 63. | Odenton | 0.040% | 0.067%(-0.027)#63 | 0.062%(-0.022)#3,364 |
| 64. | Salisbury | 0.039% | 0.067%(-0.027)#64 | 0.062%(-0.022)#3,382 |
| 65. | Middle River | 0.039% | 0.067%(-0.028)#65 | 0.062%(-0.023)#3,402 |
| 66. | Kemp Mill | 0.035% | 0.067%(-0.031)#66 | 0.062%(-0.026)#3,450 |
| 67. | Edgemere | 0.034% | 0.067%(-0.033)#67 | 0.062%(-0.028)#3,482 |
| 68. | South Laurel | 0.032% | 0.067%(-0.035)#68 | 0.062%(-0.030)#3,524 |
| 69. | Cockeysville | 0.026% | 0.067%(-0.041)#69 | 0.062%(-0.036)#3,645 |
| 70. | Aspen Hill | 0.026% | 0.067%(-0.041)#70 | 0.062%(-0.036)#3,646 |
| 71. | Westminster | 0.025% | 0.067%(-0.042)#71 | 0.062%(-0.037)#3,662 |
| 72. | Wheaton | 0.023% | 0.067%(-0.044)#72 | 0.062%(-0.039)#3,695 |
| 73. | Manchester | 0.019% | 0.067%(-0.048)#73 | 0.062%(-0.043)#3,772 |
| 74. | Frederick | 0.014% | 0.067%(-0.053)#74 | 0.062%(-0.048)#3,864 |
| 75. | Bowie | 0.010% | 0.067%(-0.056)#75 | 0.062%(-0.051)#3,934 |
| 76. | Rockville | 0.0089% | 0.067%(-0.058)#76 | 0.062%(-0.053)#3,955 |
| 77. | Towson | 0.0087% | 0.067%(-0.058)#77 | 0.062%(-0.053)#3,961 |
| 78. | Glen Burnie | 0.0084% | 0.067%(-0.058)#78 | 0.062%(-0.053)#3,967 |
Common Questions
What are the Top 10 Cities with the Highest Percentage of Blackfeet Population in Maryland?
Top 10 Cities with the Highest Percentage of Blackfeet Population in Maryland are:
#1
2.33%
#2
1.69%
#3
1.12%
#4
1.03%
#5
1.01%
#6
0.99%
#7
0.82%
#8
0.77%
#9
0.76%
#10
0.64%
What city has the Highest Percentage of Blackfeet Population in Maryland?
Mount Lena has the Highest Percentage of Blackfeet Population in Maryland with 2.33%.
What is the Percentage of Blackfeet Population in the State of Maryland?
Percentage of Blackfeet Population in Maryland is 0.067%.
What is the Percentage of Blackfeet Population in the United States?
Percentage of Blackfeet Population in the United States is 0.062%.